Entra ID Contracts with Hybrid/Remote/WFH Options

Microsoft Entra ID (formerly Azure Active Directory, Azure AD)
UK > Work from Home

The table below provides summary statistics for remote or hybrid contract work requiring Entra ID skills. It includes a benchmarking guide to the contractor rates offered in vacancies that cited Entra ID over the 6 months leading up to 1 May 2025, comparing them to the same period in the previous two years.

6 months to
1 May 2025
Same period 2024 Same period 2023
Rank 99 140 118
Rank change year-on-year +41 -22 +81
Contract jobs citing Entra ID 251 232 523
As % of all contract jobs with a WFH option 2.53% 1.51% 2.02%
As % of the Cloud Services category 6.37% 4.17% 5.11%
Number of daily rates quoted 185 165 366
10th Percentile £313 £330 £338
25th Percentile £400 £425 £422
Median daily rate (50th Percentile) £500 £525 £530
Median % change year-on-year -4.76% -0.94% +3.41%
75th Percentile £600 £613 £650
90th Percentile £663 £695 £728
UK median daily rate £500 £500 £525
% change year-on-year - -4.76% +1.94%
Number of hourly rates quoted 0 0 11
10th Percentile - - £52.50
25th Percentile - - £54.00
Median hourly rate - - £63.00
75th Percentile - - £66.00
90th Percentile - - -
UK median hourly rate £23.59 £17.80 £54.00
% change year-on-year +32.53% -67.04% +95.71%

All Cloud Skills
Work from Home

Entra ID falls under the Cloud Services category. For comparison with the information above, the following table provides summary statistics for all contract job vacancies with remote or hybrid options requiring cloud computing skills.

Contract vacancies with a requirement for cloud computing skills 3,940 5,557 10,236
As % of all contract jobs with a WFH option 39.78% 36.21% 39.59%
Number of daily rates quoted 2,887 3,982 7,514
10th Percentile £351 £350 £373
25th Percentile £425 £430 £450
Median daily rate (50th Percentile) £523 £525 £550
Median % change year-on-year -0.38% -4.55% -
75th Percentile £630 £638 £650
90th Percentile £750 £738 £743
UK median daily rate £520 £525 £550
% change year-on-year -0.95% -4.55% -
Number of hourly rates quoted 42 89 125
10th Percentile £16.00 £15.50 £16.43
25th Percentile £25.25 £17.00 £21.31
Median hourly rate £35.00 £26.00 £55.00
Median % change year-on-year +34.62% -52.73% +83.33%
75th Percentile £70.63 £50.25 £70.00
90th Percentile £92.50 £64.37 £78.40
UK median hourly rate £27.35 £21.00 £35.00
% change year-on-year +30.24% -40.00% +62.79%

Entra ID
Trend for Jobs with a WFH Option

Job vacancies with remote working options citing Entra ID as a proportion of all IT jobs advertised.
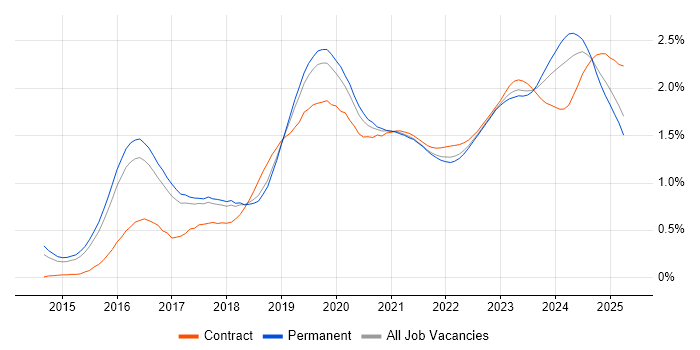
Entra ID trend for jobs with Hybrid/Remote/WFH options

Entra ID
Daily Rate Trend for Jobs with a WFH Option

3-month moving average daily rate quoted in job vacancies with remote working options citing Entra ID.

Entra ID daily rate for jobs with a WFH option

Entra ID
Daily Rate Histogram for Jobs with a WFH Option

Daily rate distribution for jobs with remote working options citing Entra ID over the 6 months to 1 May 2025.

Entra ID daily rate histogram for jobs with a WFH option

Entra ID
Hourly Rate Trend for Jobs with a WFH Option

3-month moving average hourly rate quoted in job vacancies with remote working options citing Entra ID.

Entra ID hourly rate for jobs with a WFH option

Entra ID
Co-occurring Skills and Capabilities with WFH Options by Category

The follow tables expand on the table above by listing co-occurrences grouped by category. The same employment type, locality and period is covered with up to 20 co-occurrences shown in each of the following categories:

Application Platforms
1 46 (18.33%) Microsoft Exchange
2 40 (15.94%) SharePoint
3 5 (1.99%) nginx
3 5 (1.99%) Traefik
4 3 (1.20%) Confluence
5 2 (0.80%) SAS
6 1 (0.40%) Apache
6 1 (0.40%) BizTalk Server
6 1 (0.40%) Blackberry Enterprise Server
6 1 (0.40%) CMS
6 1 (0.40%) IIS
6 1 (0.40%) Skype for Business
Applications
1 14 (5.58%) Microsoft Office
2 4 (1.59%) MS Visio
3 2 (0.80%) Microsoft Excel
3 2 (0.80%) Microsoft PowerPoint
4 1 (0.40%) Notion
Business Applications
1 4 (1.59%) Dynamics CRM
1 4 (1.59%) Sparx Enterprise Architect
2 2 (0.80%) Oracle EBS
3 1 (0.40%) SAP S/4HANA
Cloud Services
1 220 (87.65%) Azure
2 116 (46.22%) Microsoft 365
3 36 (14.34%) AWS
4 29 (11.55%) SaaS
5 28 (11.16%) OneDrive
6 23 (9.16%) Power Platform
7 15 (5.98%) IaaS
8 12 (4.78%) Azure DevOps
8 12 (4.78%) GCP
9 11 (4.38%) Azure AKS
9 11 (4.38%) Microsoft Purview
10 10 (3.98%) Azure Service Bus
11 9 (3.59%) AWS CloudFormation
11 9 (3.59%) Azure Cosmos DB
11 9 (3.59%) Azure Logic Apps
11 9 (3.59%) GitHub
11 9 (3.59%) PaaS
12 8 (3.19%) Azure API Management
12 8 (3.19%) Azure Sentinel
12 8 (3.19%) GitHub Actions
Communications & Networking
1 33 (13.15%) DNS
2 30 (11.95%) Firewall
3 23 (9.16%) DHCP
4 15 (5.98%) VPN
4 15 (5.98%) WAN
5 12 (4.78%) Wi-Fi
6 10 (3.98%) LAN
7 9 (3.59%) Network Security
7 9 (3.59%) TCP/IP
8 8 (3.19%) Wireless
9 6 (2.39%) Internet
9 6 (2.39%) Intrusion Detection
10 4 (1.59%) Skype
10 4 (1.59%) VLAN
11 3 (1.20%) FTP
11 3 (1.20%) iSCSI
11 3 (1.20%) Remote Desktop
11 3 (1.20%) SD-WAN
11 3 (1.20%) SMTP
11 3 (1.20%) Telnet
Database & Business Intelligence
1 26 (10.36%) SQL Server
2 11 (4.38%) Power BI
3 10 (3.98%) Azure SQL Database
4 7 (2.79%) MongoDB
5 6 (2.39%) Oracle Database
6 4 (1.59%) Apache Cassandra
6 4 (1.59%) Big Data
6 4 (1.59%) Hadoop
7 3 (1.20%) BigQuery
7 3 (1.20%) Data Lake
7 3 (1.20%) Redis
8 2 (0.80%) Data Warehouse
9 1 (0.40%) NoSQL
9 1 (0.40%) Power Query
9 1 (0.40%) SQL Server Integration Services
Development Applications
1 10 (3.98%) MSI
2 9 (3.59%) GitLab
3 7 (2.79%) Jenkins
4 5 (1.99%) JIRA
5 3 (1.20%) Oracle Forms
6 2 (0.80%) CircleCI
6 2 (0.80%) Git
7 1 (0.40%) Bitbucket
7 1 (0.40%) Moq
7 1 (0.40%) Snyk
General
1 70 (27.89%) Social Skills
2 59 (23.51%) Finance
3 19 (7.57%) Public Sector
4 17 (6.77%) Analytical Skills
5 16 (6.37%) Inclusion and Diversity
6 8 (3.19%) Banking
7 6 (2.39%) Legal
8 5 (1.99%) Telecoms
9 4 (1.59%) Influencing Skills
9 4 (1.59%) Law
9 4 (1.59%) Presentation Skills
10 2 (0.80%) Manufacturing
11 1 (0.40%) Advertising
11 1 (0.40%) Automotive
11 1 (0.40%) Billing
11 1 (0.40%) Documentation Skills
11 1 (0.40%) Front Office
11 1 (0.40%) Organisational Skills
11 1 (0.40%) Retail
Job Titles
1 50 (19.92%) Architect
2 36 (14.34%) Senior
3 25 (9.96%) Support Engineer
4 23 (9.16%) Microsoft 365 Engineer
5 19 (7.57%) Azure Engineer
6 17 (6.77%) Analyst
6 17 (6.77%) Lead
7 16 (6.37%) IT Support
8 15 (5.98%) Developer
9 13 (5.18%) Consultant
10 12 (4.78%) Solutions Architect
11 11 (4.38%) DevOps Engineer
12 10 (3.98%) Active Directory Engineer
13 9 (3.59%) IAM Specialist
13 9 (3.59%) Infrastructure Engineer
13 9 (3.59%) Senior DevOps
14 8 (3.19%) Cloud Engineer
14 8 (3.19%) Data Architect
14 8 (3.19%) Infrastructure Specialist
14 8 (3.19%) Security Engineer
Libraries, Frameworks & Software Standards
1 24 (9.56%) OAuth
2 19 (7.57%) Kafka
3 18 (7.17%) SailPoint
4 16 (6.37%) .NET
4 16 (6.37%) SAML
5 14 (5.58%) OpenID
6 10 (3.98%) LDAP
7 7 (2.79%) cloud-init
7 7 (2.79%) Keycloak
8 6 (2.39%) ARM Templates
8 6 (2.39%) Node.js
8 6 (2.39%) React
8 6 (2.39%) REST
9 5 (1.99%) CSS
9 5 (1.99%) HTML
9 5 (1.99%) Middleware
9 5 (1.99%) NumPy
9 5 (1.99%) OAuth2
9 5 (1.99%) Pandas
9 5 (1.99%) RESTful
Miscellaneous
1 15 (5.98%) PKI
2 13 (5.18%) Onboarding
3 12 (4.78%) Hybrid Cloud
4 11 (4.38%) Data Centre
4 11 (4.38%) Enterprise Software
5 10 (3.98%) Cloud Native
5 10 (3.98%) Self-Motivation
6 7 (2.79%) Security Posture
7 5 (1.99%) Driving Licence
7 5 (1.99%) Product Ownership
8 4 (1.59%) Management Information System
8 4 (1.59%) Reinsurance
9 3 (1.20%) IVR
9 3 (1.20%) Linux Command Line
10 2 (0.80%) Blackberry
10 2 (0.80%) Cyberattack
10 2 (0.80%) Legacy Systems
10 2 (0.80%) Low-Code
10 2 (0.80%) Replication
10 2 (0.80%) Taxonomies
Operating Systems
1 83 (33.07%) Windows
2 32 (12.75%) Windows Server
3 25 (9.96%) Linux
4 16 (6.37%) Unix
5 13 (5.18%) Android
5 13 (5.18%) Apple iOS
6 7 (2.79%) CentOS
6 7 (2.79%) Red Hat Enterprise Linux
6 7 (2.79%) Windows 10
7 4 (1.59%) VMS
7 4 (1.59%) Windows Server 2016
8 2 (0.80%) Mac OS
8 2 (0.80%) Windows 7
9 1 (0.40%) Windows Server 2019
Processes & Methodologies
1 64 (25.50%) Problem-Solving
2 60 (23.90%) Migration
3 54 (21.51%) Identity Access Management
4 45 (17.93%) Identity Management
5 39 (15.54%) Cloud Security
5 39 (15.54%) RBAC
6 37 (14.74%) DevOps
7 32 (12.75%) ITIL
8 31 (12.35%) Agile
9 27 (10.76%) Multi-Factor Authentication
10 25 (9.96%) CI/CD
11 21 (8.37%) Infrastructure as Code
12 18 (7.17%) Infrastructure Engineering
13 17 (6.77%) Information Security
13 17 (6.77%) ITSM
14 15 (5.98%) B2C
14 15 (5.98%) Collaborative Working
14 15 (5.98%) Cybersecurity
15 14 (5.58%) Privileged Identity Management
16 13 (5.18%) Analytics
Programming Languages
1 65 (25.90%) PowerShell
2 26 (10.36%) Python
2 26 (10.36%) SQL
3 16 (6.37%) C#
4 12 (4.78%) Bicep
5 10 (3.98%) JavaScript
6 8 (3.19%) Bash
7 7 (2.79%) Go
8 4 (1.59%) Java
9 2 (0.80%) PL/SQL
9 2 (0.80%) Ruby
9 2 (0.80%) T-SQL
10 1 (0.40%) C
10 1 (0.40%) Data Analysis Expressions
10 1 (0.40%) Kusto Query Language
10 1 (0.40%) TypeScript
10 1 (0.40%) VB
10 1 (0.40%) VBScript
Qualifications
1 44 (17.53%) Security Cleared
2 39 (15.54%) SC Cleared
3 21 (8.37%) Azure Certification
4 15 (5.98%) Degree
4 15 (5.98%) Microsoft Certification
5 12 (4.78%) AWS Certification
6 5 (1.99%) BPSS Clearance
7 4 (1.59%) Computer Science Degree
7 4 (1.59%) CREST Certified
8 2 (0.80%) CISM
8 2 (0.80%) CISSP
8 2 (0.80%) Cyber Scheme
8 2 (0.80%) DV Cleared
8 2 (0.80%) ITIL Certification
8 2 (0.80%) Master's Degree
8 2 (0.80%) OSCE
9 1 (0.40%) DBS Check
9 1 (0.40%) MCSE
9 1 (0.40%) PRINCE2 Certification
9 1 (0.40%) SSCP
Quality Assurance & Compliance
1 18 (7.17%) GDPR
2 11 (4.38%) Sarbanes-Oxley
3 8 (3.19%) HIPAA
4 7 (2.79%) NCSC
5 5 (1.99%) Accessibility
6 4 (1.59%) ISO/IEC 27001
7 3 (1.20%) GRC
7 3 (1.20%) NIST
7 3 (1.20%) PCI DSS
7 3 (1.20%) SLA
7 3 (1.20%) SOC 2
8 1 (0.40%) Cyber Essentials
8 1 (0.40%) Cyber Essentials PLUS
8 1 (0.40%) Disclosure Scotland
8 1 (0.40%) Government Security Classifications
8 1 (0.40%) HMG Security Policy Framework
System Software
1 159 (63.35%) Active Directory
2 14 (5.58%) VMware Infrastructure
3 11 (4.38%) Virtual Machines
4 6 (2.39%) Hyper-V
5 5 (1.99%) Virtual Servers
5 5 (1.99%) vSphere
6 4 (1.59%) RACF
6 4 (1.59%) Virtual Desktop
7 3 (1.20%) Microsoft Virtual Server
7 3 (1.20%) NFS
8 2 (0.80%) BitLocker
8 2 (0.80%) Docker
9 1 (0.40%) Firmware
9 1 (0.40%) Microsoft App-V
9 1 (0.40%) VMware ESXi
9 1 (0.40%) VMware NSX
9 1 (0.40%) XenDesktop
Systems Management
1 63 (25.10%) Microsoft Intune
2 35 (13.94%) Single Sign-On
3 30 (11.95%) Terraform
4 20 (7.97%) Kubernetes
5 17 (6.77%) SCCM
6 9 (3.59%) Grafana
7 8 (3.19%) Istio
7 8 (3.19%) Jamf Pro
7 8 (3.19%) Prometheus
7 8 (3.19%) ZABBIX
8 7 (2.79%) Consul
8 7 (2.79%) linkerd
8 7 (2.79%) Packer
8 7 (2.79%) Rancher
9 5 (1.99%) Active Directory Federation Services
9 5 (1.99%) Ansible
9 5 (1.99%) HAProxy
9 5 (1.99%) WSUS
10 4 (1.59%) PingFederate
11 3 (1.20%) FortiGate
Vendors
1 149 (59.36%) Microsoft
2 21 (8.37%) Okta
2 21 (8.37%) VMware
3 20 (7.97%) CyberArk
4 14 (5.58%) Apple
4 14 (5.58%) ServiceNow
4 14 (5.58%) Splunk
5 13 (5.18%) Cisco
6 12 (4.78%) Oracle
7 11 (4.38%) Google
8 8 (3.19%) Ping Identity
9 6 (2.39%) Citrix
9 6 (2.39%) Palo Alto
10 5 (1.99%) Databricks
10 5 (1.99%) ESET
10 5 (1.99%) Zscaler
11 4 (1.59%) BiZZdesign
11 4 (1.59%) Informatica
11 4 (1.59%) Meraki
11 4 (1.59%) Sparx