AWS Jobs in England

Amazon Web Services (AWS)
UK > England

The following table provides summary statistics for permanent job vacancies advertised in England with a requirement for AWS skills. Included is a benchmarking guide to the salaries offered in vacancies that have cited AWS over the 6 months to 7 December 2023 with a comparison to the same period in the previous 2 years.

6 months to
7 Dec 2023
Same period 2022 Same period 2021
Rank 11 7 4
Rank change year-on-year -4 -3 -1
Permanent jobs citing AWS 6,379 18,549 23,270
As % of all permanent jobs advertised in England 13.75% 17.22% 20.80%
As % of the Cloud Services category 32.02% 40.14% 44.07%
Number of salaries quoted 5,062 11,832 15,613
10th Percentile £44,000 £45,000 £42,500
25th Percentile £55,000 £56,000 £52,500
Median annual salary (50th Percentile) £72,500 £75,000 £70,000
Median % change year-on-year -3.33% +7.14% +7.69%
75th Percentile £92,500 £93,750 £91,250
90th Percentile £115,000 £115,000 £110,000
UK median annual salary £70,000 £74,500 £70,000
% change year-on-year -6.04% +6.43% +7.69%

All Cloud Skills
England

AWS is in the Cloud Services category. The following table is for comparison with the above and provides summary statistics for all permanent job vacancies advertised in England with a requirement for cloud computing skills.

Permanent vacancies with a requirement for cloud computing skills 19,923 46,215 52,798
As % of all permanent jobs advertised in England 42.94% 42.89% 47.20%
Number of salaries quoted 16,115 31,877 37,864
10th Percentile £32,700 £34,421 £32,750
25th Percentile £45,639 £46,250 £45,000
Median annual salary (50th Percentile) £62,500 £65,000 £60,000
Median % change year-on-year -3.85% +8.33% -
75th Percentile £82,548 £85,000 £81,250
90th Percentile £101,250 £102,500 £97,500
UK median annual salary £62,500 £65,000 £60,000
% change year-on-year -3.85% +8.33% +4.35%

AWS
Job Vacancy Trend in England

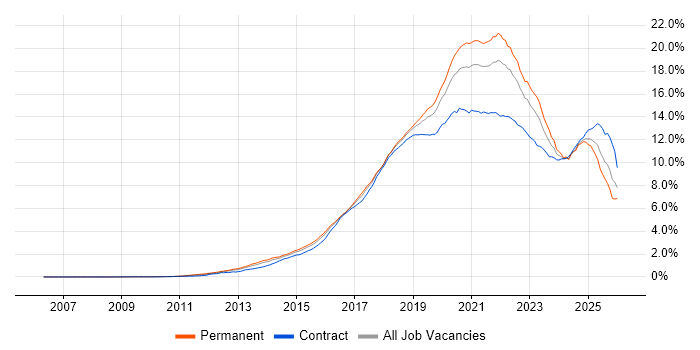
Job postings citing AWS as a proportion of all IT jobs advertised in England.

Job vacancy trend for AWS in England

AWS
Salary Trend in England

3-month moving average salary quoted in jobs citing AWS in England.

Salary trend for AWS in England

AWS
Salary Histogram in England

Salary distribution for jobs citing AWS in England over the 6 months to 7 December 2023.

Salary histogram for AWS in England

AWS
Job Locations in England

The table below looks at the demand and provides a guide to the median salaries quoted in IT jobs citing AWS within the England region over the 6 months to 7 December 2023. The 'Rank Change' column provides an indication of the change in demand within each location based on the same 6 month period last year.

Location Rank Change
on Same Period
Last Year
Matching
Permanent
IT Job Ads
Median Salary
Past 6 Months
Median Salary
% Change
on Same Period
Last Year
Live
Jobs
London -2 3,114 £85,000 - 1,638
North of England -2 987 £60,000 -5.51% 550
South West +7 773 £60,000 - 224
South East -6 671 £65,000 - 538
North West 0 549 £60,000 -7.69% 312
Midlands 0 485 £57,500 -7.26% 205
Yorkshire -4 384 £65,000 +7.44% 171
West Midlands -2 286 £56,500 -8.87% 115
East Midlands -4 201 £60,000 - 89
East of England -9 168 £65,000 +8.33% 135
North East -5 54 £60,000 -14.29% 71
AWS
UK

AWS
Co-occurring Skills and Capabilities in England by Category

The follow tables expand on the table above by listing co-occurrences grouped by category. The same employment type, locality and period is covered with up to 20 co-occurrences shown in each of the following categories:

Application Platforms
1 202 (3.17%) Apache
2 199 (3.12%) Apache Airflow
3 146 (2.29%) Apache Spark
4 140 (2.19%) SharePoint
5 106 (1.66%) Confluence
6 75 (1.18%) MS Exchange
7 56 (0.88%) IIS
8 44 (0.69%) nginx
9 41 (0.64%) CMS
10 26 (0.41%) OpenStack
11 23 (0.36%) Tomcat
12 21 (0.33%) WordPress
13 16 (0.25%) JBoss
14 15 (0.24%) Drupal
15 12 (0.19%) Red Hat Fuse
16 11 (0.17%) WebSphere
17 10 (0.16%) Apache Solr
17 10 (0.16%) Luigi
18 7 (0.11%) SAS
19 6 (0.094%) Jupyter
Applications
1 77 (1.21%) Microsoft Office
2 41 (0.64%) Microsoft Excel
3 19 (0.30%) MS Visio
4 12 (0.19%) Microsoft Project
5 7 (0.11%) Adobe XD
5 7 (0.11%) AutoCAD
5 7 (0.11%) PTC Creo
5 7 (0.11%) SOLIDWORKS
5 7 (0.11%) Trello
6 5 (0.078%) Microsoft PowerPoint
7 3 (0.047%) 3ds Max
7 3 (0.047%) Blender
7 3 (0.047%) Chatbot
7 3 (0.047%) Maya
8 2 (0.031%) Adobe Creative Suite
8 2 (0.031%) Sketch
8 2 (0.031%) Spreadsheet
8 2 (0.031%) UXPin
8 2 (0.031%) Zeplin
Business Applications
1 11 (0.17%) Unit4 Business World
2 10 (0.16%) Oracle EBS
3 7 (0.11%) Payment Gateway
3 7 (0.11%) SAP Business One
4 6 (0.094%) Dynamics CRM
4 6 (0.094%) Exstream
4 6 (0.094%) Magento
4 6 (0.094%) Shopify
5 5 (0.078%) NetSuite
5 5 (0.078%) SAP ERP
6 4 (0.063%) Dynamics NAV
6 4 (0.063%) IBM Planning Analytics
7 3 (0.047%) Remedy ITSM
7 3 (0.047%) SAP S/4HANA
8 2 (0.031%) Fidessa
8 2 (0.031%) Salesforce CRM
8 2 (0.031%) ScheduALL
9 1 (0.016%) Adobe Campaign
9 1 (0.016%) Oracle Applications
9 1 (0.016%) SAP GTS
Cloud Services
1 3,135 (49.15%) Azure
2 1,630 (25.55%) GCP
3 677 (10.61%) Serverless
4 471 (7.38%) SaaS
5 427 (6.69%) Microsoft 365
6 361 (5.66%) AWS Lambda
7 332 (5.20%) GitHub
8 301 (4.72%) Amazon S3
9 299 (4.69%) AWS CloudFormation
10 291 (4.56%) OpenShift
11 260 (4.08%) PaaS
12 241 (3.78%) IaaS
13 239 (3.75%) Amazon EC2
14 237 (3.72%) Azure DevOps
15 220 (3.45%) Cloud Computing
16 174 (2.73%) Entra ID
17 172 (2.70%) Amazon ECS
18 162 (2.54%) Power Platform
19 138 (2.16%) Amazon EKS
20 119 (1.87%) Snowflake
Communications & Networking
1 327 (5.13%) DNS
2 285 (4.47%) Firewall
3 246 (3.86%) TCP/IP
4 244 (3.83%) DHCP
5 188 (2.95%) WAN
6 177 (2.77%) VPN
7 159 (2.49%) HTTP
8 135 (2.12%) LAN
9 115 (1.80%) Network Security
10 101 (1.58%) Internet
11 88 (1.38%) SAN
12 70 (1.10%) Wireless
13 69 (1.08%) VLAN
14 62 (0.97%) SD-WAN
15 54 (0.85%) Wi-Fi
16 49 (0.77%) BGP
17 47 (0.74%) SMTP
18 43 (0.67%) OSPF
19 41 (0.64%) Structured Cabling
20 37 (0.58%) Intrusion Detection
Database & Business Intelligence
1 462 (7.24%) PostgreSQL
2 391 (6.13%) NoSQL
3 331 (5.19%) MySQL
4 315 (4.94%) Data Warehouse
5 290 (4.55%) MongoDB
6 284 (4.45%) SQL Server
7 269 (4.22%) Amazon RDS
8 223 (3.50%) Elasticsearch
9 215 (3.37%) Big Data
10 195 (3.06%) Data Lake
11 164 (2.57%) Amazon Redshift
12 162 (2.54%) Relational Database
13 150 (2.35%) DynamoDB
14 147 (2.30%) Hadoop
15 144 (2.26%) Power BI
16 127 (1.99%) Amazon Athena
17 110 (1.72%) Redis
18 106 (1.66%) Apache Ignite
18 106 (1.66%) Tableau
19 79 (1.24%) Oracle Database
Development Applications
1 596 (9.34%) Jenkins
2 496 (7.78%) Git
3 278 (4.36%) JIRA
4 271 (4.25%) GitLab
5 134 (2.10%) Cucumber
6 123 (1.93%) Maven
7 115 (1.80%) Artifactory
8 108 (1.69%) Bitbucket
9 106 (1.66%) Cypress.io
10 99 (1.55%) Selenium
11 85 (1.33%) Gradle
12 79 (1.24%) JUnit
13 74 (1.16%) Atlassian Bamboo
14 66 (1.03%) CircleCI
15 65 (1.02%) TeamCity
16 60 (0.94%) SonarQube
17 43 (0.67%) IntelliJ
17 43 (0.67%) Sonatype Nexus
18 41 (0.64%) Mockito
19 34 (0.53%) Jasmine
General
1 1,514 (23.73%) Finance
2 1,160 (18.18%) Social Skills
3 468 (7.34%) Analytical Skills
4 436 (6.83%) Banking
5 369 (5.78%) Front Office
6 335 (5.25%) Inclusion and Diversity
7 251 (3.93%) Public Sector
8 244 (3.83%) Retail
9 176 (2.76%) Marketing
10 147 (2.30%) Investment Banking
11 142 (2.23%) Telecoms
12 107 (1.68%) Presentation Skills
13 93 (1.46%) Law
14 87 (1.36%) Aerospace
15 76 (1.19%) Financial Institution
16 69 (1.08%) Games
16 69 (1.08%) Tech for Good
17 64 (1.00%) Legal
18 59 (0.92%) Manufacturing
19 46 (0.72%) Health Technology
Job Titles
1 1,628 (25.52%) Developer
2 1,386 (21.73%) Senior
3 789 (12.37%) Software Engineer
4 675 (10.58%) Architect
5 665 (10.42%) DevOps Engineer
6 657 (10.30%) Lead
7 474 (7.43%) Java Developer
8 451 (7.07%) AWS Engineer
9 407 (6.38%) Senior Developer
10 398 (6.24%) Data Engineer
11 338 (5.30%) Infrastructure Engineer
12 312 (4.89%) Solutions Architect
13 290 (4.55%) Full Stack Developer
14 270 (4.23%) Cloud Engineer
15 256 (4.01%) Developer/Software Engineer
16 227 (3.56%) .NET Developer
16 227 (3.56%) AWS DevOps
17 226 (3.54%) Python Engineer
18 210 (3.29%) AWS DevOps Engineer
19 195 (3.06%) Senior Software Engineer
Libraries, Frameworks & Software Standards
1 933 (14.63%) React
2 636 (9.97%) .NET
3 520 (8.15%) Node.js
4 464 (7.27%) AngularJS
5 452 (7.09%) Spring
6 418 (6.55%) Kafka
7 384 (6.02%) Spring Boot
8 342 (5.36%) HTML
9 273 (4.28%) CSS
10 270 (4.23%) REST
11 230 (3.61%) RESTful
12 213 (3.34%) Vue
13 204 (3.20%) Redux
14 189 (2.96%) .NET Core
15 166 (2.60%) ASP.NET
16 154 (2.41%) JSON
17 136 (2.13%) RabbitMQ
18 121 (1.90%) Laravel
19 115 (1.80%) gRPC
20 113 (1.77%) Pandas
Miscellaneous
1 358 (5.61%) Cloud Native
2 322 (5.05%) Public Cloud
3 230 (3.61%) Product Ownership
4 205 (3.21%) Fixed Income
5 194 (3.04%) Greenfield Project
6 185 (2.90%) Data Centre
7 176 (2.76%) Derivative
8 170 (2.66%) Distributed Systems
9 160 (2.51%) Hedge funds
10 140 (2.19%) Foreign Exchange (FX)
11 135 (2.12%) Self-Motivation
12 130 (2.04%) Equities
13 122 (1.91%) Hybrid Cloud
14 115 (1.80%) Private Cloud
15 107 (1.68%) Data Structures
16 98 (1.54%) Algorithms
17 89 (1.40%) Cyberattack
17 89 (1.40%) Management Information System
18 80 (1.25%) Enterprise Software
19 78 (1.22%) Onboarding
Operating Systems
1 1,016 (15.93%) Linux
2 677 (10.61%) Windows
3 352 (5.52%) Windows Server
4 204 (3.20%) Unix
5 137 (2.15%) Red Hat Enterprise Linux
6 77 (1.21%) Android
7 66 (1.03%) Ubuntu
8 65 (1.02%) Mac OS
9 58 (0.91%) Apple iOS
9 58 (0.91%) Windows 10
10 54 (0.85%) Windows Server 2019
11 47 (0.74%) Windows Server 2016
12 42 (0.66%) CentOS
12 42 (0.66%) Windows Server 2012
13 28 (0.44%) Debian
14 21 (0.33%) Mac OS X
14 21 (0.33%) Solaris
15 12 (0.19%) VMS
16 11 (0.17%) AIX
16 11 (0.17%) HPUX
Processes & Methodologies
1 2,279 (35.73%) Agile
2 1,987 (31.15%) DevOps
3 1,521 (23.84%) CI/CD
4 1,354 (21.23%) Software Engineering
5 988 (15.49%) Microservices
6 821 (12.87%) Problem-Solving
7 761 (11.93%) Infrastructure as Code
8 655 (10.27%) Full Stack Development
9 624 (9.78%) Analytics
10 603 (9.45%) Mentoring
11 594 (9.31%) Containerisation
12 529 (8.29%) Computer Science
13 469 (7.35%) Roadmaps
14 466 (7.31%) TDD
15 461 (7.23%) Fintech
16 455 (7.13%) Scrum
17 447 (7.01%) Migration
18 421 (6.60%) Actionable Insight
18 421 (6.60%) Infrastructure Engineering
19 419 (6.57%) Artificial Intelligence
Programming Languages
1 2,166 (33.96%) Python
2 1,754 (27.50%) Java
3 1,322 (20.72%) SQL
4 1,130 (17.71%) JavaScript
5 714 (11.19%) TypeScript
6 665 (10.42%) C#
7 556 (8.72%) PowerShell
8 497 (7.79%) Bash
9 268 (4.20%) Go
10 237 (3.72%) PHP
11 210 (3.29%) Kotlin
12 204 (3.20%) C++
13 151 (2.37%) Ruby
14 122 (1.91%) Scala
15 102 (1.60%) Perl
16 86 (1.35%) PL/SQL
17 70 (1.10%) Shell Script
18 69 (1.08%) R
19 64 (1.00%) Rust
20 53 (0.83%) T-SQL
Qualifications
1 856 (13.42%) Security Cleared
2 788 (12.35%) Degree
3 481 (7.54%) SC Cleared
4 350 (5.49%) Computer Science Degree
5 313 (4.91%) AWS Certification
6 282 (4.42%) DV Cleared
7 167 (2.62%) Master's Degree
8 113 (1.77%) Cisco Certification
9 110 (1.72%) AWS Certified Solutions Architect
9 110 (1.72%) TOGAF Certification
10 105 (1.65%) CISSP
11 90 (1.41%) Azure Certification
12 84 (1.32%) Microsoft Certification
13 56 (0.88%) CCNP
14 49 (0.77%) CCNA
15 44 (0.69%) AWS Certified Cloud Practitioner
16 43 (0.67%) PhD
17 38 (0.60%) (ISC)2 CCSP
17 38 (0.60%) AWS Certified DevOps Engineer
18 33 (0.52%) AWS Certified Developer
Quality Assurance & Compliance
1 339 (5.31%) QA
2 119 (1.87%) Data Quality
3 94 (1.47%) ISO/IEC 27001
4 67 (1.05%) NIST
5 53 (0.83%) SLA
6 46 (0.72%) NCSC
7 42 (0.66%) GDPR
8 39 (0.61%) Cyber Essentials
9 34 (0.53%) PCI DSS
10 33 (0.52%) Accessibility
11 21 (0.33%) SOC 2
12 8 (0.13%) COBIT
13 5 (0.078%) PMO
14 4 (0.063%) Cyber Essentials PLUS
15 3 (0.047%) Actionable Recommendations
15 3 (0.047%) GRC
15 3 (0.047%) NIST 800
15 3 (0.047%) PSD2
15 3 (0.047%) Software Quality Assurance
15 3 (0.047%) WCAG
System Software
1 1,554 (24.36%) Docker
2 422 (6.62%) Active Directory
3 345 (5.41%) VMware Infrastructure
4 209 (3.28%) Hyper-V
5 51 (0.80%) VMware ESXi
6 48 (0.75%) vSphere
7 36 (0.56%) Virtual Machines
8 33 (0.52%) VMware NSX
9 24 (0.38%) Virtual Servers
10 20 (0.31%) Firmware
11 17 (0.27%) Virtual Desktop
12 16 (0.25%) XenApp
13 11 (0.17%) Oracle RAC
14 8 (0.13%) Terminal Services
15 7 (0.11%) KVM
16 6 (0.094%) HDFS
16 6 (0.094%) Varnish
16 6 (0.094%) XenDesktop
17 5 (0.078%) NFS
18 4 (0.063%) VMware Workstation
Systems Management
1 1,479 (23.19%) Kubernetes
2 1,284 (20.13%) Terraform
3 739 (11.58%) Ansible
4 236 (3.70%) Puppet
5 145 (2.27%) Grafana
6 114 (1.79%) Microsoft Intune
7 111 (1.74%) SCCM
8 93 (1.46%) Progress Chef
9 92 (1.44%) Prometheus
10 51 (0.80%) Packer
11 50 (0.78%) Argo
12 45 (0.71%) Rancher
13 43 (0.67%) vCenter Server
14 36 (0.56%) Kibana
15 33 (0.52%) Single Sign-On
16 31 (0.49%) Nagios
17 29 (0.45%) Active Directory Federation Services
17 29 (0.45%) Istio
18 18 (0.28%) FortiGate
19 17 (0.27%) SCOM
Vendors
1 863 (13.53%) Microsoft
2 481 (7.54%) VMware
3 456 (7.15%) Google
4 277 (4.34%) Oracle
5 196 (3.07%) Cisco
6 158 (2.48%) Red Hat
7 140 (2.19%) Splunk
8 115 (1.80%) Databricks
9 109 (1.71%) Citrix
10 86 (1.35%) IBM
11 84 (1.32%) SAP
12 79 (1.24%) Palo Alto
13 73 (1.14%) Salesforce
14 68 (1.07%) Veeam
15 55 (0.86%) Atlassian
16 43 (0.67%) CheckPoint
17 42 (0.66%) HP
17 42 (0.66%) TOWER Software
18 39 (0.61%) F5
18 39 (0.61%) SolarWinds