Manufacturing Jobs in England

Manufacturing
UK > England

The table below looks at the prevalence of the term Manufacturing in permanent job vacancies in England. Included is a benchmarking guide to the salaries offered in vacancies that cited Manufacturing over the 6 months leading up to 1 May 2025, comparing them to the same period in the previous two years.

6 months to
1 May 2025
Same period 2024 Same period 2023
Rank 20 60 140
Rank change year-on-year +40 +80 -8
Permanent jobs citing Manufacturing 3,945 3,233 2,382
As % of all permanent jobs advertised in England 8.57% 3.79% 2.57%
As % of the General category 12.71% 6.40% 3.75%
Number of salaries quoted 869 2,108 1,144
10th Percentile £28,898 £27,500 £29,825
25th Percentile £36,250 £33,750 £41,250
Median annual salary (50th Percentile) £55,000 £45,000 £55,000
Median % change year-on-year +22.22% -18.18% +8.91%
75th Percentile £65,000 £60,000 £72,500
90th Percentile £82,500 £75,000 £88,525
UK median annual salary £55,000 £45,000 £55,000
% change year-on-year +22.22% -18.18% +8.17%

All General Skills
England

Manufacturing falls under the General Skills category. For comparison with the information above, the following table provides summary statistics for all permanent job vacancies requiring common skills in England.

Permanent vacancies with a requirement for common skills 31,047 50,509 63,464
As % of all permanent jobs advertised in England 67.42% 59.28% 68.59%
Number of salaries quoted 16,351 35,638 34,346
10th Percentile £29,000 £27,445 £32,500
25th Percentile £41,250 £36,250 £44,000
Median annual salary (50th Percentile) £57,500 £52,500 £60,249
Median % change year-on-year +9.52% -12.86% +0.42%
75th Percentile £77,500 £72,500 £83,426
90th Percentile £102,500 £93,750 £103,750
UK median annual salary £56,000 £52,500 £60,000
% change year-on-year +6.67% -12.50% -

Manufacturing
Job Vacancy Trend in England

Job postings citing Manufacturing as a proportion of all IT jobs advertised in England.
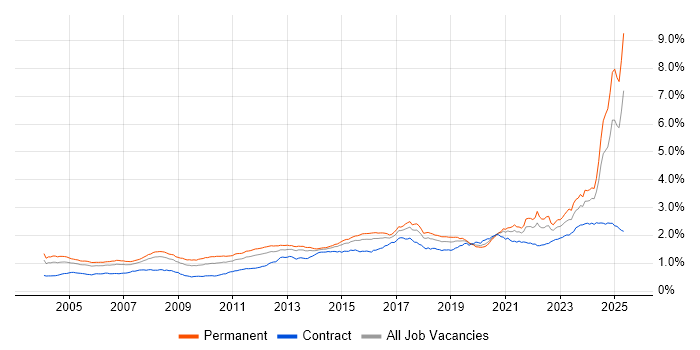
Job vacancy trend for Manufacturing in England

Manufacturing
Salary Trend in England

3-month moving average salary quoted in jobs citing Manufacturing in England.

Salary trend for Manufacturing in England

Manufacturing
Salary Histogram in England

Salary distribution for jobs citing Manufacturing in England over the 6 months to 1 May 2025.

Salary histogram for Manufacturing in England

Manufacturing
Job Locations in England

The table below looks at the demand and provides a guide to the median salaries quoted in IT jobs citing Manufacturing within the England region over the 6 months to 1 May 2025. The 'Rank Change' column provides an indication of the change in demand within each location based on the same 6 month period last year.

Location Rank Change
on Same Period
Last Year
Matching
Permanent
IT Job Ads
Median Salary
Past 6 Months
Median Salary
% Change
on Same Period
Last Year
Live
Jobs
North of England +32 1,353 £55,000 +22.22% 717
South East +37 1,062 £62,500 +47.75% 722
North West +46 929 £56,000 +17.89% 338
London +216 559 £65,000 -7.14% 473
Midlands -1 434 £47,500 +5.56% 718
Yorkshire +21 367 £45,000 +5.88% 309
West Midlands +11 339 £55,000 +22.22% 362
East of England +21 321 £44,000 -14.15% 260
South West +20 196 £40,000 -5.88% 334
East Midlands -31 95 £45,000 +5.88% 341
North East +15 57 £41,250 -2.94% 78
Manufacturing
UK

Manufacturing
Co-occurring Skills and Capabilities in England by Category

The follow tables expand on the table above by listing co-occurrences grouped by category. The same employment type, locality and period is covered with up to 20 co-occurrences shown in each of the following categories:

Application Platforms
1 67 (1.70%) Confluence
2 52 (1.32%) SharePoint
3 30 (0.76%) Microsoft Exchange
4 16 (0.41%) OpenEdge
5 11 (0.28%) IBM Domino
6 9 (0.23%) Kinematics
7 6 (0.15%) CMS
8 5 (0.13%) Apache
8 5 (0.13%) nginx
9 4 (0.10%) Apache Airflow
10 3 (0.076%) EPiServer
10 3 (0.076%) Tomcat
11 2 (0.051%) Apache Spark
11 2 (0.051%) Sitecore CMS
11 2 (0.051%) Skype for Business
11 2 (0.051%) WinCC
12 1 (0.025%) Mendix
12 1 (0.025%) MS Project Server
12 1 (0.025%) WordPress
Applications
1 232 (5.88%) Microsoft Office
2 174 (4.41%) Mathcad
3 118 (2.99%) Abaqus
4 71 (1.80%) SOLIDWORKS
5 53 (1.34%) Microsoft Excel
6 16 (0.41%) Microsoft Project
7 14 (0.35%) AutoCAD
8 12 (0.30%) Maya
9 8 (0.20%) Chatbot
9 8 (0.20%) Microsoft PowerPoint
10 4 (0.10%) Revit
10 4 (0.10%) Simulink
11 3 (0.076%) Autodesk Inventor
11 3 (0.076%) CATIA
11 3 (0.076%) EPLAN
12 2 (0.051%) Adobe Creative Suite
12 2 (0.051%) Adobe Illustrator
12 2 (0.051%) InDesign
12 2 (0.051%) MS Visio
12 2 (0.051%) Photoshop
Business Applications
1 51 (1.29%) SAP S/4HANA
2 28 (0.71%) Dynamics AX
3 21 (0.53%) Teamcenter
4 19 (0.48%) SAP ERP
5 14 (0.35%) Dynamics NAV
6 11 (0.28%) SAP IBP
7 8 (0.20%) Infor M3
8 6 (0.15%) Oracle EBS
8 6 (0.15%) TrackWise
9 4 (0.10%) IBM Planning Analytics
9 4 (0.10%) Oracle ERP
9 4 (0.10%) SAP SD
9 4 (0.10%) Sprinklr
10 3 (0.076%) Dynamics CRM
10 3 (0.076%) Magento
10 3 (0.076%) NetSuite
10 3 (0.076%) Payment Gateway
10 3 (0.076%) Sage 200
10 3 (0.076%) Sage 50
10 3 (0.076%) Salesforce CRM
Cloud Services
1 142 (3.60%) Azure
2 117 (2.97%) AWS
3 64 (1.62%) Microsoft 365
4 52 (1.32%) Power Platform
5 31 (0.79%) GCP
6 24 (0.61%) SaaS
7 19 (0.48%) Entra ID
8 16 (0.41%) Serverless
9 15 (0.38%) Azure DevOps
9 15 (0.38%) Azure Synapse Analytics
9 15 (0.38%) GitHub
10 14 (0.35%) Amazon SageMaker
10 14 (0.35%) Dynamics 365
11 13 (0.33%) Amazon ECS
11 13 (0.33%) Amazon S3
12 12 (0.30%) Amazon EC2
12 12 (0.30%) Cloud Computing
13 11 (0.28%) Microsoft Copilot
14 10 (0.25%) Azure Data Factory
15 9 (0.23%) Microsoft Purview
Communications & Networking
1 61 (1.55%) Firewall
2 23 (0.58%) WAN
3 19 (0.48%) LAN
3 19 (0.48%) Wi-Fi
4 18 (0.46%) Network Security
5 17 (0.43%) DNS
5 17 (0.43%) VPN
5 17 (0.43%) Wireless
6 16 (0.41%) Internet
6 16 (0.41%) SAN
6 16 (0.41%) VoIP
7 15 (0.38%) Modbus
8 13 (0.33%) Profibus
9 12 (0.30%) VLAN
10 11 (0.28%) HTTP
10 11 (0.28%) Intrusion Detection
10 11 (0.28%) RS-485
11 10 (0.25%) Ethernet
11 10 (0.25%) MPLS
12 9 (0.23%) DHCP
Database & Business Intelligence
1 54 (1.37%) SQL Server
2 50 (1.27%) Power BI
3 31 (0.79%) Data Warehouse
4 23 (0.58%) Relational Database
5 21 (0.53%) NoSQL
6 20 (0.51%) MySQL
7 19 (0.48%) PostgreSQL
8 15 (0.38%) Data Lake
9 11 (0.28%) Amazon RDS
10 8 (0.20%) Amazon QuickSight
10 8 (0.20%) Metadata
10 8 (0.20%) MongoDB
11 7 (0.18%) MS Access
11 7 (0.18%) Oracle Reports
11 7 (0.18%) RDBMS
11 7 (0.18%) SAP BW
12 6 (0.15%) Azure SQL Database
12 6 (0.15%) Crystal Reports
12 6 (0.15%) Looker
12 6 (0.15%) SQL Server Reporting Services
Development Applications
1 91 (2.31%) JIRA
2 32 (0.81%) Git
3 10 (0.25%) Jenkins
4 9 (0.23%) TeamCity
5 8 (0.20%) LabVIEW
5 8 (0.20%) Visual Studio
6 7 (0.18%) GitLab
6 7 (0.18%) Octopus Deploy
7 6 (0.15%) Subversion
8 4 (0.10%) Bitbucket
8 4 (0.10%) JUnit
8 4 (0.10%) Maven
8 4 (0.10%) Selenium
8 4 (0.10%) SonarQube
9 3 (0.076%) CircleCI
9 3 (0.076%) Cucumber
9 3 (0.076%) Mockito
9 3 (0.076%) Postman
9 3 (0.076%) TestNG
10 2 (0.051%) Oracle Forms
General
1 734 (18.61%) Social Skills
2 450 (11.41%) Finance
3 415 (10.52%) Electronics
4 373 (9.46%) Analytical Skills
5 370 (9.38%) Marketing
6 269 (6.82%) Inclusion and Diversity
7 244 (6.19%) Presentation Skills
8 132 (3.35%) Retail
9 113 (2.86%) Telecoms
10 107 (2.71%) Law
11 97 (2.46%) Public Sector
12 91 (2.31%) Pharmaceutical
13 66 (1.67%) Automotive
14 54 (1.37%) Legal
15 50 (1.27%) Aerospace
16 45 (1.14%) Games
17 38 (0.96%) Documentation Skills
18 34 (0.86%) Organisational Skills
19 23 (0.58%) Aviation
20 18 (0.46%) Banking
Job Titles
1 487 (12.34%) Senior
2 225 (5.70%) Lead
2 225 (5.70%) Technical Manager
3 197 (4.99%) Project Manager
4 161 (4.08%) Test Engineer
5 158 (4.01%) Architect
6 154 (3.90%) Electrical Engineer
7 152 (3.85%) Safety Engineer
8 136 (3.45%) Help Desk Manager
9 132 (3.35%) Solutions Architect
10 122 (3.09%) Senior Data Warehouse Specialist
11 118 (2.99%) Engineering Specialist
12 116 (2.94%) Technical Support
13 101 (2.56%) Products Support Manager
14 99 (2.51%) Support Technician
15 94 (2.38%) Support Manager
16 84 (2.13%) Analyst
17 81 (2.05%) Product Manager
18 76 (1.93%) Developer
19 64 (1.62%) Software Engineer
Libraries, Frameworks & Software Standards
1 55 (1.39%) .NET
2 24 (0.61%) React
3 20 (0.51%) HTML
3 20 (0.51%) REST
3 20 (0.51%) SAP Fiori
4 16 (0.41%) .NET Core
5 15 (0.38%) ASP.NET
5 15 (0.38%) CSS
5 15 (0.38%) Node.js
5 15 (0.38%) TensorFlow
6 14 (0.35%) Loki
6 14 (0.35%) Middleware
6 14 (0.35%) PyTorch
7 13 (0.33%) .NET Framework
7 13 (0.33%) Flask
7 13 (0.33%) Keras
7 13 (0.33%) RESTful
7 13 (0.33%) WPF
8 12 (0.30%) EDI
8 12 (0.30%) JSON
Miscellaneous
1 124 (3.14%) Management Information System
2 102 (2.59%) FMCG
3 65 (1.65%) IoT
4 45 (1.14%) Robotics
5 44 (1.12%) SCADA
6 41 (1.04%) Manufacturing Execution System
7 40 (1.01%) Renewable Energy
8 39 (0.99%) Life Science
9 37 (0.94%) Operational Technology
10 32 (0.81%) Algorithms
11 30 (0.76%) Legacy Systems
12 27 (0.68%) Blockchain
13 21 (0.53%) Product Ownership
13 21 (0.53%) Self-Motivation
14 19 (0.48%) Embedded Systems
15 17 (0.43%) Video Conferencing
16 16 (0.41%) Enterprise Software
16 16 (0.41%) Onboarding
17 15 (0.38%) CCTV
18 14 (0.35%) Driving Licence
Operating Systems
1 105 (2.66%) Windows
2 59 (1.50%) Linux
3 56 (1.42%) Windows Server
4 19 (0.48%) Windows 10
5 12 (0.30%) Windows Server 2019
6 7 (0.18%) FreeRTOS
7 6 (0.15%) Debian
8 5 (0.13%) Robot Operating System
9 4 (0.10%) Android
10 3 (0.076%) Apple iOS
10 3 (0.076%) CentOS
10 3 (0.076%) Unix
11 2 (0.051%) AIX
11 2 (0.051%) Oracle Linux
12 1 (0.025%) Mac OS
12 1 (0.025%) Ubuntu
12 1 (0.025%) Windows Server 2012
12 1 (0.025%) Windows Server 2016
Processes & Methodologies
1 1,666 (42.23%) Service Delivery
2 525 (13.31%) Continuous Improvement
3 414 (10.49%) Problem-Solving
4 395 (10.01%) ERP
5 359 (9.10%) Coaching
6 345 (8.75%) CAD
7 323 (8.19%) Mathematics
8 313 (7.93%) Project Management
9 251 (6.36%) Physics
10 200 (5.07%) Mentoring
11 184 (4.66%) Agile
12 176 (4.46%) Business Case
13 162 (4.11%) Project Delivery
14 160 (4.06%) PLM
15 155 (3.93%) Stakeholder Management
16 154 (3.90%) Safety Engineering
17 149 (3.78%) Customer Service
18 145 (3.68%) Business Intelligence
19 138 (3.50%) Lean Manufacturing
20 137 (3.47%) Logistics
Programming Languages
1 148 (3.75%) SQL
2 121 (3.07%) Python
3 72 (1.83%) C#
4 63 (1.60%) MATLAB
5 57 (1.44%) C++
6 50 (1.27%) C
7 39 (0.99%) JavaScript
8 28 (0.71%) Java
9 27 (0.68%) TypeScript
10 24 (0.61%) R
11 21 (0.53%) Progress 4GL
12 20 (0.51%) ABAP
13 14 (0.35%) PHP
14 13 (0.33%) PowerShell
15 12 (0.30%) Shell Script
15 12 (0.30%) VB
16 11 (0.28%) Korn
17 10 (0.25%) VB.NET
18 9 (0.23%) C-shell
18 9 (0.23%) PL/SQL
Qualifications
1 1,542 (39.09%) NVQ Level 3
2 1,027 (26.03%) Degree
3 552 (13.99%) BPSS Clearance
4 203 (5.15%) HND
5 179 (4.54%) NVQ Level 4
6 169 (4.28%) Master's Degree
7 133 (3.37%) Chartered Engineer
8 83 (2.10%) HNC
9 47 (1.19%) Computer Science Degree
10 40 (1.01%) Security Cleared
11 36 (0.91%) Numerate Degree
12 27 (0.68%) PMP
13 26 (0.66%) PhD
13 26 (0.66%) PMI Certification
14 24 (0.61%) DV Cleared
14 24 (0.61%) SC Cleared
15 22 (0.56%) CISA
15 22 (0.56%) ISACA
16 20 (0.51%) CISSP
17 11 (0.28%) Cisco Certification
Quality Assurance & Compliance
1 204 (5.17%) QA
2 90 (2.28%) ISO 9001
3 86 (2.18%) GMP
4 80 (2.03%) AQAP
5 32 (0.81%) SLA
6 30 (0.76%) NEBOSH
7 26 (0.66%) Cyber Essentials
8 23 (0.58%) GDPR
9 22 (0.56%) ITGC
10 19 (0.48%) Accessibility
11 18 (0.46%) ISO/IEC 27001
12 15 (0.38%) Data Quality
13 12 (0.30%) GxP
14 11 (0.28%) Cyber Essentials PLUS
15 9 (0.23%) NIST
16 8 (0.20%) GLP
16 8 (0.20%) PMO
17 5 (0.13%) Good Clinical Practice
18 4 (0.10%) GRC
19 3 (0.076%) ECSS
System Software
1 55 (1.39%) Active Directory
2 36 (0.91%) Docker
3 31 (0.79%) VMware Infrastructure
4 17 (0.43%) Firmware
5 15 (0.38%) Hyper-V
6 14 (0.35%) VMware ESXi
7 11 (0.28%) Embedded Firmware
8 5 (0.13%) Terminal Services
9 4 (0.10%) Virtual Machines
10 3 (0.076%) Terminal Server
10 3 (0.076%) Virtual Servers
11 2 (0.051%) KVM
11 2 (0.051%) Postfix
11 2 (0.051%) Sendmail
Systems Management
1 46 (1.17%) Kubernetes
2 35 (0.89%) Terraform
3 14 (0.35%) Grafana
4 12 (0.30%) Prometheus
5 10 (0.25%) Microsoft Intune
6 9 (0.23%) Kustomize
7 6 (0.15%) BMC PATROL
7 6 (0.15%) FortiGate
8 5 (0.13%) Ansible
9 4 (0.10%) SCCM
10 3 (0.076%) Packer
11 2 (0.051%) Functional Safety
11 2 (0.051%) Nagios
11 2 (0.051%) Nessus
11 2 (0.051%) Wonderware InTouch
12 1 (0.025%) Computer Emergency Response Teams
12 1 (0.025%) HP ALM
12 1 (0.025%) Kubeflow
12 1 (0.025%) Marathon
12 1 (0.025%) QRadar
Vendors
1 373 (9.46%) Microsoft
2 301 (7.63%) SAP
3 122 (3.09%) Siemens
4 52 (1.32%) Oracle
5 41 (1.04%) VMware
6 38 (0.96%) Rockwell
7 37 (0.94%) Google
8 24 (0.61%) Cisco
9 21 (0.53%) Progress
10 17 (0.43%) Fortinet
11 16 (0.41%) Salesforce
12 15 (0.38%) Veeam
13 14 (0.35%) Infor
14 12 (0.30%) EMC
14 12 (0.30%) NEC
15 11 (0.28%) IBM
16 10 (0.25%) Ariba
17 9 (0.23%) Citrix
17 9 (0.23%) Epicor
17 9 (0.23%) Informatica