Telecoms Jobs in the South East

Telecommunications
England > South East

The table below looks at the prevalence of the term Telecoms in permanent job vacancies in the South East. Included is a benchmarking guide to the salaries offered in vacancies that cited Telecoms over the 6 months leading up to 26 July 2024, comparing them to the same period in the previous two years.

6 months to
26 Jul 2024
Same period 2023 Same period 2022
Rank 71 27 98
Rank change year-on-year -44 +71 -12
Permanent jobs citing Telecoms 496 872 763
As % of all permanent jobs advertised in the South East 3.29% 7.53% 3.46%
As % of the General category 6.11% 12.38% 5.39%
Number of salaries quoted 267 261 348
10th Percentile £26,000 £23,500 £29,438
25th Percentile £28,750 £32,500 £42,500
Median annual salary (50th Percentile) £40,000 £42,500 £57,500
Median % change year-on-year -5.88% -26.09% +9.52%
75th Percentile £58,125 £62,500 £72,500
90th Percentile £74,750 £76,250 £81,250
England median annual salary £46,500 £57,500 £55,000
% change year-on-year -19.13% +4.55% -

All General Skills
South East

Telecoms falls under the General Skills category. For comparison with the information above, the following table provides summary statistics for all permanent job vacancies requiring common skills in the South East.

Permanent vacancies with a requirement for common skills 8,122 7,045 14,153
As % of all permanent jobs advertised in the South East 53.81% 60.80% 64.14%
Number of salaries quoted 4,765 4,014 6,830
10th Percentile £26,250 £29,000 £30,000
25th Percentile £35,000 £37,500 £40,000
Median annual salary (50th Percentile) £49,881 £52,500 £55,000
Median % change year-on-year -4.99% -4.55% +10.00%
75th Percentile £63,750 £68,750 £68,750
90th Percentile £77,500 £83,750 £81,250
England median annual salary £55,000 £60,000 £60,000
% change year-on-year -8.33% - +4.35%

Telecoms
Job Vacancy Trend in the South East

Job postings citing Telecoms as a proportion of all IT jobs advertised in the South East.
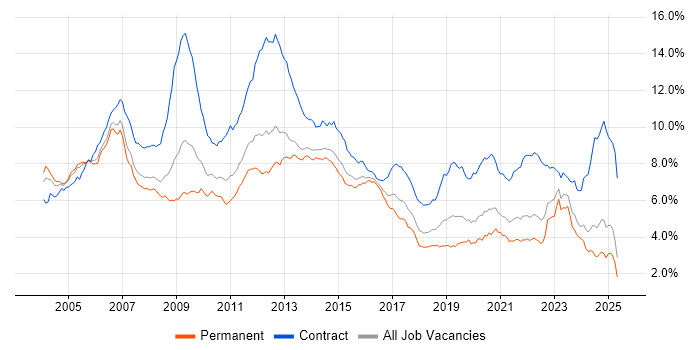
Job vacancy trend for Telecoms in the South East

Telecoms
Salary Trend in the South East

3-month moving average salary quoted in jobs citing Telecoms in the South East.

Salary trend for Telecoms in the South East

Telecoms
Salary Histogram in the South East

Salary distribution for jobs citing Telecoms in the South East over the 6 months to 26 July 2024.

Salary histogram for Telecoms in the South East

Telecoms
Job Locations in the South East

The table below looks at the demand and provides a guide to the median salaries quoted in IT jobs citing Telecoms within the South East region over the 6 months to 26 July 2024. The 'Rank Change' column provides an indication of the change in demand within each location based on the same 6 month period last year.

Location Rank Change
on Same Period
Last Year
Matching
Permanent
IT Job Ads
Median Salary
Past 6 Months
Median Salary
% Change
on Same Period
Last Year
Live
Jobs
Thames Valley -24 219 £50,000 -2.63% 39
Berkshire -12 175 £60,000 +16.85% 27
Hampshire -44 119 £33,250 +10.83% 25
Surrey -26 75 £36,250 -17.61% 8
Kent -16 46 £52,500 +38.16% 3
Buckinghamshire -51 25 £33,500 -10.67% 11
West Sussex -24 22 £33,750 -43.75% 5
Oxfordshire -24 19 £55,000 +10.00% 1
East Sussex -29 16 £32,500 -25.71% 2
Home Counties - 1 £90,000 -
Telecoms
England

Telecoms
Co-occurring Skills and Capabilities in the South East by Category

The follow tables expand on the table above by listing co-occurrences grouped by category. The same employment type, locality and period is covered with up to 20 co-occurrences shown in each of the following categories:

Application Platforms
1 9 (1.81%) SharePoint
2 6 (1.21%) Apache
2 6 (1.21%) nginx
3 3 (0.60%) Microsoft Exchange
4 2 (0.40%) Apache Spark
5 1 (0.20%) CMS
5 1 (0.20%) Confluence
5 1 (0.20%) Oracle Spatial
Applications
1 52 (10.48%) Microsoft Office
2 31 (6.25%) Microsoft Excel
3 11 (2.22%) Microsoft PowerPoint
4 7 (1.41%) OrCAD
5 2 (0.40%) MS Visio
6 1 (0.20%) Adobe Illustrator
6 1 (0.20%) Doxygen
6 1 (0.20%) Microsoft Project
6 1 (0.20%) Photoshop
6 1 (0.20%) Spreadsheet
Business Applications
1 5 (1.01%) Dynamics CRM
2 1 (0.20%) NetSuite
Cloud Services
1 55 (11.09%) Azure
2 29 (5.85%) Microsoft 365
3 25 (5.04%) AWS
4 16 (3.23%) GitHub
5 12 (2.42%) Power Platform
6 11 (2.22%) GCP
7 9 (1.81%) SaaS
8 7 (1.41%) PaaS
9 6 (1.21%) GitHub Actions
10 5 (1.01%) IaaS
11 4 (0.81%) Azure Synapse Analytics
11 4 (0.81%) Entra ID
11 4 (0.81%) Power Automate
11 4 (0.81%) PowerApps
12 3 (0.60%) Cloud Computing
13 2 (0.40%) Amazon EMR
13 2 (0.40%) Amazon S3
13 2 (0.40%) Azure DevOps
14 1 (0.20%) AWS CloudFormation
14 1 (0.20%) OneDrive
Communications & Networking
1 62 (12.50%) Firewall
2 46 (9.27%) 5G
3 41 (8.27%) VPN
4 30 (6.05%) 4G
5 26 (5.24%) Wireless
6 25 (5.04%) MPLS
6 25 (5.04%) TCP/IP
6 25 (5.04%) Wi-Fi
7 22 (4.44%) WAN
8 20 (4.03%) VoIP
9 17 (3.43%) Network Security
10 16 (3.23%) DNS
11 15 (3.02%) LAN
12 11 (2.22%) LTE
13 10 (2.02%) Bluetooth
13 10 (2.02%) DHCP
14 9 (1.81%) Modbus
15 8 (1.61%) 3G
15 8 (1.61%) Structured Cabling
15 8 (1.61%) VLAN
Database & Business Intelligence
1 15 (3.02%) SQL Server
2 13 (2.62%) PostgreSQL
3 12 (2.42%) Power BI
4 9 (1.81%) GIS
5 6 (1.21%) Redis
6 5 (1.01%) Data Lake
6 5 (1.01%) MongoDB
6 5 (1.01%) NoSQL
7 4 (0.81%) Data Warehouse
7 4 (0.81%) Power Query
7 4 (0.81%) SQL Server Integration Services
8 3 (0.60%) Tableau
9 2 (0.40%) Amazon Athena
9 2 (0.40%) Amazon RDS
9 2 (0.40%) Apache Hive
9 2 (0.40%) Big Data
9 2 (0.40%) Hadoop
9 2 (0.40%) Impala
9 2 (0.40%) MySQL
9 2 (0.40%) Sqoop
Development Applications
1 27 (5.44%) JIRA
2 20 (4.03%) Git
3 16 (3.23%) Jenkins
4 9 (1.81%) Trac
5 8 (1.61%) LabVIEW
6 5 (1.01%) Maven
7 4 (0.81%) Eclipse
7 4 (0.81%) Subversion
7 4 (0.81%) Visual Studio
8 2 (0.40%) Apache Continuum
8 2 (0.40%) Hudson
8 2 (0.40%) Rational DOORS
9 1 (0.20%) Bitbucket
9 1 (0.20%) Cypress.io
9 1 (0.20%) GitLab
9 1 (0.20%) Selenium
9 1 (0.20%) WebDriver
General
1 140 (28.23%) Social Skills
2 90 (18.15%) Finance
3 56 (11.29%) Electronics
4 52 (10.48%) Marketing
5 50 (10.08%) Manufacturing
6 43 (8.67%) Public Sector
7 39 (7.86%) Analytical Skills
8 27 (5.44%) Legal
9 20 (4.03%) Inclusion and Diversity
10 19 (3.83%) Law
11 14 (2.82%) Aerospace
11 14 (2.82%) Organisational Skills
11 14 (2.82%) Retail
12 13 (2.62%) Automotive
13 12 (2.42%) Pharmaceutical
13 12 (2.42%) Presentation Skills
14 9 (1.81%) Billing
15 8 (1.61%) Back Office
15 8 (1.61%) Local Government
15 8 (1.61%) Military
Job Titles
1 48 (9.68%) Developer
2 36 (7.26%) Analyst
3 31 (6.25%) Senior
3 31 (6.25%) Support Engineer
4 24 (4.84%) Lead
5 23 (4.64%) Telecoms Manager
6 22 (4.44%) IT Support
6 22 (4.44%) Network Engineer
7 20 (4.03%) IT Engineer
8 18 (3.63%) Infrastructure Engineer
9 17 (3.43%) IT Analyst
9 17 (3.43%) Systems Engineer
10 15 (3.02%) Electronics Engineer
10 15 (3.02%) IT Support Engineer
10 15 (3.02%) Service Analyst
10 15 (3.02%) Service Desk Analyst
10 15 (3.02%) Support Analyst
11 14 (2.82%) Data Engineer
11 14 (2.82%) Telecoms Engineer
12 13 (2.62%) 2nd Line Support
Libraries, Frameworks & Software Standards
1 12 (2.42%) HTML
2 11 (2.22%) CSS
3 9 (1.81%) .NET
3 9 (1.81%) AngularJS
4 7 (1.41%) React
5 6 (1.21%) Celery
5 6 (1.21%) Dask
5 6 (1.21%) Django
5 6 (1.21%) Flask
5 6 (1.21%) GeoJSON
5 6 (1.21%) GeoPandas
5 6 (1.21%) LAPP Stack
5 6 (1.21%) NumPy
6 5 (1.01%) Flash
6 5 (1.01%) Google Maps API
6 5 (1.01%) HTML5 Canvas
6 5 (1.01%) Java EE
6 5 (1.01%) NETCONF
6 5 (1.01%) Vaadin
7 4 (0.81%) .NET Framework
Miscellaneous
1 39 (7.86%) Driving Licence
2 31 (6.25%) Self-Motivation
3 25 (5.04%) IoT
3 25 (5.04%) Management Information System
4 15 (3.02%) Augmented Reality
5 14 (2.82%) CCTV
6 13 (2.62%) Fibre Optics
7 11 (2.22%) Handset
8 10 (2.02%) ARM Cortex
9 9 (1.81%) Analogue Electronics
9 9 (1.81%) Data Centre
9 9 (1.81%) NB-IoT
9 9 (1.81%) Onboarding
10 8 (1.61%) Acoustics
10 8 (1.61%) Satnav
11 7 (1.41%) Algorithms
11 7 (1.41%) Enterprise Software
11 7 (1.41%) FPGA
12 6 (1.21%) Cyber Threat
13 5 (1.01%) Embedded Systems
Operating Systems
1 64 (12.90%) Windows
2 41 (8.27%) Linux
3 18 (3.63%) Windows Server
4 13 (2.62%) Windows 10
5 3 (0.60%) Unix
6 2 (0.40%) Android
6 2 (0.40%) Embedded Linux
6 2 (0.40%) VMS
6 2 (0.40%) Windows 7
6 2 (0.40%) Windows Server 2012
6 2 (0.40%) Windows Server 2016
7 1 (0.20%) Apple iOS
7 1 (0.20%) Kali Linux
7 1 (0.20%) Windows 8
7 1 (0.20%) Windows Server 2019
Processes & Methodologies
1 83 (16.73%) Problem-Solving
2 54 (10.89%) Customer Service
3 52 (10.48%) Business Intelligence
4 45 (9.07%) Programme Management
5 44 (8.87%) Digital Marketing
6 42 (8.47%) Cybersecurity
7 39 (7.86%) Data Management
7 39 (7.86%) Validation
8 36 (7.26%) ITIL
9 32 (6.45%) B2B
9 32 (6.45%) Continuous Improvement
10 30 (6.05%) Project Management
11 29 (5.85%) Stakeholder Management
12 26 (5.24%) Agile
13 25 (5.04%) Risk Management
13 25 (5.04%) Software Engineering
14 24 (4.84%) Customer Experience
15 23 (4.64%) Information Security
15 23 (4.64%) Service Delivery
15 23 (4.64%) Supplier Management
Programming Languages
1 42 (8.47%) Python
2 32 (6.45%) SQL
3 17 (3.43%) JavaScript
3 17 (3.43%) PowerShell
4 16 (3.23%) C#
5 14 (2.82%) C++
5 14 (2.82%) Java
6 12 (2.42%) C
7 7 (1.41%) T-SQL
8 6 (1.21%) Assembly Language
9 5 (1.01%) Kotlin
9 5 (1.01%) TypeScript
10 4 (0.81%) Embedded C
11 2 (0.40%) Bicep
11 2 (0.40%) MATLAB
11 2 (0.40%) PHP
11 2 (0.40%) Scala
12 1 (0.20%) Go
12 1 (0.20%) R
12 1 (0.20%) Shell Script
Qualifications
1 92 (18.55%) Degree
2 37 (7.46%) Security Cleared
3 19 (3.83%) SC Cleared
4 17 (3.43%) Master's Degree
5 11 (2.22%) NVQ Level 3
6 9 (1.81%) BPSS Clearance
6 9 (1.81%) CISSP
7 8 (1.61%) CISM
7 8 (1.61%) GIAC
7 8 (1.61%) GPEN
8 7 (1.41%) CTC Cleared
9 6 (1.21%) MRICS
10 5 (1.01%) DBS Check
10 5 (1.01%) ITIL Certification
11 4 (0.81%) CCNA
11 4 (0.81%) Cisco Certification
11 4 (0.81%) HNC
11 4 (0.81%) HND
11 4 (0.81%) Microsoft Certification
12 3 (0.60%) A+ Certification
Quality Assurance & Compliance
1 30 (6.05%) SLA
2 23 (4.64%) QA
3 22 (4.44%) GDPR
4 15 (3.02%) Cyber Essentials
5 13 (2.62%) ISO 9001
6 12 (2.42%) Data Quality
7 11 (2.22%) ISO/IEC 17025
8 9 (1.81%) NIST
9 8 (1.61%) GRC
10 7 (1.41%) COSHH
11 6 (1.21%) Accessibility
11 6 (1.21%) ISO/IEC 27001
11 6 (1.21%) NIST 800
12 5 (1.01%) HIPAA
13 4 (0.81%) IEC 61131
13 4 (0.81%) ISO/IEC 27002 (supersedes ISO/IEC 17799)
13 4 (0.81%) JTAG
14 3 (0.60%) ISO/IEC 27005
14 3 (0.60%) NEBOSH
14 3 (0.60%) PMO
System Software
1 34 (6.85%) Hyper-V
2 30 (6.05%) Active Directory
3 20 (4.03%) Docker
4 15 (3.02%) Firmware
4 15 (3.02%) pfSense
4 15 (3.02%) Virtual Machines
5 9 (1.81%) NFS
6 6 (1.21%) Embedded Firmware
7 2 (0.40%) HDFS
7 2 (0.40%) VMware Infrastructure
Systems Management
1 15 (3.02%) Grafana
1 15 (3.02%) ZABBIX
2 14 (2.82%) FortiGate
3 9 (1.81%) Ansible
3 9 (1.81%) Microsoft Data Protection Manager
3 9 (1.81%) SCDPM
3 9 (1.81%) Terraform
4 6 (1.21%) Computer Emergency Response Teams
4 6 (1.21%) Nessus
5 2 (0.40%) Autotask
5 2 (0.40%) Kubernetes
6 1 (0.20%) Dell DRAC
6 1 (0.20%) Netcool
6 1 (0.20%) PaperCut
6 1 (0.20%) SCCM
6 1 (0.20%) Suricata
6 1 (0.20%) WSUS
Vendors
1 104 (20.97%) Microsoft
2 42 (8.47%) SAP
3 35 (7.06%) Cisco
4 20 (4.03%) Juniper
5 19 (3.83%) HP
6 18 (3.63%) Openreach
7 17 (3.43%) VMware
8 16 (3.23%) NEC
8 16 (3.23%) Virgin Media
9 15 (3.02%) Fortinet
10 14 (2.82%) Darktrace
11 11 (2.22%) EMC
11 11 (2.22%) Veeam
12 10 (2.02%) BT
13 9 (1.81%) McAfee
14 7 (1.41%) Remedy
15 6 (1.21%) Informatica
15 6 (1.21%) Mitel
15 6 (1.21%) Qualys
15 6 (1.21%) Ribbon