Linux Jobs in the West Midlands

Linux
England > West Midlands

The table below provides summary statistics for permanent job vacancies advertised in the West Midlands requiring Linux skills. It includes a benchmarking guide to the annual salaries offered in vacancies that cited Linux over the 6 months leading up to 14 June 2025, comparing them to the same period in the previous two years.

6 months to
14 Jun 2025
Same period 2024 Same period 2023
Rank 78 68 72
Rank change year-on-year -10 +4 -28
Permanent jobs citing Linux 141 286 247
As % of all permanent jobs advertised in the West Midlands 3.45% 3.33% 4.28%
As % of the Operating Systems category 23.86% 29.36% 34.16%
Number of salaries quoted 89 162 171
10th Percentile £27,500 £30,525 £39,000
25th Percentile £32,500 £36,688 £43,750
Median annual salary (50th Percentile) £60,000 £54,000 £55,000
Median % change year-on-year +11.11% -1.82% +4.76%
75th Percentile £73,750 £67,500 £70,000
90th Percentile £74,000 £76,125 £80,000
England median annual salary £60,000 £55,000 £63,000
% change year-on-year +9.09% -12.70% +5.00%

All Operating Systems
West Midlands

Linux falls under the Operating Systems category. For comparison with the information above, the following table provides summary statistics for all permanent job vacancies requiring operating system skills in the West Midlands.

Permanent vacancies with a requirement for operating system skills 591 974 723
As % of all permanent jobs advertised in the West Midlands 14.47% 11.33% 12.53%
Number of salaries quoted 421 722 546
10th Percentile £26,375 £25,024 £25,500
25th Percentile £31,250 £27,750 £31,250
Median annual salary (50th Percentile) £36,925 £37,500 £45,000
Median % change year-on-year -1.53% -16.67% -
75th Percentile £52,500 £55,000 £57,500
90th Percentile £72,500 £67,500 £70,000
England median annual salary £42,500 £45,000 £52,500
% change year-on-year -5.56% -14.29% -

Linux
Job Vacancy Trend in the West Midlands

Job postings citing Linux as a proportion of all IT jobs advertised in the West Midlands.
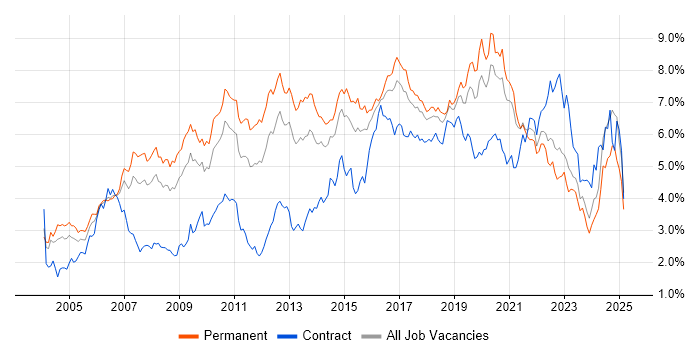
Job vacancy trend for Linux in the West Midlands

Linux
Salary Trend in the West Midlands

3-month moving average salary quoted in jobs citing Linux in the West Midlands.

Salary trend for Linux in the West Midlands

Linux
Salary Histogram in the West Midlands

Salary distribution for jobs citing Linux in the West Midlands over the 6 months to 14 June 2025.

Salary histogram for Linux in the West Midlands

Linux
Job Locations in the West Midlands

The table below looks at the demand and provides a guide to the median salaries quoted in IT jobs citing Linux within the West Midlands region over the 6 months to 14 June 2025. The 'Rank Change' column provides an indication of the change in demand within each location based on the same 6 month period last year.

Location Rank Change
on Same Period
Last Year
Matching
Permanent
IT Job Ads
Median Salary
Past 6 Months
Median Salary
% Change
on Same Period
Last Year
Live
Jobs
Birmingham +33 69 £60,000 -4.00% 49
Staffordshire +2 22 £35,000 -3.45% 9
Warwickshire -4 19 - - 9
Solihull +16 10 £75,000 +50.00% 3
Worcestershire -8 6 £65,000 +30.00% 9
Coventry -12 5 £46,250 -28.85% 7
Shropshire +17 3 £80,000 - 4
Herefordshire +9 3 £52,500 -12.50% 9
Wolverhampton +17 1 £47,500 -
Linux
England

Linux
Co-occurring Skills and Capabilities in the West Midlands by Category

The follow tables expand on the table above by listing co-occurrences grouped by category. The same employment type, locality and period is covered with up to 20 co-occurrences shown in each of the following categories:

Application Platforms
1 48 (34.04%) Confluence
2 6 (4.26%) Microsoft Exchange
3 3 (2.13%) nginx
4 2 (1.42%) IIS
4 2 (1.42%) Oracle SOA Suite
5 1 (0.71%) ColdFusion
5 1 (0.71%) OpenStack
Applications
1 16 (11.35%) Microsoft Office
2 10 (7.09%) Microsoft Excel
3 7 (4.96%) Mozilla Thunderbird
4 1 (0.71%) Simulink
4 1 (0.71%) Trello
Business Applications
1 6 (4.26%) Oracle EBS
2 4 (2.84%) Oracle Applications
Cloud Services
1 56 (39.72%) AWS
2 34 (24.11%) Amazon S3
2 34 (24.11%) AWS KMS
3 33 (23.40%) Amazon CloudWatch
3 33 (23.40%) Amazon EC2
4 28 (19.86%) Azure
4 28 (19.86%) Virtual Private Cloud
5 27 (19.15%) Amazon ELB
6 24 (17.02%) Amazon Glacier
7 13 (9.22%) Microsoft 365
8 10 (7.09%) Google Workspace
9 9 (6.38%) Route 53
10 8 (5.67%) Amazon ECS
11 7 (4.96%) Amazon SQS
11 7 (4.96%) SaaS
12 5 (3.55%) AWS Lambda
12 5 (3.55%) Serverless
13 4 (2.84%) Amazon GuardDuty
13 4 (2.84%) Entra ID
13 4 (2.84%) GCP
Communications & Networking
1 47 (33.33%) Firewall
2 29 (20.57%) DNS
3 18 (12.77%) TCP/IP
4 16 (11.35%) DHCP
5 13 (9.22%) VLAN
6 11 (7.80%) HTTP
7 10 (7.09%) BGP
7 10 (7.09%) FTP
7 10 (7.09%) OSPF
7 10 (7.09%) SMTP
7 10 (7.09%) SSH
7 10 (7.09%) WLAN
8 7 (4.96%) WAN
9 6 (4.26%) VPN
10 5 (3.55%) Network Security
10 5 (3.55%) SSL
11 4 (2.84%) LAN
11 4 (2.84%) OpenLDAP
11 4 (2.84%) SAN
11 4 (2.84%) Wi-Fi
Database & Business Intelligence
1 34 (24.11%) Amazon RDS
2 25 (17.73%) MySQL
3 21 (14.89%) Relational Database
4 10 (7.09%) PostgreSQL
5 9 (6.38%) Amazon Aurora
6 8 (5.67%) NoSQL
7 7 (4.96%) Oracle Database
8 6 (4.26%) DynamoDB
8 6 (4.26%) Oracle Exadata
9 4 (2.84%) SQL Server
10 3 (2.13%) Elasticsearch
11 2 (1.42%) MongoDB
11 2 (1.42%) RDBMS
12 1 (0.71%) DB2
12 1 (0.71%) Oracle Reports
12 1 (0.71%) Redis
Development Applications
1 54 (38.30%) Git
2 48 (34.04%) JIRA
3 35 (24.82%) Jenkins
4 27 (19.15%) Vagrant
5 18 (12.77%) Bitbucket
6 14 (9.93%) JUnit
6 14 (9.93%) Mockito
7 10 (7.09%) Bitbucket Server
8 7 (4.96%) Maven
8 7 (4.96%) Sonatype Nexus
9 6 (4.26%) DbUnit
9 6 (4.26%) Eclipse
9 6 (4.26%) IntelliJ
9 6 (4.26%) Jasmine
9 6 (4.26%) jMock
9 6 (4.26%) Karma Test Runner
9 6 (4.26%) Protractor
9 6 (4.26%) SonarQube
10 4 (2.84%) GitLab
11 2 (1.42%) Robot Framework
General
1 39 (27.66%) Social Skills
2 28 (19.86%) Public Sector
3 16 (11.35%) Automotive
4 13 (9.22%) Analytical Skills
5 11 (7.80%) Inclusion and Diversity
5 11 (7.80%) Retail
6 10 (7.09%) Law
7 6 (4.26%) Presentation Skills
8 5 (3.55%) Police
9 3 (2.13%) Electronics
9 3 (2.13%) Telecoms
10 2 (1.42%) Legal
11 1 (0.71%) Advertising
11 1 (0.71%) Back Office
11 1 (0.71%) Finance
11 1 (0.71%) Games
11 1 (0.71%) Manufacturing
11 1 (0.71%) Marketing
Job Titles
1 29 (20.57%) Developer
2 27 (19.15%) IT Engineer
3 22 (15.60%) Systems Engineer
4 21 (14.89%) Infrastructure Engineer
5 19 (13.48%) Java Developer
6 16 (11.35%) Infrastructure Support
6 16 (11.35%) Support Engineer
7 15 (10.64%) Senior
8 14 (9.93%) DevOps Engineer
9 12 (8.51%) AWS Engineer
9 12 (8.51%) Infrastructure Support Engineer
10 9 (6.38%) Software Engineer
11 8 (5.67%) AWS Infrastructure Engineer
11 8 (5.67%) Lead
11 8 (5.67%) Platform Engineer
11 8 (5.67%) Senior Software Engineer
12 6 (4.26%) DBA
12 6 (4.26%) IT Support
12 6 (4.26%) Oracle DBA
12 6 (4.26%) SaaS Developer
Libraries, Frameworks & Software Standards
1 24 (17.02%) .NET
2 17 (12.06%) JPA
3 16 (11.35%) AngularJS
4 12 (8.51%) Hibernate
4 12 (8.51%) Middleware
5 10 (7.09%) React
6 8 (5.67%) Spring
7 7 (4.96%) Bootstrap
7 7 (4.96%) RabbitMQ
7 7 (4.96%) RESTful
7 7 (4.96%) SOAP
7 7 (4.96%) Web Services
8 6 (4.26%) ActiveMQ
8 6 (4.26%) Oracle Fusion
8 6 (4.26%) Oracle GoldenGate
8 6 (4.26%) PowerMock
8 6 (4.26%) Spring Batch
8 6 (4.26%) Spring Boot
8 6 (4.26%) Spring Integration
9 5 (3.55%) GWT
Miscellaneous
1 18 (12.77%) Replication
2 15 (10.64%) Management Information System
3 10 (7.09%) Driving Licence
3 10 (7.09%) Smartphone
4 9 (6.38%) Mobile App
5 6 (4.26%) Algorithms
6 4 (2.84%) Distributed Architecture
6 4 (2.84%) Linux Command Line
7 3 (2.13%) Data Centre
7 3 (2.13%) Distributed Systems
7 3 (2.13%) Hybrid Cloud
8 2 (1.42%) Analytical Mindset
8 2 (1.42%) Augmented Reality
8 2 (1.42%) Clustering
8 2 (1.42%) Data Protection Act
8 2 (1.42%) Onboarding
8 2 (1.42%) Security Posture
9 1 (0.71%) Low-Code
9 1 (0.71%) NB-IoT
9 1 (0.71%) Virtual Reality
Operating Systems
1 89 (63.12%) Windows
2 27 (19.15%) VMS
3 24 (17.02%) Windows Server
4 19 (13.48%) Ubuntu
5 15 (10.64%) Windows 10
6 12 (8.51%) Windows Server 2019
7 11 (7.80%) Amazon Linux
7 11 (7.80%) Mac OS X
8 10 (7.09%) Unix
8 10 (7.09%) Windows Server 2016
9 7 (4.96%) Rocky
10 5 (3.55%) Android
10 5 (3.55%) Red Hat Enterprise Linux
10 5 (3.55%) Windows 7
11 3 (2.13%) Apple iOS
12 2 (1.42%) CentOS
12 2 (1.42%) Debian
12 2 (1.42%) Embedded Linux
Processes & Methodologies
1 48 (34.04%) Agile
2 44 (31.21%) DevOps
3 31 (21.99%) Configuration Management
4 29 (20.57%) Continuous Integration
5 28 (19.86%) Cloud Security
6 27 (19.15%) CI/CD
6 27 (19.15%) Problem-Solving
7 25 (17.73%) Change Management
8 22 (15.60%) Performance Tuning
9 21 (14.89%) Coaching
9 21 (14.89%) Infrastructure Engineering
9 21 (14.89%) Patch Management
9 21 (14.89%) Systems Engineering
10 20 (14.18%) Containerisation
11 18 (12.77%) Continuous Deployment
11 18 (12.77%) DevSecOps
12 13 (9.22%) Platform Engineering
13 12 (8.51%) Computer Science
13 12 (8.51%) Microservices
13 12 (8.51%) Software Engineering
Programming Languages
1 44 (31.21%) Python
2 43 (30.50%) PowerShell
3 38 (26.95%) SQL
4 35 (24.82%) Java
5 26 (18.44%) Groovy
6 23 (16.31%) C#
7 13 (9.22%) Perl
8 12 (8.51%) JavaScript
8 12 (8.51%) Shell Script
9 11 (7.80%) Bash
10 9 (6.38%) PL/SQL
11 6 (4.26%) TypeScript
12 5 (3.55%) C++
13 4 (2.84%) Rust
14 3 (2.13%) C
14 3 (2.13%) Go
14 3 (2.13%) PHP
14 3 (2.13%) Ruby
15 1 (0.71%) MATLAB
15 1 (0.71%) VB
Qualifications
1 49 (34.75%) Security Cleared
2 37 (26.24%) SC Cleared
3 32 (22.70%) Degree
4 20 (14.18%) BPSS Clearance
5 12 (8.51%) Computer Science Degree
5 12 (8.51%) DV Cleared
6 11 (7.80%) Microsoft Certification
7 10 (7.09%) HNC
7 10 (7.09%) HND
7 10 (7.09%) MCSE
8 9 (6.38%) AWS Certification
9 8 (5.67%) Azure Certification
10 6 (4.26%) Network+ Certification
11 5 (3.55%) OCA
11 5 (3.55%) OCP
11 5 (3.55%) Oracle Certification
12 3 (2.13%) CCNA
12 3 (2.13%) Cisco Certification
12 3 (2.13%) CompTIA Security+
13 2 (1.42%) CASP
Quality Assurance & Compliance
1 6 (4.26%) Accessibility
2 5 (3.55%) ISO/IEC 27001
2 5 (3.55%) QA
3 3 (2.13%) Cyber Essentials
4 2 (1.42%) ISO 9000
5 1 (0.71%) GDPR
5 1 (0.71%) NCSC
5 1 (0.71%) NIST
5 1 (0.71%) SLA
System Software
1 48 (34.04%) Active Directory
2 39 (27.66%) Docker
3 18 (12.77%) DFS Replication
4 10 (7.09%) VMware Infrastructure
5 6 (4.26%) Hyper-V
6 5 (3.55%) Postfix
7 4 (2.84%) Virtual Desktop
7 4 (2.84%) Virtual Machines
8 3 (2.13%) Dovecot
8 3 (2.13%) LXC
8 3 (2.13%) Squid
9 1 (0.71%) vSphere
9 1 (0.71%) Xen
Systems Management
1 43 (30.50%) Ansible
2 41 (29.08%) Terraform
3 30 (21.28%) Prometheus
4 28 (19.86%) Grafana
5 8 (5.67%) Kubernetes
5 8 (5.67%) Nessus
6 7 (4.96%) Proxmox
7 6 (4.26%) Oracle RMAN
8 4 (2.84%) Microsoft Intune
8 4 (2.84%) Puppet
9 3 (2.13%) Argo
9 3 (2.13%) Nagios
10 2 (1.42%) Kustomize
10 2 (1.42%) Progress Chef
10 2 (1.42%) SCOM
11 1 (0.71%) AWS Copilot
11 1 (0.71%) FortiGate
Vendors
1 26 (18.44%) Microsoft
1 26 (18.44%) ServiceNow
2 24 (17.02%) Atlassian
3 22 (15.60%) Juniper
4 20 (14.18%) Cisco
5 15 (10.64%) Google
6 14 (9.93%) VMware
7 13 (9.22%) Apple
7 13 (9.22%) Dell
8 11 (7.80%) Fortinet
8 11 (7.80%) Ubiquiti
9 10 (7.09%) Oracle
9 10 (7.09%) Red Hat
10 7 (4.96%) IBM
11 5 (3.55%) Jaspersoft
12 3 (2.13%) Citrix
13 2 (1.42%) ArcSight
13 2 (1.42%) Fujitsu
13 2 (1.42%) SevOne
13 2 (1.42%) Splunk