Workflow Jobs

Workflow
UK

The table below provides summary statistics for permanent job vacancies requiring Workflow skills. It includes a benchmarking guide to the annual salaries offered in vacancies that cited Workflow over the 6 months leading up to 31 October 2024, comparing them to the same period in the previous two years.

6 months to
31 Oct 2024
Same period 2023 Same period 2022
Rank 224 264 194
Rank change year-on-year +40 -70 -7
Permanent jobs citing Workflow 907 745 2,817
As % of all permanent jobs advertised in the UK 1.19% 1.29% 2.03%
As % of the Processes & Methodologies category 1.42% 1.37% 2.11%
Number of salaries quoted 400 581 1,347
10th Percentile £35,500 £35,000 £34,078
25th Percentile £40,000 £46,250 £43,250
Median annual salary (50th Percentile) £51,500 £62,500 £57,500
Median % change year-on-year -17.60% +8.70% +4.55%
75th Percentile £77,500 £81,250 £76,250
90th Percentile £95,000 £100,000 £95,000
UK excluding London median annual salary £41,250 £50,000 £50,000
% change year-on-year -17.50% - +5.26%

All Process and Methodology Skills
UK

Workflow falls under the Processes and Methodologies category. For comparison with the information above, the following table provides summary statistics for all permanent job vacancies requiring process or methodology skills.

Permanent vacancies with a requirement for process or methodology skills 63,881 54,318 133,368
As % of all permanent jobs advertised in the UK 84.08% 94.30% 96.11%
Number of salaries quoted 30,489 39,141 76,332
10th Percentile £34,000 £32,500 £34,000
25th Percentile £45,000 £44,000 £45,000
Median annual salary (50th Percentile) £60,000 £60,000 £60,000
Median % change year-on-year - - +4.35%
75th Percentile £78,000 £80,000 £81,250
90th Percentile £96,250 £97,500 £98,750
UK excluding London median annual salary £54,439 £52,500 £52,500
% change year-on-year +3.69% - +5.00%

Workflow
Job Vacancy Trend

Job postings citing Workflow as a proportion of all IT jobs advertised.
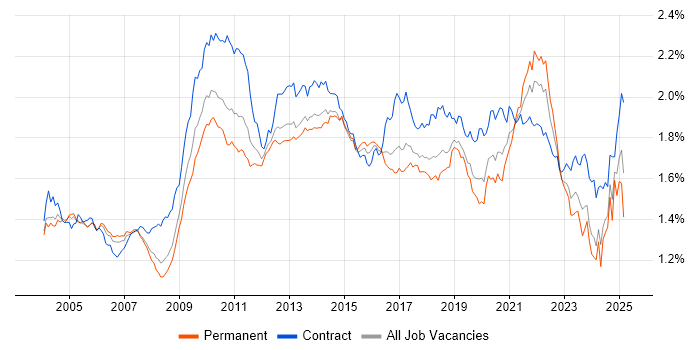
Job vacancy trend for Workflow in the UK

Workflow
Salary Trend

3-month moving average salary quoted in jobs citing Workflow.

Salary trend for Workflow in the UK

Workflow
Salary Histogram

Salary distribution for jobs citing Workflow over the 6 months to 31 October 2024.

Salary histogram for Workflow in the UK

Workflow
Top 18 Job Locations

The table below looks at the demand and provides a guide to the median salaries quoted in IT jobs citing Workflow within the UK over the 6 months to 31 October 2024. The 'Rank Change' column provides an indication of the change in demand within each location based on the same 6 month period last year.

Location Rank Change
on Same Period
Last Year
Matching
Permanent
IT Job Ads
Median Salary
Past 6 Months
Median Salary
% Change
on Same Period
Last Year
Live
Jobs
England +22 811 £50,000 -23.08% 234
UK excluding London +82 610 £41,250 -17.50% 158
Work from Home +52 324 £57,000 -12.31% 149
London -11 266 £70,000 -3.45% 88
North of England +56 187 £40,000 -20.00% 39
South East +14 147 £41,000 -31.67% 39
North West +38 130 £40,000 -23.81% 23
South West +52 105 £43,491 -3.35% 21
Midlands -32 70 £52,500 +16.67% 35
West Midlands -34 46 £55,000 +15.79% 22
Yorkshire +33 45 £55,000 -12.00% 13
East of England -21 38 £50,000 -9.09% 13
Scotland -8 36 £45,000 -5.32% 6
East Midlands -31 24 £38,000 -10.59% 13
Northern Ireland +29 18 £67,500 +17.39% 3
North East -35 12 £55,000 +111.54% 4
Wales +41 8 £47,500 +41.79% 8
Isle of Man - 3 £36,000 -

Workflow
Co-occurring Skills and Capabilities by Category

The follow tables expand on the table above by listing co-occurrences grouped by category. The same employment type, locality and period is covered with up to 20 co-occurrences shown in each of the following categories:

Application Platforms
1 40 (4.41%) SharePoint
2 28 (3.09%) Oracle Workflow
3 18 (1.98%) Microsoft Exchange
4 15 (1.65%) CMS
5 12 (1.32%) Confluence
6 10 (1.10%) Apache
7 9 (0.99%) Apache Spark
8 5 (0.55%) ArcGIS
8 5 (0.55%) Moodle
9 4 (0.44%) SAS
10 3 (0.33%) Appian
10 3 (0.33%) WordPress
11 2 (0.22%) Adobe Experience Manager
11 2 (0.22%) Apache Airflow
11 2 (0.22%) Drupal
11 2 (0.22%) Smallworld
12 1 (0.11%) OpenStack
12 1 (0.11%) ThingWorx
12 1 (0.11%) Totara
12 1 (0.11%) WebSphere
Applications
1 72 (7.94%) Chatbot
2 57 (6.28%) Microsoft Office
3 45 (4.96%) Microsoft Excel
4 18 (1.98%) Microsoft PowerPoint
5 12 (1.32%) MS Visio
6 4 (0.44%) Adobe Creative Suite
6 4 (0.44%) Microsoft Project
6 4 (0.44%) Spreadsheet
7 3 (0.33%) Simulink
8 2 (0.22%) InDesign
8 2 (0.22%) SPSS
8 2 (0.22%) Trello
9 1 (0.11%) Adobe After Effects
9 1 (0.11%) Adobe Illustrator
9 1 (0.11%) Adobe Premiere
9 1 (0.11%) InfoPath
9 1 (0.11%) Photoshop
9 1 (0.11%) PTC Creo
9 1 (0.11%) Siemens NX
9 1 (0.11%) Windchill
Business Applications
1 19 (2.09%) Oracle EBS
2 13 (1.43%) Oracle Financials
3 12 (1.32%) Oracle iProcurement
4 11 (1.21%) Oracle EBS R12
5 8 (0.88%) Dynamics CRM
6 7 (0.77%) Oracle E-Business Tax
6 7 (0.77%) Oracle General Ledger
6 7 (0.77%) Oracle Payables
6 7 (0.77%) Oracle Receivables
6 7 (0.77%) SAP S/4HANA
7 4 (0.44%) Changepoint
7 4 (0.44%) Demantra
7 4 (0.44%) OpenText VIM for SAP
7 4 (0.44%) Oracle ASCP
7 4 (0.44%) Oracle Assets
7 4 (0.44%) Oracle ERP
7 4 (0.44%) Visualfiles
8 3 (0.33%) Oracle Payroll
8 3 (0.33%) SAP FI
8 3 (0.33%) Unit4 Business World
Cloud Services
1 134 (14.77%) AWS
2 125 (13.78%) Azure
3 74 (8.16%) Power Platform
4 60 (6.62%) ChatGPT
5 58 (6.39%) Anthropic Claude
6 50 (5.51%) Microsoft 365
7 35 (3.86%) SaaS
8 31 (3.42%) Power Automate
9 29 (3.20%) Serverless
10 28 (3.09%) GCP
11 27 (2.98%) PowerApps
12 22 (2.43%) Azure Logic Apps
13 20 (2.21%) Entra ID
14 18 (1.98%) Dynamics 365
15 12 (1.32%) Azure Service Bus
15 12 (1.32%) Azure Stack
16 10 (1.10%) Amazon EC2
16 10 (1.10%) Azure Data Factory
16 10 (1.10%) Azure DevOps
17 9 (0.99%) Azure Functions
Communications & Networking
1 77 (8.49%) Broadband
2 15 (1.65%) DNS
3 14 (1.54%) 2G
3 14 (1.54%) 3G
3 14 (1.54%) 4G
3 14 (1.54%) 5G
3 14 (1.54%) Radio Access Network
4 13 (1.43%) Firewall
5 12 (1.32%) Intranet
6 10 (1.10%) Internet
7 6 (0.66%) DHCP
7 6 (0.66%) VPN
7 6 (0.66%) WebEx
8 5 (0.55%) VoIP
9 4 (0.44%) Network Security
9 4 (0.44%) TCP/IP
10 2 (0.22%) FTP
10 2 (0.22%) ISDN
10 2 (0.22%) Structured Cabling
10 2 (0.22%) VLAN
Database & Business Intelligence
1 44 (4.85%) SQL Server Reporting Services
2 43 (4.74%) Data Warehouse
3 41 (4.52%) Power BI
3 41 (4.52%) SQL Server
4 35 (3.86%) Data Lake
5 24 (2.65%) Azure SQL Data Warehouse
6 20 (2.21%) Relational Database
7 18 (1.98%) PostgreSQL
8 16 (1.76%) Big Data
8 16 (1.76%) Oracle Reports
9 15 (1.65%) SQL Server Integration Services
10 12 (1.32%) MySQL
10 12 (1.32%) Power Query
11 10 (1.10%) Metadata
12 9 (0.99%) Oracle BI Publisher
13 8 (0.88%) FileMaker
13 8 (0.88%) Hadoop
14 7 (0.77%) GIS
14 7 (0.77%) RDBMS
15 5 (0.55%) Geospatial Data
Development Applications
1 68 (7.50%) LabVIEW
2 45 (4.96%) JIRA
3 23 (2.54%) Git
4 22 (2.43%) Visual Studio
5 10 (1.10%) Gradle
6 8 (0.88%) Jenkins
7 7 (0.77%) GitLab
7 7 (0.77%) JMeter
7 7 (0.77%) JUnit
7 7 (0.77%) Mockito
8 5 (0.55%) TeamCity
8 5 (0.55%) webpack
9 4 (0.44%) Selenium
10 3 (0.33%) Postman
10 3 (0.33%) Team Foundation Server
10 3 (0.33%) Toad
11 2 (0.22%) Babel
11 2 (0.22%) Burp Suite
11 2 (0.22%) Metasploit
11 2 (0.22%) sqlmap
General
1 339 (37.38%) Social Skills
2 179 (19.74%) Finance
3 177 (19.51%) Analytical Skills
4 60 (6.62%) Public Sector
5 58 (6.39%) Presentation Skills
6 53 (5.84%) Marketing
7 50 (5.51%) Inclusion and Diversity
8 47 (5.18%) Law
9 39 (4.30%) Manufacturing
9 39 (4.30%) Organisational Skills
10 36 (3.97%) Retail
11 33 (3.64%) Pharmaceutical
12 32 (3.53%) Legal
13 26 (2.87%) Banking
14 21 (2.32%) Advertising
15 20 (2.21%) Electronics
16 17 (1.87%) Influencing Skills
17 15 (1.65%) Front Office
18 14 (1.54%) Back Office
19 10 (1.10%) Telecoms
Job Titles
1 158 (17.42%) Senior
2 156 (17.20%) Analyst
3 132 (14.55%) Developer
4 79 (8.71%) Software Engineer
5 74 (8.16%) Lead
6 69 (7.61%) Portfolio Analyst
7 68 (7.50%) Senior Electrical Engineer
8 64 (7.06%) Junior
9 59 (6.50%) Junior Software Engineer
10 58 (6.39%) Consultant
11 34 (3.75%) Architect
12 32 (3.53%) Analytics Manager
12 32 (3.53%) Data Analytics Manager
13 26 (2.87%) Business Analyst
14 25 (2.76%) Senior Consultant
15 24 (2.65%) Data Consultant
15 24 (2.65%) Senior Technology Consultant
15 24 (2.65%) Technology Consultant
16 21 (2.32%) Administrator
16 21 (2.32%) Applications Support
Libraries, Frameworks & Software Standards
1 62 (6.84%) XML
2 56 (6.17%) HTML
3 47 (5.18%) .NET
4 40 (4.41%) React
5 33 (3.64%) CSS
6 32 (3.53%) .NET Framework
7 26 (2.87%) JSON
7 26 (2.87%) REST
8 21 (2.32%) .NET Core
9 17 (1.87%) HTML5 Canvas
9 17 (1.87%) Web Services
10 15 (1.65%) OAuth
10 15 (1.65%) OpenID
10 15 (1.65%) SAML
11 13 (1.43%) AngularJS
11 13 (1.43%) SailPoint
12 12 (1.32%) FIX Protocol
12 12 (1.32%) LDAP
13 10 (1.10%) jQuery
14 9 (0.99%) Spring
Miscellaneous
1 69 (7.61%) Management Information System
2 32 (3.53%) Product Ownership
3 24 (2.65%) Mobile App
4 23 (2.54%) Cloud Native
4 23 (2.54%) Data Structures
4 23 (2.54%) Distributed Systems
5 22 (2.43%) Onboarding
6 19 (2.09%) Digital Media
7 18 (1.98%) Blog
7 18 (1.98%) Hybrid Cloud
7 18 (1.98%) Self-Motivation
8 17 (1.87%) Foreign Exchange (FX)
9 15 (1.65%) Life Science
10 14 (1.54%) Linux Command Line
11 13 (1.43%) Algorithms
11 13 (1.43%) e-Learning
11 13 (1.43%) Equities
11 13 (1.43%) Legacy Systems
12 11 (1.21%) Replication
13 10 (1.10%) Derivative
Operating Systems
1 61 (6.73%) Linux
2 47 (5.18%) Windows
3 18 (1.98%) Windows Server
4 13 (1.43%) Android
4 13 (1.43%) Windows 10
5 7 (0.77%) Debian
6 4 (0.44%) Unix
7 3 (0.33%) Apple iOS
7 3 (0.33%) Mac OS
8 2 (0.22%) Windows Server 2016
9 1 (0.11%) Windows 8
Processes & Methodologies
1 253 (27.89%) Agile
2 192 (21.17%) Continuous Improvement
3 168 (18.52%) Problem-Solving
4 127 (14.00%) Project Management
4 127 (14.00%) Workflow Management
5 109 (12.02%) Artificial Intelligence
6 106 (11.69%) Data Analysis
7 102 (11.25%) Software Engineering
8 98 (10.80%) Customer Experience
9 93 (10.25%) Decision-Making
10 90 (9.92%) Analytics
11 88 (9.70%) Task Automation
12 87 (9.59%) DevOps
13 82 (9.04%) Roadmaps
14 78 (8.60%) Stakeholder Management
15 73 (8.05%) Logistics
15 73 (8.05%) Mentoring
16 72 (7.94%) Conversational UI
16 72 (7.94%) Resource Management
17 68 (7.50%) Experiential Learning
Programming Languages
1 184 (20.29%) SQL
2 112 (12.35%) Python
3 60 (6.62%) JavaScript
4 56 (6.17%) Java
5 52 (5.73%) C#
6 47 (5.18%) PowerShell
7 36 (3.97%) VBA
8 17 (1.87%) T-SQL
9 13 (1.43%) C++
10 12 (1.32%) PL/SQL
11 9 (0.99%) TypeScript
12 8 (0.88%) ABAP
12 8 (0.88%) Shell Script
13 7 (0.77%) VB
14 6 (0.66%) PHP
14 6 (0.66%) Rust
15 4 (0.44%) Bash
15 4 (0.44%) R
15 4 (0.44%) SAPscript
15 4 (0.44%) XQuery
Qualifications
1 270 (29.77%) Degree
2 68 (7.50%) HNC
2 68 (7.50%) HND
3 56 (6.17%) Security Cleared
4 36 (3.97%) Azure Certification
5 29 (3.20%) Computer Science Degree
6 26 (2.87%) AWS Certification
7 21 (2.32%) SC Cleared
8 17 (1.87%) Master's Degree
9 11 (1.21%) BPSS Clearance
10 10 (1.10%) ITIL Certification
11 8 (0.88%) PhD
12 6 (0.66%) DBS Check
12 6 (0.66%) Microsoft Certification
13 5 (0.55%) ACCA
14 4 (0.44%) CIMA
14 4 (0.44%) IIBA
15 3 (0.33%) CISM
15 3 (0.33%) CISSP
15 3 (0.33%) GIAC
Quality Assurance & Compliance
1 69 (7.61%) ISO 9001
2 68 (7.50%) ISO/IEC 17025
3 58 (6.39%) QA
4 24 (2.65%) Accessibility
5 15 (1.65%) Good Clinical Practice
6 14 (1.54%) GDPR
7 12 (1.32%) Data Quality
8 11 (1.21%) NIST
9 9 (0.99%) Cyber Essentials
9 9 (0.99%) ISO/IEC 27001
10 8 (0.88%) SLA
11 7 (0.77%) PMO
12 5 (0.55%) NIST 800
13 3 (0.33%) HAZOP
13 3 (0.33%) ISO 26262
14 2 (0.22%) IEC 62304
14 2 (0.22%) ISO 13485
14 2 (0.22%) Software Quality Assurance
15 1 (0.11%) Actionable Recommendations
15 1 (0.11%) Cyber Essentials PLUS
System Software
1 34 (3.75%) Active Directory
2 23 (2.54%) Docker
3 9 (0.99%) NDS
3 9 (0.99%) NetIQ eDirectory
3 9 (0.99%) Virtual Servers
4 5 (0.55%) VMware Infrastructure
5 4 (0.44%) Virtual Machines
6 3 (0.33%) Slurm Workload Manager
7 2 (0.22%) XenApp
8 1 (0.11%) Firmware
8 1 (0.11%) Microsoft App-V
Systems Management
1 16 (1.76%) Kubernetes
2 14 (1.54%) Ansible
3 12 (1.32%) NetIQ Identity Manager
4 10 (1.10%) Kibana
5 9 (0.99%) Single Sign-On
5 9 (0.99%) Terraform
6 7 (0.77%) Puppet
7 5 (0.55%) Grafana
7 5 (0.55%) Prometheus
8 3 (0.33%) Functional Safety
8 3 (0.33%) Jamf Pro
8 3 (0.33%) logstash
8 3 (0.33%) Nagios
8 3 (0.33%) Progress Chef
9 1 (0.11%) Active Directory Federation Services
9 1 (0.11%) Plesk
9 1 (0.11%) SCCM
Vendors
1 167 (18.41%) Microsoft
2 36 (3.97%) Oracle
3 35 (3.86%) Google
4 25 (2.76%) Dynatrace
4 25 (2.76%) SAP
4 25 (2.76%) ServiceNow
5 17 (1.87%) Salesforce
6 15 (1.65%) ForgeRock
6 15 (1.65%) Splunk
7 14 (1.54%) CyberArk
7 14 (1.54%) Nokia
8 12 (1.32%) NetIQ
9 11 (1.21%) Databricks
10 10 (1.10%) Adobe
11 9 (0.99%) Novell
12 7 (0.77%) iManage
12 7 (0.77%) Okta
12 7 (0.77%) VMware
13 6 (0.66%) Cisco
13 6 (0.66%) IBM