Coaching Contracts in the South East

Coaching
England > South East

The table below provides summary statistics for contract job vacancies advertised in the South East requiring Coaching skills. It includes a benchmarking guide to the contractor rates offered in vacancies that cited Coaching over the 6 months leading up to 13 June 2024, comparing them to the same period in the previous two years.

6 months to
13 Jun 2024
Same period 2023 Same period 2022
Rank 124 87 84
Rank change year-on-year -37 -3 +16
Contract jobs citing Coaching 76 138 220
As % of all contract jobs advertised in the South East 1.32% 2.44% 2.87%
As % of the Processes & Methodologies category 1.60% 2.74% 3.20%
Number of daily rates quoted 37 107 165
10th Percentile £313 £231 £374
25th Percentile £400 £475 £463
Median daily rate (50th Percentile) £550 £608 £550
Median % change year-on-year -9.47% +10.45% +3.77%
75th Percentile £638 £669 £638
90th Percentile £775 £700 £688
England median daily rate £550 £600 £550
% change year-on-year -8.33% +9.09% +4.76%
Number of hourly rates quoted 7 7 2
10th Percentile £48.19 £56.25 £28.63
25th Percentile £64.25 £58.13 £34.06
Median hourly rate £70.00 £70.00 £43.75
Median % change year-on-year - +60.00% +201.72%
75th Percentile - £75.00 £54.06
90th Percentile - - £59.88
England median hourly rate £50.00 £53.75 £40.00
% change year-on-year -6.98% +34.38% +90.48%

All Process and Methodology Skills
South East

Coaching falls under the Processes and Methodologies category. For comparison with the information above, the following table provides summary statistics for all contract job vacancies requiring process or methodology skills in the South East.

Contract vacancies with a requirement for process or methodology skills 4,758 5,043 6,873
As % of all contract IT jobs advertised in the South East 82.70% 89.05% 89.76%
Number of daily rates quoted 2,760 3,463 4,677
10th Percentile £260 £250 £246
25th Percentile £400 £400 £400
Median daily rate (50th Percentile) £501 £505 £500
Median % change year-on-year -0.79% +1.00% +8.11%
75th Percentile £625 £619 £600
90th Percentile £700 £700 £675
England median daily rate £525 £550 £550
% change year-on-year -4.55% - +10.00%
Number of hourly rates quoted 468 218 275
10th Percentile £13.00 £16.25 £12.31
25th Percentile £18.32 £25.95 £15.50
Median hourly rate £49.50 £52.50 £22.50
Median % change year-on-year -5.71% +133.33% -10.00%
75th Percentile £65.00 £66.16 £48.67
90th Percentile £76.90 £75.00 £64.90
England median hourly rate £37.50 £36.00 £25.68
% change year-on-year +4.17% +40.19% +14.13%

Coaching
Job Vacancy Trend in the South East

Job postings citing Coaching as a proportion of all IT jobs advertised in the South East.
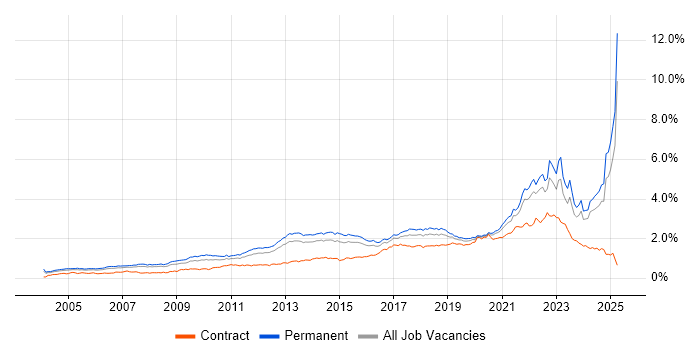
Job vacancy trend for Coaching in the South East

Coaching
Contractor Daily Rate Trend in the South East

3-month moving average daily rate quoted in jobs citing Coaching in the South East.

Daily rate trend for Coaching in the South East

Coaching
Daily Rate Histogram in the South East

Daily rate distribution for jobs citing Coaching in the South East over the 6 months to 13 June 2024.

Daily rate histogram for Coaching in the South East

Coaching
Contractor Hourly Rate Trend in the South East

3-month moving average hourly rates quoted in jobs citing Coaching in the South East.

Hourly rate trend for Coaching in the South East

Coaching
Hourly Rate Histogram in the South East

Hourly rate distribution of jobs citing Coaching in the South East over the 6 months to 13 June 2024.

Hourly rate histogram for Coaching in the South East

Coaching
Contract Job Locations in the South East

The table below looks at the demand and provides a guide to the median contractor rates quoted in IT jobs citing Coaching within the South East region over the 6 months to 13 June 2024. The 'Rank Change' column provides an indication of the change in demand within each location based on the same 6 month period last year.

Location Rank Change
on Same Period
Last Year
Matching
Contract
IT Job Ads
Median
Daily Rate
Past 6 Months
Median Daily Rate
% Change
on Same Period
Last Year
Live
Jobs
Thames Valley -26 42 £400 -33.33% 56
Berkshire -13 38 £400 -29.82% 20
West Sussex +18 11 £750 +50.00% 13
Surrey +1 10 £463 -26.00% 25
Hampshire -22 7 £638 +15.91% 25
Kent +10 5 £625 +8.93% 18
Buckinghamshire -6 4 - - 17
M4 Corridor - 1 £598 -
Coaching
England

Coaching
Co-occurring Skills and Capabilities in the South East by Category

The follow tables expand on the table above by listing co-occurrences grouped by category. The same employment type, locality and period is covered with up to 20 co-occurrences shown in each of the following categories:

Application Platforms
1 4 (5.26%) SAS
2 3 (3.95%) Confluence
3 2 (2.63%) CMS
Applications
1 5 (6.58%) Adobe After Effects
1 5 (6.58%) Adobe Premiere
1 5 (6.58%) CINEMA 4D
1 5 (6.58%) Microsoft PowerPoint
2 3 (3.95%) Microsoft Excel
2 3 (3.95%) Microsoft Office
3 2 (2.63%) Adobe Creative Suite
4 1 (1.32%) Microsoft Project
4 1 (1.32%) Simulink
Business Applications
1 2 (2.63%) Sparx Enterprise Architect
2 1 (1.32%) Primavera
Cloud Services
1 11 (14.47%) Azure
2 5 (6.58%) Azure Monitor
3 4 (5.26%) AWS
4 3 (3.95%) Azure Cognitive Search
4 3 (3.95%) Azure Cosmos DB
4 3 (3.95%) Azure DevOps
4 3 (3.95%) Azure Key Vault
4 3 (3.95%) Microsoft 365
5 2 (2.63%) Power Platform
5 2 (2.63%) SaaS
6 1 (1.32%) Amazon CloudWatch
6 1 (1.32%) Amazon ECR
6 1 (1.32%) Amazon SQS
6 1 (1.32%) AWS Direct Connect
6 1 (1.32%) Azure Data Factory
6 1 (1.32%) Datadog
6 1 (1.32%) IaaS
6 1 (1.32%) Route 53
6 1 (1.32%) Serverless
6 1 (1.32%) Virtual Private Cloud
Communications & Networking
1 1 (1.32%) Firewall
1 1 (1.32%) OpenLDAP
Database & Business Intelligence
1 2 (2.63%) Amazon Redshift
1 2 (2.63%) Big Data
1 2 (2.63%) Metadata
1 2 (2.63%) Power BI
2 1 (1.32%) Amazon RDS
2 1 (1.32%) Metadata Repository
Development Applications
1 4 (5.26%) JIRA
2 3 (3.95%) Git
2 3 (3.95%) Rational DOORS
3 2 (2.63%) GitLab
4 1 (1.32%) Jenkins
General
1 30 (39.47%) Finance
2 25 (32.89%) Social Skills
3 15 (19.74%) Legal
4 12 (15.79%) Marketing
5 11 (14.47%) Analytical Skills
6 10 (13.16%) Telecoms
7 9 (11.84%) Retail
8 4 (5.26%) Influencing Skills
9 3 (3.95%) Public Sector
10 2 (2.63%) Banking
10 2 (2.63%) Presentation Skills
11 1 (1.32%) Billing
11 1 (1.32%) Documentation Skills
11 1 (1.32%) Electronics
11 1 (1.32%) General Ledger
11 1 (1.32%) Local Government
11 1 (1.32%) Manufacturing
Job Titles
1 16 (21.05%) Lead
2 10 (13.16%) Designer
3 9 (11.84%) Architect
3 9 (11.84%) Lead Designer
4 7 (9.21%) Analyst
5 5 (6.58%) Developer
5 5 (6.58%) Project Manager
5 5 (6.58%) Service Analyst
5 5 (6.58%) Service Management Analyst
5 5 (6.58%) Solutions Architect
6 4 (5.26%) Animator
6 4 (5.26%) Senior
6 4 (5.26%) Video Editor
7 3 (3.95%) DevOps Engineer
7 3 (3.95%) Senior Developer
7 3 (3.95%) Technical Architect
8 2 (2.63%) IT Manager
8 2 (2.63%) Security Engineer
8 2 (2.63%) Support Engineer
8 2 (2.63%) Systems Engineer
Libraries, Frameworks & Software Standards
1 4 (5.26%) Node.js
2 3 (3.95%) .NET
2 3 (3.95%) AngularJS
3 2 (2.63%) CSS
4 1 (1.32%) HTML
4 1 (1.32%) LDAP
4 1 (1.32%) PySpark
Miscellaneous
1 8 (10.53%) Management Information System
2 5 (6.58%) CMDB
2 5 (6.58%) Motion Graphics
3 4 (5.26%) Credit Risk
4 3 (3.95%) Animation
4 3 (3.95%) Data Centre
4 3 (3.95%) Private Cloud
4 3 (3.95%) Product Ownership
4 3 (3.95%) Public Cloud
5 2 (2.63%) PMI
5 2 (2.63%) Virtual Team
6 1 (1.32%) Analogue Electronics
6 1 (1.32%) Data Protection Act
6 1 (1.32%) Enterprise Cloud
6 1 (1.32%) IoT
6 1 (1.32%) Mobile App
Operating Systems
1 2 (2.63%) Windows
2 1 (1.32%) Windows Server
Processes & Methodologies
1 31 (40.79%) Continuous Improvement
2 24 (31.58%) Agile
3 21 (27.63%) Mentoring
4 17 (22.37%) Stakeholder Management
5 11 (14.47%) ITIL
5 11 (14.47%) Roadmaps
6 10 (13.16%) Scaled Agile Framework
6 10 (13.16%) Storytelling
7 9 (11.84%) Change Management
8 8 (10.53%) Business Strategy
9 7 (9.21%) DevOps
9 7 (9.21%) People Management
9 7 (9.21%) Problem-Solving
9 7 (9.21%) Service Management
10 6 (7.89%) Configuration Management
10 6 (7.89%) Decision-Making
10 6 (7.89%) Project Management
10 6 (7.89%) Scrum
10 6 (7.89%) Service Delivery
10 6 (7.89%) Supplier Management
Programming Languages
1 9 (11.84%) Python
2 5 (6.58%) SQL
3 4 (5.26%) PowerShell
3 4 (5.26%) R
4 3 (3.95%) C#
5 2 (2.63%) Bicep
5 2 (2.63%) C
5 2 (2.63%) Java
5 2 (2.63%) JavaScript
5 2 (2.63%) Kusto Query Language
6 1 (1.32%) Bash
6 1 (1.32%) C++
6 1 (1.32%) MATLAB
6 1 (1.32%) Perl
6 1 (1.32%) PHP
6 1 (1.32%) Ruby
Qualifications
1 11 (14.47%) Security Cleared
2 9 (11.84%) Degree
3 7 (9.21%) SC Cleared
4 5 (6.58%) CIPD
4 5 (6.58%) Computer Science Degree
5 4 (5.26%) ACCA
6 3 (3.95%) DV Cleared
7 2 (2.63%) ICAEW
7 2 (2.63%) PgMP
7 2 (2.63%) PMI Certification
7 2 (2.63%) PRINCE2 Certification
8 1 (1.32%) CEH
8 1 (1.32%) CIMA
8 1 (1.32%) CIPFA
8 1 (1.32%) CISSP
8 1 (1.32%) DBS Check
8 1 (1.32%) HND
8 1 (1.32%) Microsoft Certification
Quality Assurance & Compliance
1 8 (10.53%) SLA
2 7 (9.21%) QA
3 2 (2.63%) Accessibility
4 1 (1.32%) GDPR
System Software
1 2 (2.63%) Active Directory
2 1 (1.32%) Docker
2 1 (1.32%) Virtual Machines
Systems Management
1 5 (6.58%) Terraform
2 3 (3.95%) Kubernetes
3 1 (1.32%) Ansible
3 1 (1.32%) Microsoft Intune
3 1 (1.32%) Nagios
3 1 (1.32%) Progress Chef
3 1 (1.32%) Puppet
3 1 (1.32%) SCCM
Vendors
1 6 (7.89%) Microsoft
2 5 (6.58%) ServiceNow
3 2 (2.63%) Adobe
3 2 (2.63%) IBM
3 2 (2.63%) SolarWinds
3 2 (2.63%) Sparx
4 1 (1.32%) Cadence
4 1 (1.32%) Cisco
4 1 (1.32%) Databricks
4 1 (1.32%) Mentor Graphics
4 1 (1.32%) New Relic
4 1 (1.32%) Palo Alto
4 1 (1.32%) Pega
4 1 (1.32%) Splunk
4 1 (1.32%) VMware