Kibana Contracts with Work from Home Options

Elastic Kibana
UK > Work from Home

The table below provides summary statistics for contract job vacancies with an option to work from home (WFH) and a requirement for Kibana skills. Included is a benchmarking guide to the contractor rates offered in vacancies that have cited Kibana over the 6 months to 13 May 2024 with a comparison to the same period in the previous 2 years.

6 months to
13 May 2024
Same period 2023 Same period 2022
Rank 306 403 468
Rank change year-on-year +97 +65 -69
Contract jobs citing Kibana 43 63 152
As % of all contract jobs with a WFH option 0.29% 0.25% 0.34%
As % of the Systems Management category 2.66% 1.52% 2.13%
Number of daily rates quoted 37 46 125
10th Percentile £337 £450 £419
25th Percentile £450 £474 £500
Median daily rate (50th Percentile) £480 £495 £540
Median % change year-on-year -3.03% -8.33% +8.00%
75th Percentile £533 £508 £675
90th Percentile £623 £536 £750
UK median daily rate £510 £500 £575
% change year-on-year +2.00% -13.04% +15.00%
Number of hourly rates quoted 1 0 1
10th Percentile - - -
25th Percentile £58.75 - £51.25
Median hourly rate £60.00 - £52.50
75th Percentile £61.25 - £53.75
90th Percentile - - -
UK median hourly rate £60.00 £90.00 £80.00
% change year-on-year -33.33% +12.50% -

All Systems Management Skills
Work from Home

Kibana is in the Systems Management category. The following table is for comparison with the above and provides summary statistics for all contract job vacancies with a WFH option and a requirement for systems management skills.

Contract vacancies with a requirement for systems management skills 1,616 4,147 7,139
As % of all contract jobs with a WFH option 10.82% 16.46% 16.12%
Number of daily rates quoted 1,207 3,066 5,322
10th Percentile £350 £400 £400
25th Percentile £450 £470 £474
Median daily rate (50th Percentile) £525 £558 £563
Median % change year-on-year -5.91% -0.80% +9.76%
75th Percentile £627 £675 £660
90th Percentile £700 £750 £745
UK median daily rate £514 £560 £565
% change year-on-year -8.21% -0.88% +13.00%
Number of hourly rates quoted 18 76 46
10th Percentile £19.98 £25.36 £15.63
25th Percentile £46.25 £52.19 £20.75
Median hourly rate £47.75 £66.00 £35.00
Median % change year-on-year -27.65% +88.57% -22.22%
75th Percentile £56.88 £76.13 £64.19
90th Percentile £62.75 £87.50 £73.75
UK median hourly rate £25.77 £55.00 £22.50
% change year-on-year -53.15% +144.44% -43.75%

Kibana
Trend for Jobs with a WFH Option

Job vacancies with a work from home option citing Kibana as a proportion of all IT jobs advertised.
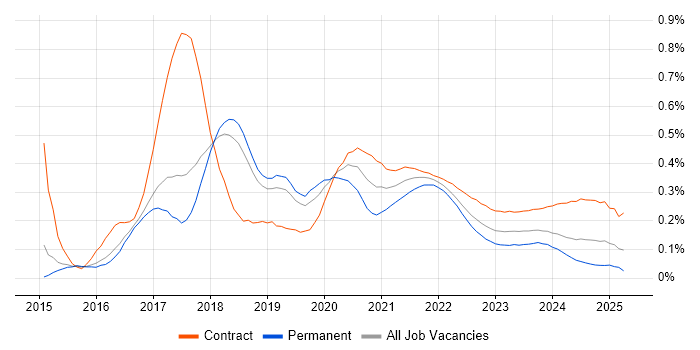
Kibana trend for jobs with a WFH option

Kibana
Daily Rate Trend for Jobs with a WFH Option

3-month moving average daily rate quoted in job vacancies with a work from home option citing Kibana.

Kibana daily rate for jobs with a WFH option

Kibana
Daily Rate Histogram for Jobs with a WFH Option

Daily rate distribution for jobs with a work from home option citing Kibana over the 6 months to 13 May 2024.

Kibana daily rate histogram for jobs with a WFH option

Kibana
Co-occurring Skills and Capabilities with WFH Options by Category

The follow tables expand on the table above by listing co-occurrences grouped by category. The same employment type, locality and period is covered with up to 20 co-occurrences shown in each of the following categories:

Application Platforms
1 11 (25.58%) Confluence
2 4 (9.30%) OpenStack
3 3 (6.98%) JBoss
4 2 (4.65%) IIS
5 1 (2.33%) Apache
5 1 (2.33%) Cloud Foundry
Business Applications
1 1 (2.33%) Dynamics CRM
1 1 (2.33%) SAP MDG
Cloud Services
1 22 (51.16%) AWS
2 11 (25.58%) OpenShift
3 10 (23.26%) GitHub
4 9 (20.93%) Serverless
5 8 (18.60%) Amazon S3
5 8 (18.60%) AWS Lambda
5 8 (18.60%) Azure
6 7 (16.28%) Amazon EC2
6 7 (16.28%) AWS CloudFormation
7 5 (11.63%) Amazon ECS
7 5 (11.63%) Amazon OpenSearch
7 5 (11.63%) GCP
8 4 (9.30%) AWS Fargate
9 3 (6.98%) Kong
10 2 (4.65%) Amazon CloudWatch
10 2 (4.65%) Apigee
10 2 (4.65%) Azure DevOps
10 2 (4.65%) Datadog
10 2 (4.65%) Microsoft 365
10 2 (4.65%) Power Platform
Communications & Networking
1 11 (25.58%) TCP/IP
2 10 (23.26%) DNS
3 7 (16.28%) Firewall
3 7 (16.28%) Wireshark
4 6 (13.95%) HTTP
5 4 (9.30%) DHCP
5 4 (9.30%) Intrusion Detection
5 4 (9.30%) Network Security
5 4 (9.30%) tcpdump
6 3 (6.98%) BGP
6 3 (6.98%) Cisco ASA
6 3 (6.98%) Cisco Nexus
6 3 (6.98%) MPLS
6 3 (6.98%) OSPF
6 3 (6.98%) SD-WAN
6 3 (6.98%) SNMP
6 3 (6.98%) VPN
6 3 (6.98%) WAN
7 2 (4.65%) Reverse Proxy
8 1 (2.33%) BIG-IP
Database & Business Intelligence
1 24 (55.81%) Elasticsearch
2 11 (25.58%) PostgreSQL
3 5 (11.63%) Relational Database
4 4 (9.30%) Apache Hive
4 4 (9.30%) Hadoop
4 4 (9.30%) MongoDB
4 4 (9.30%) NoSQL
4 4 (9.30%) RDBMS
4 4 (9.30%) Tableau
5 3 (6.98%) InfluxDB
6 2 (4.65%) Amazon Aurora
6 2 (4.65%) MySQL
6 2 (4.65%) Power BI
6 2 (4.65%) Redis
7 1 (2.33%) Amazon RDS
7 1 (2.33%) Apache Cassandra
7 1 (2.33%) CouchDB
7 1 (2.33%) DynamoDB
Development Applications
1 24 (55.81%) Jenkins
2 16 (37.21%) JIRA
3 11 (25.58%) GitLab
4 8 (18.60%) Git
5 6 (13.95%) Sonatype Nexus
6 5 (11.63%) Artifactory
7 4 (9.30%) CircleCI
7 4 (9.30%) IDA Disassembler
7 4 (9.30%) Travis CI
8 3 (6.98%) Atlassian Bamboo
8 3 (6.98%) Bitbucket Server
8 3 (6.98%) CA Release Automation
8 3 (6.98%) JMeter
8 3 (6.98%) SonarQube
8 3 (6.98%) TeamCity
9 2 (4.65%) NeoLoad
9 2 (4.65%) Octopus Deploy
10 1 (2.33%) Cucumber
10 1 (2.33%) Mercurial
10 1 (2.33%) Mockito
General
1 8 (18.60%) Social Skills
2 7 (16.28%) Analytical Skills
2 7 (16.28%) Public Sector
3 5 (11.63%) Finance
4 4 (9.30%) Manufacturing
5 3 (6.98%) Banking
5 3 (6.98%) Influencing Skills
6 2 (4.65%) Presentation Skills
7 1 (2.33%) Inclusion and Diversity
7 1 (2.33%) Military
7 1 (2.33%) Retail
Job Titles
1 11 (25.58%) DevOps Engineer
2 7 (16.28%) AWS Engineer
3 6 (13.95%) Developer
4 5 (11.63%) AWS DevOps
4 5 (11.63%) AWS DevOps Engineer
4 5 (11.63%) Cloud Platform Engineer
4 5 (11.63%) Platform Engineer
5 4 (9.30%) Architect
5 4 (9.30%) Senior
6 3 (6.98%) Automation Engineer
6 3 (6.98%) Cloud Engineer
6 3 (6.98%) DevOps Architect
6 3 (6.98%) DevOps Automation Engineer
6 3 (6.98%) Full Stack Developer
6 3 (6.98%) Java Developer
6 3 (6.98%) Network Engineer
6 3 (6.98%) Support Engineer
7 2 (4.65%) Java Engineer
7 2 (4.65%) Lead
7 2 (4.65%) Senior Java Engineer
Libraries, Frameworks & Software Standards
1 14 (32.56%) Elastic Stack
2 8 (18.60%) Spring Boot
3 7 (16.28%) AWS CDK
3 7 (16.28%) RabbitMQ
3 7 (16.28%) Spring
4 6 (13.95%) REST
5 5 (11.63%) JSON
6 4 (9.30%) OLE
6 4 (9.30%) Spring Security
6 4 (9.30%) XML
7 3 (6.98%) HTML
7 3 (6.98%) OAuth
7 3 (6.98%) React
7 3 (6.98%) YAML
8 2 (4.65%) CSS
8 2 (4.65%) Kafka
8 2 (4.65%) OAuth2
8 2 (4.65%) Spring WebFlux
8 2 (4.65%) Web Services
9 1 (2.33%) .NET
Miscellaneous
1 4 (9.30%) Cyber Kill Chain
1 4 (9.30%) YARA
2 3 (6.98%) Clustering
2 3 (6.98%) Data Structures
2 3 (6.98%) Legacy Systems
3 2 (4.65%) CBDC
3 2 (4.65%) Data Centre
3 2 (4.65%) PKI
4 1 (2.33%) Cloud Native
4 1 (2.33%) Digital Currency
4 1 (2.33%) Distributed Systems
4 1 (2.33%) Over-the-Top Content
4 1 (2.33%) STB
Operating Systems
1 19 (44.19%) Linux
2 12 (27.91%) Red Hat Enterprise Linux
3 9 (20.93%) Windows
4 6 (13.95%) Ubuntu
5 4 (9.30%) CentOS
5 4 (9.30%) Windows Server
6 2 (4.65%) Windows 10
6 2 (4.65%) Windows Server 2012
6 2 (4.65%) Windows Server 2016
6 2 (4.65%) Windows Server 2019
Processes & Methodologies
1 28 (65.12%) CI/CD
2 22 (51.16%) DevOps
3 16 (37.21%) Agile
3 16 (37.21%) Infrastructure as Code
4 11 (25.58%) Observability
5 10 (23.26%) Containerisation
6 9 (20.93%) Continuous Integration
6 9 (20.93%) Scrum
6 9 (20.93%) TDD
7 8 (18.60%) Microservices
7 8 (18.60%) Test Automation
8 7 (16.28%) Kanban
8 7 (16.28%) Use Case
9 6 (13.95%) Code Quality
9 6 (13.95%) Root Cause Analysis
9 6 (13.95%) Vulnerability Management
10 5 (11.63%) Collaborative Working
10 5 (11.63%) Incident Response
10 5 (11.63%) Software Delivery
11 4 (9.30%) Task Automation
Programming Languages
1 22 (51.16%) Python
2 12 (27.91%) Bash
3 10 (23.26%) Java
4 6 (13.95%) PowerShell
5 5 (11.63%) Groovy
5 5 (11.63%) JavaScript
5 5 (11.63%) Shell Script
6 3 (6.98%) Perl
6 3 (6.98%) TypeScript
7 2 (4.65%) C
7 2 (4.65%) C#
7 2 (4.65%) C++
7 2 (4.65%) SQL
8 1 (2.33%) ActionScript
8 1 (2.33%) Go
8 1 (2.33%) PHP
8 1 (2.33%) Ruby
8 1 (2.33%) Rust
Qualifications
1 7 (16.28%) Security Cleared
2 5 (11.63%) SC Cleared
3 3 (6.98%) CCDP
3 3 (6.98%) CCNP
3 3 (6.98%) Cisco Certification
3 3 (6.98%) DV Cleared
4 1 (2.33%) BPSS Clearance
4 1 (2.33%) Degree
4 1 (2.33%) SANS
Quality Assurance & Compliance
1 7 (16.28%) NIST
2 5 (11.63%) QA
3 4 (9.30%) Accessibility
3 4 (9.30%) GDPR
3 4 (9.30%) PCI DSS
4 2 (4.65%) ISO/IEC 27001
5 1 (2.33%) ISO 20022
System Software
1 15 (34.88%) Docker
2 6 (13.95%) Active Directory
3 4 (9.30%) Snort
3 4 (9.30%) Virtual Machines
Systems Management
1 23 (53.49%) Grafana
2 18 (41.86%) Kubernetes
3 17 (39.53%) Ansible
4 14 (32.56%) Prometheus
4 14 (32.56%) Terraform
5 13 (30.23%) logstash
6 8 (18.60%) Progress Chef
7 5 (11.63%) Puppet
8 3 (6.98%) Docker Swarm
9 2 (4.65%) Active Directory Federation Services
9 2 (4.65%) Istio
9 2 (4.65%) Nagios
9 2 (4.65%) Packer
10 1 (2.33%) Argo
Vendors
1 19 (44.19%) Splunk
2 6 (13.95%) Google
3 4 (9.30%) AppDynamics
4 3 (6.98%) Arista
4 3 (6.98%) Aruba
4 3 (6.98%) Cisco
4 3 (6.98%) Infoblox
4 3 (6.98%) Meraki
4 3 (6.98%) Microsoft
4 3 (6.98%) Oracle
4 3 (6.98%) Palo Alto
4 3 (6.98%) Red Hat
4 3 (6.98%) VMware
4 3 (6.98%) Zscaler
5 2 (4.65%) Commvault
5 2 (4.65%) Dynatrace
5 2 (4.65%) IBM
5 2 (4.65%) New Relic
6 1 (2.33%) F5
6 1 (2.33%) SAP