Windows Contracts with Hybrid/Remote/WFH Options

Microsoft Windows
UK > Work from Home

The table below provides summary statistics for remote or hybrid contract work requiring Windows skills. It includes a benchmarking guide to the contractor rates offered in vacancies that cited Windows over the 6 months leading up to 1 May 2025, comparing them to the same period in the previous two years.

6 months to
1 May 2025
Same period 2024 Same period 2023
Rank 32 33 23
Rank change year-on-year +1 -10 +7
Contract jobs citing Windows 607 897 1,979
As % of all contract jobs with a WFH option 6.13% 5.85% 7.65%
As % of the Operating Systems category 51.57% 56.17% 55.86%
Number of daily rates quoted 438 654 1,407
10th Percentile £220 £185 £200
25th Percentile £327 £307 £325
Median daily rate (50th Percentile) £468 £450 £475
Median % change year-on-year +3.89% -5.26% +5.56%
75th Percentile £575 £575 £600
90th Percentile £652 £675 £700
UK median daily rate £425 £400 £450
% change year-on-year +6.25% -11.11% +5.88%
Number of hourly rates quoted 18 32 62
10th Percentile £14.20 £12.75 £16.19
25th Percentile £14.81 £14.00 £21.26
Median hourly rate £43.50 £16.00 £61.25
Median % change year-on-year +171.88% -73.88% +135.58%
75th Percentile £65.00 £18.21 £73.75
90th Percentile £69.88 £32.76 £75.90
UK median hourly rate £18.82 £18.00 £22.50
% change year-on-year +4.56% -20.00% +12.50%

All Operating Systems
Work from Home

Windows falls under the Operating Systems category. For comparison with the information above, the following table provides summary statistics for all contract job vacancies with remote or hybrid options requiring operating system skills.

Contract vacancies with a requirement for operating system skills 1,177 1,597 3,543
As % of all contract jobs with a WFH option 11.88% 10.41% 13.70%
Number of daily rates quoted 792 1,113 2,503
10th Percentile £288 £218 £250
25th Percentile £388 £350 £408
Median daily rate (50th Percentile) £500 £475 £520
Median % change year-on-year +5.26% -8.65% +4.00%
75th Percentile £581 £588 £625
90th Percentile £675 £680 £718
UK median daily rate £475 £469 £505
% change year-on-year +1.28% -7.13% +1.00%
Number of hourly rates quoted 34 49 101
10th Percentile £14.20 £13.15 £19.00
25th Percentile £32.19 £14.27 £40.00
Median hourly rate £62.50 £18.30 £57.50
Median % change year-on-year +241.53% -68.17% +35.29%
75th Percentile £68.00 £65.00 £70.00
90th Percentile £68.53 £73.50 £75.00
UK median hourly rate £24.18 £22.00 £39.30
% change year-on-year +9.91% -44.02% +74.67%

Windows
Trend for Jobs with a WFH Option

Job vacancies with remote working options citing Windows as a proportion of all IT jobs advertised.
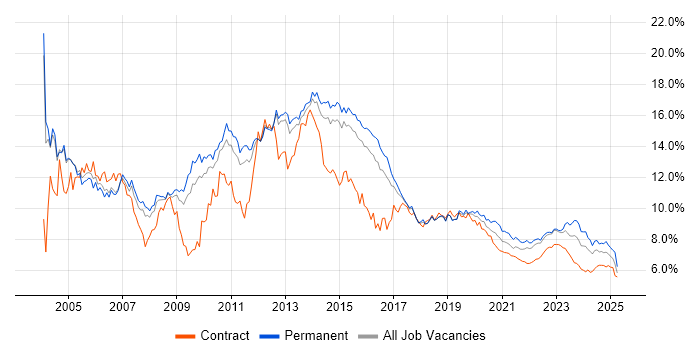
Windows trend for jobs with Hybrid/Remote/WFH options

Windows
Daily Rate Trend for Jobs with a WFH Option

3-month moving average daily rate quoted in job vacancies with remote working options citing Windows.

Windows daily rate for jobs with a WFH option

Windows
Daily Rate Histogram for Jobs with a WFH Option

Daily rate distribution for jobs with remote working options citing Windows over the 6 months to 1 May 2025.

Windows daily rate histogram for jobs with a WFH option

Windows
Hourly Rate Trend for Jobs with a WFH Option

3-month moving average hourly rate quoted in job vacancies with remote working options citing Windows.

Windows hourly rate for jobs with a WFH option

Windows
Hourly Rate Histogram for Jobs with a WFH Option

Hourly rate distribution for jobs with remote working options citing Windows over the 6 months to 1 May 2025.

Windows hourly rate histogram for jobs with a WFH option

Windows
Co-occurring Skills and Capabilities with WFH Options by Category

The follow tables expand on the table above by listing co-occurrences grouped by category. The same employment type, locality and period is covered with up to 20 co-occurrences shown in each of the following categories:

Application Platforms
1 54 (8.90%) Microsoft Exchange
2 48 (7.91%) SharePoint
3 21 (3.46%) Confluence
4 15 (2.47%) JBoss
5 14 (2.31%) IIS
6 10 (1.65%) Tomcat
7 6 (0.99%) CMS
7 6 (0.99%) Skype for Business
8 5 (0.82%) WebLogic
9 4 (0.66%) WebSphere
10 3 (0.49%) BizTalk Server
10 3 (0.49%) Jupyter
10 3 (0.49%) WebSphere Application Server
11 2 (0.33%) Oracle Workflow
12 1 (0.16%) Apache
12 1 (0.16%) DataSynapse
12 1 (0.16%) nginx
Applications
1 68 (11.20%) Microsoft Office
2 7 (1.15%) Microsoft Excel
3 2 (0.33%) Microsoft Project
3 2 (0.33%) Trello
4 1 (0.16%) Chatbot
4 1 (0.16%) Microsoft PowerPoint
4 1 (0.16%) Notion
4 1 (0.16%) ProjectWise
Business Applications
1 6 (0.99%) Dynamics CRM
2 4 (0.66%) Sage X3
3 3 (0.49%) Remedy ITSM
4 2 (0.33%) Actimize
4 2 (0.33%) Oracle Applications
4 2 (0.33%) Oracle Assets
4 2 (0.33%) Oracle Cash Management
4 2 (0.33%) Oracle EBS
4 2 (0.33%) Oracle EBS R12
4 2 (0.33%) Oracle E-Business Tax
4 2 (0.33%) Oracle General Ledger
4 2 (0.33%) Oracle Internet Expenses
4 2 (0.33%) Oracle iProcurement
4 2 (0.33%) Oracle Payables
4 2 (0.33%) Oracle Receivables
4 2 (0.33%) Oracle Subledger Accounting
5 1 (0.16%) IBM Planning Analytics
5 1 (0.16%) Maximo
5 1 (0.16%) NetSuite
5 1 (0.16%) Siebel CRM
Cloud Services
1 187 (30.81%) Azure
2 129 (21.25%) Microsoft 365
3 86 (14.17%) AWS
4 83 (13.67%) Entra ID
5 23 (3.79%) OneDrive
6 21 (3.46%) SaaS
7 18 (2.97%) GitHub
8 17 (2.80%) IaaS
9 16 (2.64%) Amazon EC2
10 12 (1.98%) GCP
11 11 (1.81%) Amazon S3
11 11 (1.81%) Azure DevOps
11 11 (1.81%) Route 53
12 10 (1.65%) Asana
12 10 (1.65%) AWS CloudFormation
12 10 (1.65%) Power Platform
13 9 (1.48%) Slack
14 8 (1.32%) PaaS
14 8 (1.32%) Virtual Private Cloud
15 7 (1.15%) Cloud Computing
Communications & Networking
1 85 (14.00%) DNS
2 63 (10.38%) Firewall
3 62 (10.21%) DHCP
4 38 (6.26%) VPN
5 24 (3.95%) TCP/IP
6 22 (3.62%) WAN
7 21 (3.46%) LAN
8 17 (2.80%) Network Security
9 12 (1.98%) Skype
9 12 (1.98%) SMTP
10 11 (1.81%) Remote Desktop
10 11 (1.81%) SAN
11 9 (1.48%) Cisco ISE
11 9 (1.48%) Internet
11 9 (1.48%) Wireless
12 8 (1.32%) Intrusion Detection
12 8 (1.32%) Wi-Fi
13 7 (1.15%) SSL
14 6 (0.99%) HTTP
15 5 (0.82%) VLAN
Database & Business Intelligence
1 66 (10.87%) SQL Server
2 15 (2.47%) Oracle Database
3 12 (1.98%) KDB
3 12 (1.98%) Kdb+
4 11 (1.81%) Relational Database
5 10 (1.65%) Power BI
6 9 (1.48%) Elasticsearch
6 9 (1.48%) SQL Server Reporting Services
7 8 (1.32%) Amazon RDS
7 8 (1.32%) MongoDB
7 8 (1.32%) SQL Server Integration Services
8 7 (1.15%) PostgreSQL
9 6 (0.99%) Azure SQL Database
9 6 (0.99%) DB2
9 6 (0.99%) MS Access
9 6 (0.99%) RDBMS
10 3 (0.49%) Big Data
10 3 (0.49%) Neo4j
10 3 (0.49%) Oracle Reports
11 2 (0.33%) Informix
Development Applications
1 48 (7.91%) JIRA
2 38 (6.26%) Git
3 26 (4.28%) Jenkins
4 20 (3.29%) Visual Studio
5 17 (2.80%) MSI
6 10 (1.65%) Selenium
6 10 (1.65%) Subversion
7 9 (1.48%) GitLab
8 8 (1.32%) QARun
8 8 (1.32%) SonarQube
8 8 (1.32%) WinRunner
9 5 (0.82%) Ant
9 5 (0.82%) Bitbucket
9 5 (0.82%) Cypress.io
9 5 (0.82%) Maven
9 5 (0.82%) TeamCity
10 4 (0.66%) HP UFT
10 4 (0.66%) JUnit
10 4 (0.66%) TestComplete
10 4 (0.66%) VSS/SourceSafe
General
1 218 (35.91%) Social Skills
2 147 (24.22%) Finance
3 59 (9.72%) Banking
4 43 (7.08%) Analytical Skills
5 34 (5.60%) Public Sector
6 21 (3.46%) Inclusion and Diversity
6 21 (3.46%) Investment Banking
7 15 (2.47%) Telecoms
8 14 (2.31%) Manufacturing
9 10 (1.65%) Organisational Skills
10 9 (1.48%) Presentation Skills
11 8 (1.32%) Front Office
11 8 (1.32%) Retail
12 7 (1.15%) Law
13 6 (0.99%) General Ledger
13 6 (0.99%) Influencing Skills
13 6 (0.99%) Legal
14 5 (0.82%) Documentation Skills
14 5 (0.82%) Local Government
14 5 (0.82%) Wholesale Banking
Job Titles
1 72 (11.86%) Analyst
2 66 (10.87%) Senior
3 56 (9.23%) Support Engineer
4 55 (9.06%) Developer
5 54 (8.90%) Infrastructure Engineer
6 48 (7.91%) Architect
7 33 (5.44%) Windows Engineer
8 30 (4.94%) IT Engineer
9 28 (4.61%) IT Support
10 25 (4.12%) Consultant
11 22 (3.62%) IT Support Engineer
12 20 (3.29%) Azure Engineer
12 20 (3.29%) Lead
13 19 (3.13%) 2nd Line Support
13 19 (3.13%) Service Analyst
14 18 (2.97%) Applications Support
14 18 (2.97%) Service Desk Analyst
14 18 (2.97%) Test Analyst
15 17 (2.80%) 2nd Line Engineer
15 17 (2.80%) 2nd Line Support Engineer
Libraries, Frameworks & Software Standards
1 27 (4.45%) Web Services
2 25 (4.12%) .NET
3 15 (2.47%) Middleware
4 12 (1.98%) LDAP
5 10 (1.65%) REST
6 6 (0.99%) HTML
6 6 (0.99%) Kafka
6 6 (0.99%) Node.js
6 6 (0.99%) Software Packaging
6 6 (0.99%) Spring Boot
7 5 (0.82%) .NET Framework
7 5 (0.82%) AngularJS
7 5 (0.82%) ARM Templates
7 5 (0.82%) Elastic Stack
7 5 (0.82%) Playwright
7 5 (0.82%) SOAP
7 5 (0.82%) XML
8 3 (0.49%) Azure Blueprints
8 3 (0.49%) OpenAPI
8 3 (0.49%) RESTful
Miscellaneous
1 31 (5.11%) Data Centre
2 30 (4.94%) Onboarding
3 23 (3.79%) Management Information System
4 20 (3.29%) PKI
5 19 (3.13%) Enterprise Software
6 17 (2.80%) Self-Motivation
7 15 (2.47%) Cloud Native
8 14 (2.31%) Data Protection Act
8 14 (2.31%) Product Ownership
9 12 (1.98%) Clustering
10 11 (1.81%) Hybrid Cloud
11 10 (1.65%) Security Posture
11 10 (1.65%) Video Conferencing
12 8 (1.32%) Enterprise Storage
12 8 (1.32%) Equities
13 7 (1.15%) Derivative
13 7 (1.15%) Replication
13 7 (1.15%) Security Operations Centre
14 6 (0.99%) Cyber Threat
14 6 (0.99%) Public Cloud
Operating Systems
1 220 (36.24%) Linux
2 170 (28.01%) Windows Server
3 76 (12.52%) Windows 10
4 55 (9.06%) Unix
5 35 (5.77%) Red Hat Enterprise Linux
6 29 (4.78%) Windows Server 2019
7 23 (3.79%) Windows Server 2016
8 20 (3.29%) Android
8 20 (3.29%) Mac OS
9 18 (2.97%) Windows Server 2012
10 16 (2.64%) Apple iOS
11 10 (1.65%) AIX
11 10 (1.65%) VMS
12 7 (1.15%) Windows 7
13 6 (0.99%) Amazon Linux
13 6 (0.99%) Solaris
14 5 (0.82%) Oracle Linux
15 4 (0.66%) Ubuntu
16 3 (0.49%) Mac OS X
17 2 (0.33%) Windows XP
Processes & Methodologies
1 112 (18.45%) Problem-Solving
2 93 (15.32%) ITIL
3 88 (14.50%) Migration
4 67 (11.04%) Infrastructure Engineering
5 66 (10.87%) Agile
6 59 (9.72%) DevOps
7 40 (6.59%) Customer Service
8 39 (6.43%) Service Management
9 38 (6.26%) CI/CD
10 34 (5.60%) High Availability
11 32 (5.27%) ITSM
12 31 (5.11%) Cybersecurity
13 30 (4.94%) Disaster Recovery
13 30 (4.94%) Root Cause Analysis
14 29 (4.78%) Change Management
15 28 (4.61%) Project Management
16 27 (4.45%) Configuration Management
16 27 (4.45%) SDLC
16 27 (4.45%) SIEM
17 25 (4.12%) Containerisation
Programming Languages
1 139 (22.90%) PowerShell
2 97 (15.98%) Python
3 93 (15.32%) SQL
4 49 (8.07%) C#
5 37 (6.10%) Bash
6 32 (5.27%) PL/SQL
7 25 (4.12%) Java
8 22 (3.62%) C++
9 14 (2.31%) Delphi
10 12 (1.98%) JavaScript
10 12 (1.98%) Perl
11 7 (1.15%) Shell Script
11 7 (1.15%) T-SQL
11 7 (1.15%) VB
12 5 (0.82%) Bicep
12 5 (0.82%) TypeScript
12 5 (0.82%) VBScript
13 4 (0.66%) ActionScript
13 4 (0.66%) ActionScript 2.0
13 4 (0.66%) C
Qualifications
1 161 (26.52%) Security Cleared
2 152 (25.04%) SC Cleared
3 31 (5.11%) Degree
4 26 (4.28%) DV Cleared
4 26 (4.28%) Microsoft Certification
5 15 (2.47%) Azure Certification
6 10 (1.65%) Cisco Certification
7 9 (1.48%) AWS Certification
7 9 (1.48%) MCSE
8 8 (1.32%) CCNA
9 7 (1.15%) CISSP
10 5 (0.82%) CISM
11 4 (0.66%) CCNP
11 4 (0.66%) MCSA
12 2 (0.33%) CEH
12 2 (0.33%) CISA
12 2 (0.33%) ITIL Certification
12 2 (0.33%) Oracle Certification
12 2 (0.33%) PMI Certification
12 2 (0.33%) PMP
Quality Assurance & Compliance
1 21 (3.46%) SLA
2 20 (3.29%) QA
3 10 (1.65%) GDPR
4 6 (0.99%) NIST
5 4 (0.66%) Cyber Essentials
5 4 (0.66%) Cyber Essentials PLUS
5 4 (0.66%) Disclosure Scotland
5 4 (0.66%) ISO/IEC 27001
5 4 (0.66%) Sarbanes-Oxley
6 3 (0.49%) PCI DSS
6 3 (0.49%) PMO
6 3 (0.49%) SOC 2
7 2 (0.33%) ITGC
7 2 (0.33%) NCSC
8 1 (0.16%) Accessibility
8 1 (0.16%) Government Security Classifications
8 1 (0.16%) HIPAA
8 1 (0.16%) HMG Security Policy Framework
8 1 (0.16%) ISO 20022
8 1 (0.16%) SEPA
System Software
1 197 (32.45%) Active Directory
2 57 (9.39%) VMware Infrastructure
3 34 (5.60%) Docker
4 27 (4.45%) Hyper-V
5 18 (2.97%) vSphere
6 15 (2.47%) VMware ESXi
7 13 (2.14%) Virtual Machines
8 12 (1.98%) Virtual Servers
9 10 (1.65%) Virtual Desktop
10 5 (0.82%) Microsoft App-V
10 5 (0.82%) Microsoft Virtual Server
10 5 (0.82%) VMware NSX
11 4 (0.66%) XenDesktop
12 3 (0.49%) BitLocker
12 3 (0.49%) DFS Replication
12 3 (0.49%) Firmware
12 3 (0.49%) Oracle RAC
12 3 (0.49%) XenApp
13 2 (0.33%) NFS
13 2 (0.33%) Platform Symphony
Systems Management
1 78 (12.85%) Microsoft Intune
2 60 (9.88%) Ansible
3 58 (9.56%) SCCM
4 44 (7.25%) Terraform
5 37 (6.10%) Kubernetes
6 22 (3.62%) Progress Chef
7 19 (3.13%) WSUS
8 16 (2.64%) Puppet
9 10 (1.65%) FortiGate
9 10 (1.65%) NetBackup
10 9 (1.48%) Single Sign-On
11 8 (1.32%) Grafana
12 7 (1.15%) Kibana
13 6 (0.99%) SCOM
13 6 (0.99%) vCenter Server
14 5 (0.82%) Prometheus
15 4 (0.66%) Packer
16 3 (0.49%) Jamf Pro
16 3 (0.49%) logstash
16 3 (0.49%) Trend Micro Deep Security
Vendors
1 260 (42.83%) Microsoft
2 105 (17.30%) VMware
3 62 (10.21%) Oracle
4 33 (5.44%) Cisco
5 31 (5.11%) ServiceNow
6 29 (4.78%) Red Hat
7 23 (3.79%) Citrix
8 22 (3.62%) CyberArk
9 20 (3.29%) Splunk
10 18 (2.97%) IBM
11 16 (2.64%) Apple
11 16 (2.64%) Palo Alto
12 15 (2.47%) F5
12 15 (2.47%) HP
13 14 (2.31%) SolarWinds
14 12 (1.98%) Dell
15 9 (1.48%) NetApp
16 8 (1.32%) Fortinet
17 7 (1.15%) Qualys
17 7 (1.15%) Veritas