Test Automation Contracts with Hybrid/Remote/WFH Options

Automated Testing
UK > Work from Home

The table below provides summary statistics for remote or hybrid contract work requiring Test Automation skills. It includes a benchmarking guide to the contractor rates offered in vacancies that cited Test Automation over the 6 months leading up to 1 May 2025, comparing them to the same period in the previous two years.

6 months to
1 May 2025
Same period 2024 Same period 2023
Rank 43 45 49
Rank change year-on-year +2 +4 -3
Contract jobs citing Test Automation 458 606 1,175
As % of all contract jobs with a WFH option 4.62% 3.95% 4.54%
As % of the Processes & Methodologies category 5.08% 4.49% 5.06%
Number of daily rates quoted 328 408 857
10th Percentile £325 £363 £400
25th Percentile £400 £425 £458
Median daily rate (50th Percentile) £500 £500 £525
Median % change year-on-year - -4.76% +1.55%
75th Percentile £588 £610 £650
90th Percentile £800 £688 £750
UK median daily rate £500 £513 £550
% change year-on-year -2.44% -6.82% +4.41%
Number of hourly rates quoted 7 39 18
10th Percentile £34.12 - £36.40
25th Percentile £44.51 £52.50 £51.44
Median hourly rate £55.00 £55.00 £61.75
Median % change year-on-year - -10.93% +2.92%
75th Percentile £64.52 £86.25 £88.13
90th Percentile £66.11 £90.00 £90.00
UK median hourly rate £55.00 £60.00 £62.50
% change year-on-year -8.33% -4.00% +13.64%

All Process and Methodology Skills
Work from Home

Test Automation falls under the Processes and Methodologies category. For comparison with the information above, the following table provides summary statistics for all contract job vacancies with remote or hybrid options requiring process or methodology skills.

Contract vacancies with a requirement for process or methodology skills 9,021 13,483 23,229
As % of all contract jobs with a WFH option 91.08% 87.87% 89.84%
Number of daily rates quoted 6,191 8,996 16,418
10th Percentile £340 £325 £363
25th Percentile £419 £425 £450
Median daily rate (50th Percentile) £525 £525 £540
Median % change year-on-year - -2.78% +2.86%
75th Percentile £638 £638 £650
90th Percentile £763 £750 £750
UK median daily rate £520 £525 £550
% change year-on-year -0.95% -4.55% +4.76%
Number of hourly rates quoted 224 579 532
10th Percentile £14.20 £15.17 £19.00
25th Percentile £19.56 £25.25 £30.54
Median hourly rate £39.52 £43.00 £55.00
Median % change year-on-year -8.09% -21.82% +57.14%
75th Percentile £66.13 £60.00 £68.75
90th Percentile £75.00 £75.25 £80.23
UK median hourly rate £29.00 £35.65 £37.30
% change year-on-year -18.65% -4.42% +49.20%

Test Automation
Trend for Jobs with a WFH Option

Job vacancies with remote working options citing Test Automation as a proportion of all IT jobs advertised.
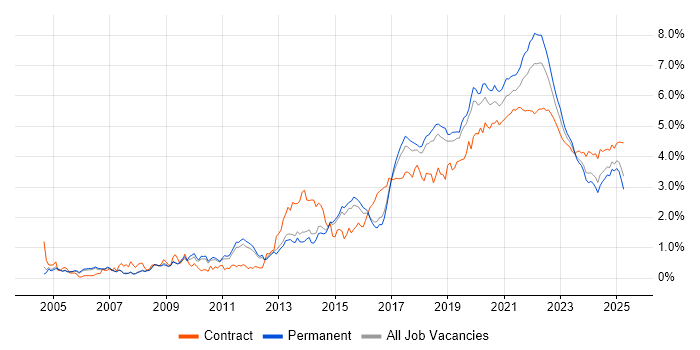
Test Automation trend for jobs with Hybrid/Remote/WFH options

Test Automation
Daily Rate Trend for Jobs with a WFH Option

3-month moving average daily rate quoted in job vacancies with remote working options citing Test Automation.

Test Automation daily rate for jobs with a WFH option

Test Automation
Daily Rate Histogram for Jobs with a WFH Option

Daily rate distribution for jobs with remote working options citing Test Automation over the 6 months to 1 May 2025.

Test Automation daily rate histogram for jobs with a WFH option

Test Automation
Hourly Rate Trend for Jobs with a WFH Option

3-month moving average hourly rate quoted in job vacancies with remote working options citing Test Automation.

Test Automation hourly rate for jobs with a WFH option

Test Automation
Hourly Rate Histogram for Jobs with a WFH Option

Hourly rate distribution for jobs with remote working options citing Test Automation over the 6 months to 1 May 2025.

Test Automation hourly rate histogram for jobs with a WFH option

Test Automation
Co-occurring Skills and Capabilities with WFH Options by Category

The follow tables expand on the table above by listing co-occurrences grouped by category. The same employment type, locality and period is covered with up to 20 co-occurrences shown in each of the following categories:

Application Platforms
1 22 (4.80%) Confluence
2 8 (1.75%) Apache Spark
3 2 (0.44%) Anypoint
3 2 (0.44%) Apache
3 2 (0.44%) Apache Airflow
3 2 (0.44%) GeoServer
4 1 (0.22%) nginx
4 1 (0.22%) Oracle Coherence
4 1 (0.22%) SAS
4 1 (0.22%) SharePoint
4 1 (0.22%) WebLogic
Applications
1 12 (2.62%) Microsoft Excel
2 2 (0.44%) MS Visio
2 2 (0.44%) Trello
3 1 (0.22%) Microsoft PowerPoint
3 1 (0.22%) Spreadsheet
Business Applications
1 5 (1.09%) SAP S/4HANA
2 2 (0.44%) Aladdin
2 2 (0.44%) Dynamics CRM
2 2 (0.44%) SAP Hybris
2 2 (0.44%) SAP MM
2 2 (0.44%) SAP SCM
2 2 (0.44%) SimCorp Dimension
3 1 (0.22%) Payment Gateway
3 1 (0.22%) SAP CO
3 1 (0.22%) SAP CRM
3 1 (0.22%) SAP FI
3 1 (0.22%) SAP FI/CO
3 1 (0.22%) SAP SD
3 1 (0.22%) Unit4 Business World
Cloud Services
1 139 (30.35%) AWS
2 117 (25.55%) Azure
3 58 (12.66%) Azure DevOps
4 49 (10.70%) GCP
5 47 (10.26%) GitHub
6 30 (6.55%) Serverless
7 29 (6.33%) AWS CloudFormation
8 25 (5.46%) AWS Lambda
9 24 (5.24%) SaaS
10 21 (4.59%) Amazon S3
10 21 (4.59%) GitHub Actions
10 21 (4.59%) PaaS
11 20 (4.37%) IaaS
12 16 (3.49%) Amazon SQS
13 12 (2.62%) Azure Cosmos DB
13 12 (2.62%) BrowserStack
14 10 (2.18%) Azure Service Bus
15 9 (1.97%) Amazon CloudWatch
16 7 (1.53%) Amazon ECS
16 7 (1.53%) Google Kubernetes Engine
Communications & Networking
1 39 (8.52%) HTTP
2 24 (5.24%) DNS
3 23 (5.02%) Firewall
3 23 (5.02%) TCP/IP
4 21 (4.59%) DHCP
5 18 (3.93%) BGP
5 18 (3.93%) HTTPS
5 18 (3.93%) OSPF
6 4 (0.87%) DOCSIS
6 4 (0.87%) Wi-Fi
7 3 (0.66%) Network Security
7 3 (0.66%) SSL
7 3 (0.66%) Wireless
8 2 (0.44%) FTP
8 2 (0.44%) SMTP
8 2 (0.44%) VLAN
9 1 (0.22%) 802.11
9 1 (0.22%) Bluetooth
9 1 (0.22%) Broadband
9 1 (0.22%) SNMP
Database & Business Intelligence
1 33 (7.21%) PostgreSQL
2 23 (5.02%) Relational Database
3 21 (4.59%) SQL Server
4 17 (3.71%) MongoDB
5 15 (3.28%) Elasticsearch
5 15 (3.28%) NoSQL
6 13 (2.84%) DynamoDB
7 12 (2.62%) Data Warehouse
8 9 (1.97%) Hadoop
9 8 (1.75%) MySQL
10 7 (1.53%) Big Data
10 7 (1.53%) Data Lake
10 7 (1.53%) MS Access
11 6 (1.31%) Apache Cassandra
12 5 (1.09%) GIS
13 4 (0.87%) Amazon Aurora
13 4 (0.87%) Amazon RDS
14 3 (0.66%) InfluxDB
14 3 (0.66%) ObjectStore
14 3 (0.66%) RDBMS
Development Applications
1 68 (14.85%) Selenium
2 63 (13.76%) JIRA
3 62 (13.54%) Jenkins
4 52 (11.35%) Git
5 46 (10.04%) Cypress.io
6 40 (8.73%) Postman
7 39 (8.52%) GitLab
8 32 (6.99%) Cucumber
9 30 (6.55%) REST Assured
10 25 (5.46%) JMeter
11 21 (4.59%) JUnit
12 16 (3.49%) Appium
13 14 (3.06%) Bitbucket
13 14 (3.06%) SpecFlow
14 12 (2.62%) Gatling
15 11 (2.40%) SonarQube
16 8 (1.75%) HP UFT
16 8 (1.75%) QARun
16 8 (1.75%) SoapUI
16 8 (1.75%) WinRunner
General
1 112 (24.45%) Social Skills
2 65 (14.19%) Finance
3 59 (12.88%) Analytical Skills
4 55 (12.01%) Public Sector
5 44 (9.61%) Banking
6 16 (3.49%) Front Office
7 14 (3.06%) Inclusion and Diversity
8 12 (2.62%) Investment Banking
9 9 (1.97%) Financial Institution
9 9 (1.97%) Law
10 7 (1.53%) Manufacturing
11 6 (1.31%) Presentation Skills
12 4 (0.87%) Organisational Skills
12 4 (0.87%) Police
12 4 (0.87%) Telecoms
13 3 (0.66%) Automotive
13 3 (0.66%) Electronics
13 3 (0.66%) Marketing
13 3 (0.66%) Retail
14 2 (0.44%) Legal
Job Titles
1 79 (17.25%) Developer
2 64 (13.97%) Analyst
3 58 (12.66%) Tester
4 52 (11.35%) Senior
5 42 (9.17%) Test Engineer
6 35 (7.64%) Test Analyst
7 33 (7.21%) Software Engineer
8 32 (6.99%) Architect
9 31 (6.77%) Automation Tester
10 28 (6.11%) Lead
11 20 (4.37%) Pensions Analyst
11 20 (4.37%) QA Engineer
12 18 (3.93%) Cloud Architect
12 18 (3.93%) Cloud Native Architect
12 18 (3.93%) Technical Architect
13 17 (3.71%) DevOps Engineer
13 17 (3.71%) Test Manager
14 13 (2.84%) Consultant
15 12 (2.62%) AWS Engineer
15 12 (2.62%) Senior Developer
Libraries, Frameworks & Software Standards
1 45 (9.83%) Playwright
2 40 (8.73%) .NET
3 38 (8.30%) REST
4 37 (8.08%) RESTful
5 36 (7.86%) React
6 33 (7.21%) Node.js
7 26 (5.68%) CSS
8 24 (5.24%) Kafka
9 23 (5.02%) HTML
10 21 (4.59%) AWS CDK
11 19 (4.15%) Web Services
12 17 (3.71%) Jest
13 16 (3.49%) Spring
14 14 (3.06%) OpenAPI
14 14 (3.06%) pytest
14 14 (3.06%) Spring Boot
14 14 (3.06%) Swagger
15 13 (2.84%) AngularJS
15 13 (2.84%) OpenTelemetry
16 11 (2.40%) OAuth
Miscellaneous
1 29 (6.33%) Cloud Native
2 25 (5.46%) Product Ownership
3 14 (3.06%) Fixed Income
4 10 (2.18%) Data Structures
5 9 (1.97%) Mobile App
6 8 (1.75%) Algorithms
7 7 (1.53%) Legacy Systems
8 6 (1.31%) Management Information System
8 6 (1.31%) Renewable Energy
9 5 (1.09%) Distributed Denial-of-Service
10 4 (0.87%) Data Centre
10 4 (0.87%) Greenfield Project
10 4 (0.87%) Hedge funds
10 4 (0.87%) Linux Command Line
10 4 (0.87%) Reference Data
10 4 (0.87%) Virtual Team
11 3 (0.66%) Client/Server
11 3 (0.66%) Life Science
11 3 (0.66%) Mainframe
11 3 (0.66%) NHS
Operating Systems
1 38 (8.30%) Linux
2 28 (6.11%) Unix
3 22 (4.80%) Windows
4 13 (2.84%) Red Hat Enterprise Linux
5 6 (1.31%) Apple iOS
6 5 (1.09%) Android
7 1 (0.22%) Mac OS X
7 1 (0.22%) Ubuntu
Processes & Methodologies
1 190 (41.48%) Agile
2 184 (40.17%) CI/CD
3 133 (29.04%) DevOps
4 96 (20.96%) Problem-Solving
5 74 (16.16%) Microservices
6 65 (14.19%) Software Engineering
7 64 (13.97%) Containerisation
8 59 (12.88%) Infrastructure as Code
9 58 (12.66%) Migration
10 52 (11.35%) Test Scripting
10 52 (11.35%) Test Strategy
11 50 (10.92%) Scrum
12 48 (10.48%) Continuous Integration
12 48 (10.48%) TDD
13 46 (10.04%) Software Testing
14 44 (9.61%) Manual Testing
15 43 (9.39%) Mentoring
16 41 (8.95%) Performance Testing
17 39 (8.52%) BDD
18 38 (8.30%) User Acceptance Testing
Programming Languages
1 128 (27.95%) Python
2 99 (21.62%) Java
3 96 (20.96%) JavaScript
4 92 (20.09%) SQL
5 62 (13.54%) C#
6 53 (11.57%) TypeScript
7 23 (5.02%) Bash
8 20 (4.37%) Bicep
9 14 (3.06%) C++
9 14 (3.06%) PowerShell
10 11 (2.40%) Go
11 9 (1.97%) Ruby
12 8 (1.75%) Shell Script
13 7 (1.53%) T-SQL
14 6 (1.31%) C
14 6 (1.31%) PHP
15 5 (1.09%) F#
15 5 (1.09%) Groovy
15 5 (1.09%) Rust
15 5 (1.09%) Scala
Qualifications
1 103 (22.49%) Security Cleared
2 94 (20.52%) SC Cleared
3 37 (8.08%) Degree
4 14 (3.06%) Computer Science Degree
5 11 (2.40%) ISTQB
6 9 (1.97%) DV Cleared
7 5 (1.09%) BPSS Clearance
7 5 (1.09%) Master's Degree
8 4 (0.87%) AWS Certification
8 4 (0.87%) ISTQB Foundation Certification
9 3 (0.66%) CEH
9 3 (0.66%) CISSP
9 3 (0.66%) ISEB
10 2 (0.44%) Azure Certification
10 2 (0.44%) CISA
10 2 (0.44%) CRISC
10 2 (0.44%) ISTQB Advanced Certification
10 2 (0.44%) Microsoft Certification
11 1 (0.22%) CREST Certified
11 1 (0.22%) OSCP
Quality Assurance & Compliance
1 92 (20.09%) QA
2 25 (5.46%) Accessibility
3 7 (1.53%) WCAG
4 6 (1.31%) Sarbanes-Oxley
5 5 (1.09%) Data Quality
6 2 (0.44%) GMP
6 2 (0.44%) Government Security Classifications
6 2 (0.44%) GRC
6 2 (0.44%) ITGC
6 2 (0.44%) PMO
6 2 (0.44%) SOX 404
7 1 (0.22%) GDPR
7 1 (0.22%) GxP
7 1 (0.22%) ISO/IEC 27001
7 1 (0.22%) NIST
7 1 (0.22%) PCI DSS
System Software
1 63 (13.76%) Docker
2 3 (0.66%) Active Directory
2 3 (0.66%) VMware Infrastructure
3 2 (0.44%) Virtual Desktop
3 2 (0.44%) VMware ESXi
3 2 (0.44%) VMware NSX
3 2 (0.44%) vSphere
Systems Management
1 70 (15.28%) Kubernetes
2 60 (13.10%) Terraform
3 25 (5.46%) Ansible
4 23 (5.02%) Grafana
5 8 (1.75%) Puppet
6 7 (1.53%) Argo
7 6 (1.31%) Prometheus
8 5 (1.09%) Docker Swarm
8 5 (1.09%) Podman
8 5 (1.09%) Progress Chef
9 4 (0.87%) Kibana
10 3 (0.66%) HP ALM
11 2 (0.44%) CloudHub
11 2 (0.44%) Nessus
12 1 (0.22%) Functional Safety
12 1 (0.22%) Istio
12 1 (0.22%) logstash
12 1 (0.22%) Rancher
12 1 (0.22%) Single Sign-On
Vendors
1 23 (5.02%) Microsoft
2 19 (4.15%) Oracle
3 18 (3.93%) CheckPoint
3 18 (3.93%) Cisco
3 18 (3.93%) Fortinet
3 18 (3.93%) Palo Alto
3 18 (3.93%) SAP
4 14 (3.06%) Google
5 10 (2.18%) ServiceNow
6 9 (1.97%) ION Trading
6 9 (1.97%) Splunk
7 6 (1.31%) Citrix
7 6 (1.31%) Databricks
8 4 (0.87%) Atlassian
8 4 (0.87%) Bloomberg
8 4 (0.87%) CyberArk
8 4 (0.87%) Reuters
8 4 (0.87%) Salesforce
8 4 (0.87%) TOWER Software
9 3 (0.66%) Foundry