DevOps Contracts with Hybrid/Remote/WFH Options

DevOps
UK > Work from Home

The table below provides summary statistics for remote or hybrid contract work requiring DevOps skills. It includes a benchmarking guide to the contractor rates offered in vacancies that cited DevOps over the 6 months leading up to 1 May 2025, comparing them to the same period in the previous two years.

6 months to
1 May 2025
Same period 2024 Same period 2023
Rank 12 16 9
Rank change year-on-year +4 -7 -2
Contract jobs citing DevOps 1,154 1,545 3,245
As % of all contract jobs with a WFH option 11.65% 10.07% 12.55%
As % of the Processes & Methodologies category 12.79% 11.46% 13.97%
Number of daily rates quoted 876 1,102 2,449
10th Percentile £386 £400 £413
25th Percentile £450 £463 £487
Median daily rate (50th Percentile) £530 £550 £575
Median % change year-on-year -3.59% -4.35% -
75th Percentile £650 £650 £675
90th Percentile £788 £713 £750
UK median daily rate £538 £550 £578
% change year-on-year -2.27% -4.76% +0.43%
Number of hourly rates quoted 2 16 34
10th Percentile £66.38 £55.63 £45.77
25th Percentile £66.56 £75.00 £60.00
Median hourly rate £68.75 £87.46 £65.00
Median % change year-on-year -21.39% +34.55% +30.65%
75th Percentile £71.56 £87.53 £65.75
90th Percentile £72.13 - £68.80
UK median hourly rate £71.61 £65.00 £65.50
% change year-on-year +10.17% -0.76% +24.06%

All Process and Methodology Skills
Work from Home

DevOps falls under the Processes and Methodologies category. For comparison with the information above, the following table provides summary statistics for all contract job vacancies with remote or hybrid options requiring process or methodology skills.

Contract vacancies with a requirement for process or methodology skills 9,021 13,483 23,229
As % of all contract jobs with a WFH option 91.08% 87.87% 89.84%
Number of daily rates quoted 6,191 8,996 16,418
10th Percentile £340 £325 £363
25th Percentile £419 £425 £450
Median daily rate (50th Percentile) £525 £525 £540
Median % change year-on-year - -2.78% +2.86%
75th Percentile £638 £638 £650
90th Percentile £763 £750 £750
UK median daily rate £520 £525 £550
% change year-on-year -0.95% -4.55% +4.76%
Number of hourly rates quoted 224 579 532
10th Percentile £14.20 £15.17 £19.00
25th Percentile £19.56 £25.25 £30.54
Median hourly rate £39.52 £43.00 £55.00
Median % change year-on-year -8.09% -21.82% +57.14%
75th Percentile £66.13 £60.00 £68.75
90th Percentile £75.00 £75.25 £80.23
UK median hourly rate £29.00 £35.65 £37.30
% change year-on-year -18.65% -4.42% +49.20%

DevOps
Trend for Jobs with a WFH Option

Job vacancies with remote working options citing DevOps as a proportion of all IT jobs advertised.
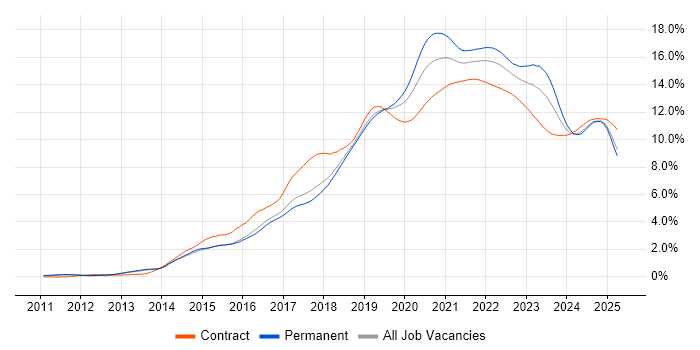
DevOps trend for jobs with Hybrid/Remote/WFH options

DevOps
Daily Rate Trend for Jobs with a WFH Option

3-month moving average daily rate quoted in job vacancies with remote working options citing DevOps.

DevOps daily rate for jobs with a WFH option

DevOps
Daily Rate Histogram for Jobs with a WFH Option

Daily rate distribution for jobs with remote working options citing DevOps over the 6 months to 1 May 2025.

DevOps daily rate histogram for jobs with a WFH option

DevOps
Hourly Rate Trend for Jobs with a WFH Option

3-month moving average hourly rate quoted in job vacancies with remote working options citing DevOps.

DevOps hourly rate for jobs with a WFH option

DevOps
Co-occurring Skills and Capabilities with WFH Options by Category

The follow tables expand on the table above by listing co-occurrences grouped by category. The same employment type, locality and period is covered with up to 20 co-occurrences shown in each of the following categories:

Application Platforms
1 52 (4.51%) Apache Spark
2 49 (4.25%) Apache
3 47 (4.07%) Confluence
4 33 (2.86%) Apache Airflow
5 29 (2.51%) SharePoint
6 19 (1.65%) nginx
7 13 (1.13%) Oracle Coherence
8 10 (0.87%) CMS
8 10 (0.87%) OpenStack
9 8 (0.69%) GemFire
9 8 (0.69%) WordPress
10 7 (0.61%) Microsoft Exchange
11 5 (0.43%) Traefik
12 4 (0.35%) Camunda
12 4 (0.35%) IIS
12 4 (0.35%) JBoss
13 3 (0.26%) ArcGIS
13 3 (0.26%) Headless CMS
13 3 (0.26%) Umbraco
14 2 (0.17%) Anypoint
Applications
1 13 (1.13%) Microsoft Office
2 9 (0.78%) MS Visio
3 8 (0.69%) Trello
4 7 (0.61%) Microsoft Excel
5 5 (0.43%) Microsoft Project
6 1 (0.087%) Acrobat
6 1 (0.087%) InVision
6 1 (0.087%) Notion
6 1 (0.087%) Siemens NX
6 1 (0.087%) Sketch
Business Applications
1 12 (1.04%) Dynamics CRM
2 7 (0.61%) SAP S/4HANA
3 4 (0.35%) NetSuite
3 4 (0.35%) Unit4 Business World
4 3 (0.26%) Payment Gateway
4 3 (0.26%) SAP FSCM
4 3 (0.26%) Unica
5 2 (0.17%) Aladdin
5 2 (0.17%) Endur
5 2 (0.17%) Oracle EBS
5 2 (0.17%) Oracle ERP
5 2 (0.17%) SAP Hybris
6 1 (0.087%) BusinessWorks
6 1 (0.087%) Fidessa
6 1 (0.087%) Oracle Applications
6 1 (0.087%) Oracle Financials
6 1 (0.087%) SAP MM
6 1 (0.087%) SAP R/3
6 1 (0.087%) Summit
6 1 (0.087%) Teamcenter
Cloud Services
1 561 (48.61%) Azure
2 429 (37.18%) AWS
3 351 (30.42%) Azure DevOps
4 163 (14.12%) Serverless
5 116 (10.05%) GitHub
6 107 (9.27%) GCP
7 102 (8.84%) AWS Lambda
8 82 (7.11%) AWS CloudFormation
8 82 (7.11%) Power Platform
9 65 (5.63%) Dynamics 365
10 62 (5.37%) Amazon ECS
11 59 (5.11%) Amazon S3
12 57 (4.94%) GitHub Actions
13 55 (4.77%) OpenShift
14 50 (4.33%) Amazon EC2
15 43 (3.73%) Amazon EKS
16 41 (3.55%) Azure AKS
16 41 (3.55%) PowerApps
17 37 (3.21%) Entra ID
17 37 (3.21%) Power Automate
Communications & Networking
1 48 (4.16%) DNS
2 42 (3.64%) Firewall
3 38 (3.29%) HTTP
4 35 (3.03%) TCP/IP
5 18 (1.56%) SSL
6 14 (1.21%) VPN
7 13 (1.13%) DHCP
7 13 (1.13%) Network Security
8 8 (0.69%) Internet
9 7 (0.61%) SMTP
10 5 (0.43%) FTP
10 5 (0.43%) HTTPS
11 4 (0.35%) Kerberos
11 4 (0.35%) OpenLDAP
11 4 (0.35%) Reverse Proxy
12 3 (0.26%) IPsec
12 3 (0.26%) SAN
12 3 (0.26%) Software-Defined Networking
13 2 (0.17%) BGP
13 2 (0.17%) SNA
Database & Business Intelligence
1 66 (5.72%) PostgreSQL
2 64 (5.55%) Relational Database
3 51 (4.42%) SQL Server
4 45 (3.90%) Power BI
5 43 (3.73%) Amazon Athena
5 43 (3.73%) Amazon RDS
6 41 (3.55%) MongoDB
7 38 (3.29%) NoSQL
8 35 (3.03%) Apache Iceberg
9 34 (2.95%) Data Warehouse
10 30 (2.60%) Dremio
11 28 (2.43%) Apache Arrow
11 28 (2.43%) Apache Ignite
11 28 (2.43%) MySQL
12 26 (2.25%) Amazon Redshift
13 24 (2.08%) Big Data
14 22 (1.91%) Data Lake
14 22 (1.91%) Oracle Database
15 20 (1.73%) Azure SQL Database
15 20 (1.73%) Redis
Development Applications
1 195 (16.90%) Jenkins
2 127 (11.01%) Git
3 126 (10.92%) GitLab
4 124 (10.75%) JIRA
5 33 (2.86%) Selenium
6 32 (2.77%) Artifactory
7 28 (2.43%) Cypress.io
8 27 (2.34%) Postman
9 25 (2.17%) JMeter
9 25 (2.17%) SonarQube
10 22 (1.91%) Bitbucket
11 17 (1.47%) JUnit
12 16 (1.39%) Maven
13 14 (1.21%) Cucumber
13 14 (1.21%) Visual Studio
14 13 (1.13%) REST Assured
14 13 (1.13%) TeamCity
15 12 (1.04%) CircleCI
15 12 (1.04%) Mockito
16 11 (0.95%) Gradle
General
1 277 (24.00%) Social Skills
2 226 (19.58%) Finance
3 145 (12.56%) Public Sector
4 137 (11.87%) Analytical Skills
5 94 (8.15%) Banking
6 52 (4.51%) Front Office
7 48 (4.16%) Investment Banking
8 30 (2.60%) Organisational Skills
9 24 (2.08%) Marketing
9 24 (2.08%) Retail
10 21 (1.82%) Inclusion and Diversity
10 21 (1.82%) Telecoms
11 19 (1.65%) Manufacturing
12 16 (1.39%) Back Office
12 16 (1.39%) Documentation Skills
13 12 (1.04%) Law
14 11 (0.95%) Electronics
15 9 (0.78%) Presentation Skills
16 8 (0.69%) Pharmaceutical
17 6 (0.52%) Financial Institution
Job Titles
1 278 (24.09%) DevOps Engineer
2 273 (23.66%) Developer
3 173 (14.99%) Senior
4 112 (9.71%) AWS Engineer
5 103 (8.93%) Architect
6 99 (8.58%) Lead
7 94 (8.15%) AWS DevOps
8 88 (7.63%) AWS DevOps Engineer
9 72 (6.24%) Azure Engineer
10 69 (5.98%) Senior DevOps
11 66 (5.72%) Data Engineer
12 64 (5.55%) Senior DevOps Engineer
13 52 (4.51%) Python Engineer
14 51 (4.42%) Analyst
15 44 (3.81%) Azure DevOps Engineer
16 40 (3.47%) Consultant
17 39 (3.38%) Senior Developer
18 37 (3.21%) .NET Developer
19 35 (3.03%) C# Developer
19 35 (3.03%) Java Developer
Libraries, Frameworks & Software Standards
1 154 (13.34%) .NET
2 118 (10.23%) Kafka
3 83 (7.19%) REST
4 81 (7.02%) React
5 52 (4.51%) .NET Core
6 47 (4.07%) ASP.NET
7 45 (3.90%) PySpark
8 43 (3.73%) AngularJS
8 43 (3.73%) Web Services
9 41 (3.55%) OAuth
10 39 (3.38%) Node.js
10 39 (3.38%) RESTful
11 38 (3.29%) Elastic Stack
12 37 (3.21%) Spring Boot
13 35 (3.03%) Spring
14 33 (2.86%) CSS
14 33 (2.86%) HTML
15 31 (2.69%) FastAPI
15 31 (2.69%) J2EE
15 31 (2.69%) SOAP
Miscellaneous
1 74 (6.41%) Cloud Native
2 57 (4.94%) Product Ownership
3 26 (2.25%) Legacy Applications
4 22 (1.91%) Foreign Exchange (FX)
5 21 (1.82%) Distributed Systems
5 21 (1.82%) Onboarding
6 20 (1.73%) Enterprise Software
7 16 (1.39%) Public Cloud
8 15 (1.30%) Algorithms
8 15 (1.30%) Greenfield Project
9 13 (1.13%) Hybrid Cloud
9 13 (1.13%) Legacy Systems
10 12 (1.04%) PKI
11 11 (0.95%) Data Centre
12 10 (0.87%) Mainframe
12 10 (0.87%) Mobile App
13 9 (0.78%) Data Structures
13 9 (0.78%) Linux Command Line
13 9 (0.78%) Management Information System
14 8 (0.69%) Self-Motivation
Operating Systems
1 142 (12.31%) Linux
2 59 (5.11%) Windows
3 38 (3.29%) Red Hat Enterprise Linux
3 38 (3.29%) Unix
4 22 (1.91%) Windows Server
5 12 (1.04%) CentOS
6 11 (0.95%) VMS
7 4 (0.35%) Android
7 4 (0.35%) SUSE
8 3 (0.26%) Solaris
8 3 (0.26%) Ubuntu
8 3 (0.26%) zOS
9 1 (0.087%) AIX
9 1 (0.087%) Amazon Linux
9 1 (0.087%) Apple iOS
9 1 (0.087%) Data ONTAP
9 1 (0.087%) Oracle Linux
9 1 (0.087%) VxWorks
9 1 (0.087%) Windows Server 2016
9 1 (0.087%) Windows Server 2019
Processes & Methodologies
1 551 (47.75%) CI/CD
2 520 (45.06%) Agile
3 225 (19.50%) Problem-Solving
4 210 (18.20%) Infrastructure as Code
5 178 (15.42%) Containerisation
6 136 (11.79%) Microservices
7 133 (11.53%) Test Automation
8 129 (11.18%) Software Engineering
9 119 (10.31%) Migration
10 113 (9.79%) Continuous Integration
11 108 (9.36%) Analytics
12 104 (9.01%) Scrum
13 86 (7.45%) Site Reliability Engineering
14 81 (7.02%) Continuous Improvement
15 76 (6.59%) Artificial Intelligence
15 76 (6.59%) TDD
16 75 (6.50%) Stakeholder Management
17 71 (6.15%) Mentoring
18 66 (5.72%) High Availability
19 65 (5.63%) SDLC
Programming Languages
1 379 (32.84%) Python
2 224 (19.41%) SQL
3 199 (17.24%) Java
4 186 (16.12%) C#
5 127 (11.01%) JavaScript
6 125 (10.83%) PowerShell
7 107 (9.27%) Bash
8 87 (7.54%) TypeScript
9 64 (5.55%) Go
10 34 (2.95%) Bicep
11 28 (2.43%) C++
11 28 (2.43%) Shell Script
12 21 (1.82%) PL/SQL
13 16 (1.39%) Ruby
14 15 (1.30%) Scala
15 14 (1.21%) PHP
16 12 (1.04%) T-SQL
17 10 (0.87%) Groovy
17 10 (0.87%) Perl
18 8 (0.69%) VB
Qualifications
1 259 (22.44%) Security Cleared
2 236 (20.45%) SC Cleared
3 86 (7.45%) Degree
4 40 (3.47%) AWS Certification
5 36 (3.12%) Azure Certification
5 36 (3.12%) Computer Science Degree
6 15 (1.30%) Microsoft Certification
6 15 (1.30%) Numerate Degree
7 14 (1.21%) BPSS Clearance
7 14 (1.21%) DV Cleared
8 12 (1.04%) CISSP
9 11 (0.95%) AWS Certified Solutions Architect
9 11 (0.95%) Master's Degree
10 8 (0.69%) TOGAF Certification
11 7 (0.61%) Oracle Certification
12 6 (0.52%) OCP
13 5 (0.43%) CEH
13 5 (0.43%) Cisco Certification
13 5 (0.43%) CISM
13 5 (0.43%) ISTQB
Quality Assurance & Compliance
1 71 (6.15%) QA
2 29 (2.51%) Accessibility
2 29 (2.51%) GDPR
3 16 (1.39%) Data Quality
3 16 (1.39%) NIST
4 12 (1.04%) ISO/IEC 27001
4 12 (1.04%) PCI DSS
5 8 (0.69%) NCSC
6 6 (0.52%) HIPAA
6 6 (0.52%) PMO
6 6 (0.52%) Sarbanes-Oxley
6 6 (0.52%) SOC 2
7 5 (0.43%) WCAG
8 4 (0.35%) SLA
9 3 (0.26%) Disclosure Scotland
9 3 (0.26%) ISO/IEC 27002 (supersedes ISO/IEC 17799)
10 2 (0.17%) Government Security Classifications
10 2 (0.17%) MiFID
10 2 (0.17%) PERC
10 2 (0.17%) Software Quality Assurance
System Software
1 294 (25.48%) Docker
2 40 (3.47%) Active Directory
3 24 (2.08%) Virtual Machines
4 12 (1.04%) VMware Infrastructure
5 8 (0.69%) GridGain
6 4 (0.35%) Apache ZooKeeper
6 4 (0.35%) Virtual Desktop
7 3 (0.26%) RACF
7 3 (0.26%) vSphere
8 2 (0.17%) DFS Replication
8 2 (0.17%) Hyper-V
9 1 (0.087%) HDFS
9 1 (0.087%) KVM
9 1 (0.087%) LXC
9 1 (0.087%) OpenAM
9 1 (0.087%) OpenDJ
9 1 (0.087%) OpenIDM
9 1 (0.087%) Oracle RAC
9 1 (0.087%) Veritas Cluster Server
9 1 (0.087%) VMware ESXi
Systems Management
1 368 (31.89%) Terraform
2 357 (30.94%) Kubernetes
3 152 (13.17%) Ansible
4 70 (6.07%) Grafana
5 60 (5.20%) Prometheus
6 32 (2.77%) Progress Chef
7 31 (2.69%) Puppet
8 21 (1.82%) Packer
9 16 (1.39%) Single Sign-On
10 15 (1.30%) Istio
11 14 (1.21%) Argo
12 12 (1.04%) Consul
13 11 (0.95%) Rancher
14 10 (0.87%) Microsoft Intune
15 9 (0.78%) Kibana
16 8 (0.69%) linkerd
16 8 (0.69%) ZABBIX
17 7 (0.61%) FortiGate
17 7 (0.61%) Jamf Pro
18 6 (0.52%) HAProxy
Vendors
1 157 (13.60%) Microsoft
2 95 (8.23%) Oracle
3 43 (3.73%) Databricks
4 38 (3.29%) SAP
5 37 (3.21%) Splunk
6 34 (2.95%) Google
7 31 (2.69%) Red Hat
8 24 (2.08%) ServiceNow
9 22 (1.91%) Dynatrace
9 22 (1.91%) VMware
10 16 (1.39%) Salesforce
11 13 (1.13%) IBM
12 11 (0.95%) Atlassian
13 9 (0.78%) Okta
14 8 (0.69%) AppDynamics
14 8 (0.69%) MuleSoft
15 7 (0.61%) Cisco
15 7 (0.61%) Citrix
15 7 (0.61%) New Relic
16 5 (0.43%) Murex