Web Services Contracts with Work from Home Options

Web Services
UK > Work from Home

The table below provides summary statistics for contract job vacancies with an option to work from home (WFH) and a requirement for Web Services skills. Included is a benchmarking guide to the contractor rates offered in vacancies that have cited Web Services over the 6 months to 11 May 2024 with a comparison to the same period in the previous 2 years.

6 months to
11 May 2024
Same period 2023 Same period 2022
Rank 127 208 127
Rank change year-on-year +81 -81 -2
Contract jobs citing Web Services 261 301 931
As % of all contract jobs with a WFH option 1.73% 1.20% 2.12%
As % of the Libraries, Frameworks & Software Standards category 7.19% 4.77% 7.15%
Number of daily rates quoted 180 203 630
10th Percentile £412 £415 £381
25th Percentile £463 £463 £450
Median daily rate (50th Percentile) £550 £533 £525
Median % change year-on-year +3.19% +1.52% +10.76%
75th Percentile £638 £638 £631
90th Percentile £688 £738 £688
UK median daily rate £550 £550 £548
% change year-on-year - +0.46% +11.73%
Number of hourly rates quoted 2 2 12
10th Percentile £51.50 £52.58 -
25th Percentile £53.75 £54.56 £48.50
Median hourly rate £60.00 £59.75 £60.00
Median % change year-on-year +0.42% -0.42% +50.00%
75th Percentile £63.75 £65.56 £62.15
90th Percentile £64.50 £67.93 £63.14
UK median hourly rate £65.00 £72.50 £63.25
% change year-on-year -10.34% +14.62% +58.13%

All Software Libraries and Frameworks
Work from Home

Web Services is in the Software Libraries and Frameworks category. The following table is for comparison with the above and provides summary statistics for all contract job vacancies with a WFH option and a requirement for technical specification, industry standards, software libraries and framework skills.

Contract vacancies with a requirement for technical specification, industry standards, software libraries and framework skills 3,628 6,313 13,029
As % of all contract jobs with a WFH option 24.11% 25.22% 29.65%
Number of daily rates quoted 2,541 4,697 9,602
10th Percentile £335 £400 £400
25th Percentile £430 £450 £450
Median daily rate (50th Percentile) £525 £540 £550
Median % change year-on-year -2.78% -1.82% +12.82%
75th Percentile £650 £656 £642
90th Percentile £788 £750 £738
UK median daily rate £534 £550 £550
% change year-on-year -2.91% - +10.00%
Number of hourly rates quoted 93 81 124
10th Percentile £24.45 £22.50 £21.30
25th Percentile - £43.63 £35.00
Median hourly rate £43.00 £62.50 £50.00
Median % change year-on-year -31.20% +25.00% +11.11%
75th Percentile £62.00 £75.00 £65.25
90th Percentile £72.50 £80.25 £75.00
UK median hourly rate £47.50 £65.00 £50.00
% change year-on-year -26.92% +30.00% +11.11%

Web Services
Trend for Jobs with a WFH Option

Job vacancies with a work from home option citing Web Services as a proportion of all IT jobs advertised.
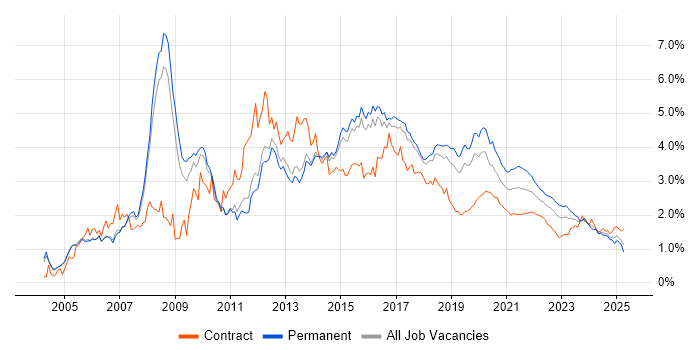
Web Services trend for jobs with a WFH option

Web Services
Daily Rate Trend for Jobs with a WFH Option

3-month moving average daily rate quoted in job vacancies with a work from home option citing Web Services.

Web Services daily rate for jobs with a WFH option

Web Services
Daily Rate Histogram for Jobs with a WFH Option

Daily rate distribution for jobs with a work from home option citing Web Services over the 6 months to 11 May 2024.

Web Services daily rate histogram for jobs with a WFH option

Web Services
Hourly Rate Trend for Jobs with a WFH Option

3-month moving average hourly rate quoted in job vacancies with a work from home option citing Web Services.

Web Services hourly rate for jobs with a WFH option

Web Services
Co-occurring Skills and Capabilities with WFH Options by Category

The follow tables expand on the table above by listing co-occurrences grouped by category. The same employment type, locality and period is covered with up to 20 co-occurrences shown in each of the following categories:

Application Platforms
1 7 (2.68%) Confluence
1 7 (2.68%) Oracle Workflow
1 7 (2.68%) WebSphere
2 6 (2.30%) Apache
2 6 (2.30%) Mule
2 6 (2.30%) WebLogic
3 5 (1.92%) Anypoint
3 5 (1.92%) IIS
3 5 (1.92%) Mule ESB
4 4 (1.53%) Oracle SOA Suite
5 3 (1.15%) Adobe Experience Manager
5 3 (1.15%) WordPress
6 2 (0.77%) Apache Spark
6 2 (0.77%) SharePoint
6 2 (0.77%) Tomcat
7 1 (0.38%) Appian
7 1 (0.38%) CMS
7 1 (0.38%) GeoServer
7 1 (0.38%) Headless CMS
7 1 (0.38%) OpenStack
Applications
1 8 (3.07%) MS Visio
2 6 (2.30%) Chatbot
3 1 (0.38%) CATIA
Business Applications
1 4 (1.53%) SAP EWM
1 4 (1.53%) SAP S/4HANA
1 4 (1.53%) Shopify
1 4 (1.53%) Temenos T24
2 2 (0.77%) Dynamics CRM
3 1 (0.38%) NetSuite
3 1 (0.38%) SAP SCM
Cloud Services
1 95 (36.40%) Azure
2 78 (29.89%) AWS
3 18 (6.90%) GitHub
4 12 (4.60%) Azure DevOps
5 10 (3.83%) WhatsApp
6 9 (3.45%) GCP
6 9 (3.45%) Serverless
7 8 (3.07%) Power Platform
8 7 (2.68%) Cloud Computing
8 7 (2.68%) Twilio
9 5 (1.92%) Power Automate
9 5 (1.92%) PowerApps
9 5 (1.92%) SaaS
10 4 (1.53%) Amazon EC2
10 4 (1.53%) Amazon ECS
10 4 (1.53%) Apigee
10 4 (1.53%) Azure API Management
10 4 (1.53%) Azure Logic Apps
10 4 (1.53%) Dynamics 365
10 4 (1.53%) Kong
Communications & Networking
1 34 (13.03%) SSL
2 10 (3.83%) VoIP
3 7 (2.68%) CTI
4 4 (1.53%) LAN
4 4 (1.53%) TCP/IP
4 4 (1.53%) VPN
4 4 (1.53%) WAN
5 3 (1.15%) Cisco Nexus
5 3 (1.15%) Internet
5 3 (1.15%) MPLS
5 3 (1.15%) PBX
5 3 (1.15%) WLAN
6 2 (0.77%) HTTP
6 2 (0.77%) Network Security
7 1 (0.38%) DNS
7 1 (0.38%) Ethernet
7 1 (0.38%) Firewall
7 1 (0.38%) FTP
7 1 (0.38%) PPP
7 1 (0.38%) SAN
Database & Business Intelligence
1 30 (11.49%) MySQL
1 30 (11.49%) SQL Server
2 15 (5.75%) Oracle Reports
3 13 (4.98%) Relational Database
4 12 (4.60%) NoSQL
5 10 (3.83%) Oracle Database
6 8 (3.07%) Data Warehouse
6 8 (3.07%) MongoDB
6 8 (3.07%) PostgreSQL
7 7 (2.68%) OLTP
8 5 (1.92%) Power BI
8 5 (1.92%) SAP HANA
8 5 (1.92%) Siebel EIM
9 4 (1.53%) Big Data
9 4 (1.53%) OLAP
9 4 (1.53%) Oracle OLAP
10 3 (1.15%) Azure SQL Database
10 3 (1.15%) Data Lake
10 3 (1.15%) DB2
11 2 (0.77%) Tableau
Development Applications
1 29 (11.11%) Git
2 18 (6.90%) JIRA
3 17 (6.51%) Jenkins
4 11 (4.21%) Selenium
5 8 (3.07%) Eclipse
6 6 (2.30%) Maven
7 5 (1.92%) Cucumber
7 5 (1.92%) SonarQube
8 4 (1.53%) Sonatype Nexus
9 3 (1.15%) Bitbucket
9 3 (1.15%) GitLab
9 3 (1.15%) HP UFT
9 3 (1.15%) JUnit
9 3 (1.15%) Katalon Studio
9 3 (1.15%) SoapUI
9 3 (1.15%) Visual Studio
9 3 (1.15%) Visual Studio Team System
10 2 (0.77%) JMeter
10 2 (0.77%) TeamCity
10 2 (0.77%) TestNG
General
1 67 (25.67%) Social Skills
2 57 (21.84%) Finance
3 25 (9.58%) Analytical Skills
3 25 (9.58%) Banking
4 22 (8.43%) Public Sector
5 11 (4.21%) Retail
5 11 (4.21%) Telecoms
6 10 (3.83%) Financial Institution
7 9 (3.45%) Presentation Skills
8 7 (2.68%) Pharmaceutical
9 6 (2.30%) Billing
9 6 (2.30%) Marketing
10 5 (1.92%) Manufacturing
11 3 (1.15%) Tech for Good
12 2 (0.77%) Influencing Skills
12 2 (0.77%) Investment Banking
13 1 (0.38%) Documentation Skills
13 1 (0.38%) Inclusion and Diversity
13 1 (0.38%) Legal
13 1 (0.38%) Military
Job Titles
1 111 (42.53%) Developer
2 65 (24.90%) Architect
3 27 (10.34%) Consultant
4 25 (9.58%) Senior
5 18 (6.90%) Senior Developer
6 17 (6.51%) ServiceNow Developer
7 16 (6.13%) Lead
8 13 (4.98%) Software Engineer
9 12 (4.60%) Solutions Architect
10 11 (4.21%) Full Stack Developer
10 11 (4.21%) Java Developer
11 10 (3.83%) .NET Developer
11 10 (3.83%) Analyst
11 10 (3.83%) SailPoint Developer
11 10 (3.83%) ServiceNow Consultant
12 9 (3.45%) Technical Consultant
13 8 (3.07%) Business Analyst
14 7 (2.68%) C# Developer
14 7 (2.68%) Lead Developer
14 7 (2.68%) SailPoint Consultant
Libraries, Frameworks & Software Standards
1 58 (22.22%) REST
2 48 (18.39%) HTML
3 43 (16.48%) .NET
4 42 (16.09%) SOAP
5 33 (12.64%) CSS
5 33 (12.64%) XML
6 29 (11.11%) RESTful
7 27 (10.34%) Spring
8 24 (9.20%) LDAP
9 23 (8.81%) SailPoint
10 22 (8.43%) Node.js
11 20 (7.66%) Spring Boot
12 19 (7.28%) ASP.NET
13 18 (6.90%) JSP
13 18 (6.90%) Servlets
14 17 (6.51%) AngularJS
14 17 (6.51%) JSON
15 16 (6.13%) jQuery
16 15 (5.75%) JDBC
16 15 (5.75%) SPML
Miscellaneous
1 35 (13.41%) PKI
2 16 (6.13%) Onboarding
3 10 (3.83%) Management Information System
4 9 (3.45%) Distributed Systems
5 8 (3.07%) Mobile App
6 7 (2.68%) IVR
7 6 (2.30%) Data Centre
8 4 (1.53%) CMDB
8 4 (1.53%) DataPower
8 4 (1.53%) Product Ownership
9 3 (1.15%) Greenfield Project
9 3 (1.15%) Hedge funds
9 3 (1.15%) IoT
9 3 (1.15%) Life Science
9 3 (1.15%) Linux Command Line
10 2 (0.77%) Cloud Native
10 2 (0.77%) Derivative
10 2 (0.77%) Distributed Applications
10 2 (0.77%) Foreign Exchange (FX)
10 2 (0.77%) Legacy Applications
Operating Systems
1 27 (10.34%) Linux
2 10 (3.83%) Android
3 9 (3.45%) Apple iOS
4 8 (3.07%) Windows
5 3 (1.15%) Unix
6 2 (0.77%) Windows Server 2016
7 1 (0.38%) Embedded Linux
7 1 (0.38%) Red Hat Enterprise Linux
7 1 (0.38%) Ubuntu
7 1 (0.38%) Windows Server
Processes & Methodologies
1 65 (24.90%) Agile
2 37 (14.18%) DevOps
3 36 (13.79%) Cryptography
4 35 (13.41%) Key Management
5 32 (12.26%) Test Automation
6 31 (11.88%) Problem-Solving
7 28 (10.73%) ITSM
8 27 (10.34%) Service Management
9 26 (9.96%) Service Delivery
10 25 (9.58%) CI/CD
10 25 (9.58%) Customer Service
11 24 (9.20%) Microservices
11 24 (9.20%) Scrum
11 24 (9.20%) Software Engineering
12 23 (8.81%) Asset Management
13 22 (8.43%) OO
14 21 (8.05%) IT Asset Management
14 21 (8.05%) Operations Management
15 20 (7.66%) Analytics
15 20 (7.66%) MVC
Programming Languages
1 82 (31.42%) Java
2 67 (25.67%) JavaScript
3 52 (19.92%) SQL
4 40 (15.33%) C#
5 13 (4.98%) Python
6 10 (3.83%) Scala
7 7 (2.68%) PowerShell
8 5 (1.92%) ABAP
9 4 (1.53%) C++
9 4 (1.53%) Ruby
9 4 (1.53%) TypeScript
10 3 (1.15%) Apex Code
11 2 (0.77%) Go
11 2 (0.77%) PHP
11 2 (0.77%) PL/SQL
11 2 (0.77%) Shell Script
12 1 (0.38%) Bicep
12 1 (0.38%) DataFlex
12 1 (0.38%) T-SQL
12 1 (0.38%) XPath
Qualifications
1 66 (25.29%) Security Cleared
2 53 (20.31%) Degree
3 50 (19.16%) SC Cleared
4 20 (7.66%) DV Cleared
5 13 (4.98%) Computer Science Degree
6 9 (3.45%) BPSS Clearance
6 9 (3.45%) Master's Degree
7 6 (2.30%) Azure Certification
7 6 (2.30%) Cisco Certification
7 6 (2.30%) ISTQB
8 5 (1.92%) AWS Certification
8 5 (1.92%) AWS Certified Solutions Architect
8 5 (1.92%) Microsoft Certification
9 3 (1.15%) (ISC)2 CCSP
9 3 (1.15%) CCIE
9 3 (1.15%) CCIE Data Center
9 3 (1.15%) CCNP
9 3 (1.15%) CISSP
9 3 (1.15%) SANS
10 2 (0.77%) ISEB
Quality Assurance & Compliance
1 16 (6.13%) QA
2 8 (3.07%) Accessibility
3 4 (1.53%) GDPR
3 4 (1.53%) HIPAA
3 4 (1.53%) PCI DSS
3 4 (1.53%) SOC 2
4 3 (1.15%) GRC
4 3 (1.15%) WCAG
5 2 (0.77%) Actionable Recommendations
5 2 (0.77%) HL7
5 2 (0.77%) SLA
6 1 (0.38%) Data Quality
6 1 (0.38%) Disclosure Scotland
6 1 (0.38%) ISO/IEC 27001
System Software
1 56 (21.46%) Active Directory
2 15 (5.75%) ACF2
2 15 (5.75%) IAG
2 15 (5.75%) RACF
3 13 (4.98%) Docker
4 2 (0.77%) Hyper-V
4 2 (0.77%) VMware Infrastructure
5 1 (0.38%) Virtual Machines
Systems Management
1 10 (3.83%) Kubernetes
2 9 (3.45%) Terraform
3 5 (1.92%) CloudHub
4 4 (1.53%) Single Sign-On
5 3 (1.15%) Grafana
6 2 (0.77%) Ansible
6 2 (0.77%) Kibana
7 1 (0.38%) Forefront Identity Manager
7 1 (0.38%) logstash
7 1 (0.38%) Prometheus
Vendors
1 49 (18.77%) ServiceNow
2 44 (16.86%) Oracle
3 27 (10.34%) Microsoft
4 15 (5.75%) SAP
4 15 (5.75%) Sybase
5 12 (4.60%) Google
6 10 (3.83%) Cisco
6 10 (3.83%) Salesforce
7 9 (3.45%) Adobe
7 9 (3.45%) Genesys
8 8 (3.07%) Guidewire
8 8 (3.07%) IBM
9 7 (2.68%) Avaya
10 5 (1.92%) CA Agile Central
10 5 (1.92%) MuleSoft
10 5 (1.92%) Siebel
11 4 (1.53%) CyberArk
11 4 (1.53%) TSYS
12 3 (1.15%) Atlassian
12 3 (1.15%) Splunk