VMware Contracts with Hybrid/Remote/WFH Options

VMware
UK > Work from Home

The table below provides summary statistics for remote or hybrid contract work requiring knowledge or experience of VMware products and/or services. It includes a benchmarking guide to contractor rates offered in vacancies that cited VMware over the 6 months leading up to 1 May 2025, comparing them to the same period in the previous two years.

The figures below represent the IT contractor job market in general and are not representative of contractor rates within VMware, Inc.

6 months to
1 May 2025
Same period 2024 Same period 2023
Rank 95 100 67
Rank change year-on-year +5 -33 +31
Contract jobs citing VMware 261 338 878
As % of all contract jobs with a WFH option 2.64% 2.20% 3.40%
As % of the Vendors category 5.75% 5.20% 7.89%
Number of daily rates quoted 189 225 609
10th Percentile £363 £308 £350
25th Percentile £415 £408 £420
Median daily rate (50th Percentile) £525 £500 £520
Median % change year-on-year +5.00% -3.85% +15.56%
75th Percentile £603 £575 £600
90th Percentile £675 £650 £676
UK median daily rate £533 £500 £525
% change year-on-year +6.63% -4.76% +10.53%
Number of hourly rates quoted 2 8 50
10th Percentile £65.63 £37.63 £47.50
25th Percentile £66.56 £44.20 £58.50
Median hourly rate £68.75 £56.50 £66.00
Median % change year-on-year +21.68% -14.39% +8.34%
75th Percentile £71.56 £66.63 £80.25
90th Percentile £72.88 £81.25 £87.50
UK median hourly rate £72.50 £48.20 £65.00
% change year-on-year +50.43% -25.85% +36.84%

All Vendors
Work from Home

VMware falls under the Vendor Products and Services category. For comparison with the information above, the following table provides summary statistics for all contract job vacancies with a remote or hybrid options requiring knowledge or experience of all vendor products and services.

Contract vacancies with a requirement for knowledge or experience of vendor products and services 4,540 6,506 11,129
As % of all contract jobs with a WFH option 45.84% 42.40% 43.04%
Number of daily rates quoted 2,959 4,024 7,488
10th Percentile £325 £325 £330
25th Percentile £413 £425 £425
Median daily rate (50th Percentile) £525 £525 £525
Median % change year-on-year -0.10% - -
75th Percentile £625 £625 £650
90th Percentile £738 £725 £750
UK median daily rate £515 £517 £525
% change year-on-year -0.39% -1.52% -
Number of hourly rates quoted 120 220 258
10th Percentile £14.20 £13.92 £17.87
25th Percentile £19.56 £16.93 £31.81
Median hourly rate £47.25 £32.31 £54.50
Median % change year-on-year +46.25% -40.72% +55.71%
75th Percentile £68.00 £60.00 £68.75
90th Percentile £86.00 £72.50 £80.25
UK median hourly rate £26.45 £22.30 £43.75
% change year-on-year +18.61% -49.03% +108.14%

VMware
Trend for Jobs with a WFH Option

Job vacancies with remote working options citing VMware as a proportion of all IT jobs advertised.
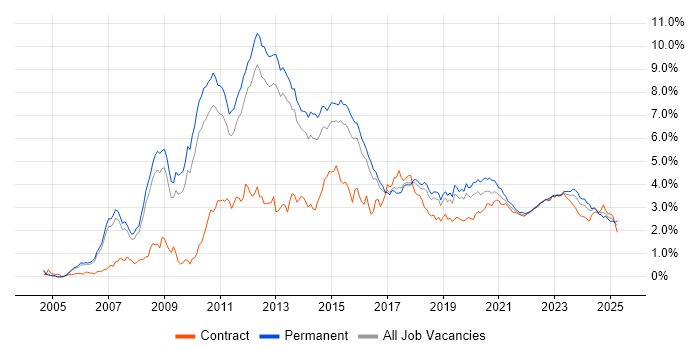
VMware trend for jobs with Hybrid/Remote/WFH options

VMware
Daily Rate Trend for Jobs with a WFH Option

3-month moving average daily rate quoted in job vacancies with remote working options citing VMware.

VMware daily rate for jobs with a WFH option

VMware
Daily Rate Histogram for Jobs with a WFH Option

Daily rate distribution for jobs with remote working options citing VMware over the 6 months to 1 May 2025.

VMware daily rate histogram for jobs with a WFH option

VMware
Hourly Rate Trend for Jobs with a WFH Option

3-month moving average hourly rate quoted in job vacancies with remote working options citing VMware.

VMware hourly rate for jobs with a WFH option

VMware
Co-occurring Skills and Capabilities with WFH Options by Category

The follow tables expand on the table above by listing co-occurrences grouped by category. The same employment type, locality and period is covered with up to 20 co-occurrences shown in each of the following categories:

Application Platforms
1 25 (9.58%) Microsoft Exchange
2 18 (6.90%) SharePoint
3 15 (5.75%) Confluence
4 5 (1.92%) IIS
4 5 (1.92%) OpenStack
5 3 (1.15%) Skype for Business
6 2 (0.77%) Apache
6 2 (0.77%) Tomcat
7 1 (0.38%) Blackberry Enterprise Server
7 1 (0.38%) CMS
7 1 (0.38%) Exchange Server 2013
7 1 (0.38%) nginx
Applications
1 15 (5.75%) Microsoft Office
2 2 (0.77%) Weka
Business Applications
1 1 (0.38%) Distributed Ledger
1 1 (0.38%) SAP ERP
Cloud Services
1 84 (32.18%) Azure
2 45 (17.24%) AWS
3 40 (15.33%) Microsoft 365
4 21 (8.05%) Entra ID
5 20 (7.66%) IaaS
6 11 (4.21%) PaaS
6 11 (4.21%) SaaS
7 9 (3.45%) OpenShift
8 8 (3.07%) GCP
9 6 (2.30%) GitHub
9 6 (2.30%) Nutanix
10 4 (1.53%) Cloud Computing
10 4 (1.53%) Rubrik
11 3 (1.15%) Amazon EC2
11 3 (1.15%) AWS CloudFormation
11 3 (1.15%) Azure ExpressRoute
12 2 (0.77%) Azure DevOps
12 2 (0.77%) Cohesity
12 2 (0.77%) Mimecast
12 2 (0.77%) Power Platform
Communications & Networking
1 51 (19.54%) DNS
2 45 (17.24%) Firewall
3 42 (16.09%) DHCP
4 21 (8.05%) TCP/IP
5 16 (6.13%) VSAN
6 15 (5.75%) Network Security
6 15 (5.75%) VPN
7 13 (4.98%) SAN
8 11 (4.21%) Intrusion Detection
8 11 (4.21%) WAN
9 9 (3.45%) SD-WAN
10 7 (2.68%) LAN
11 6 (2.30%) BGP
11 6 (2.30%) MPLS
11 6 (2.30%) OSPF
12 5 (1.92%) Cisco Nexus
12 5 (1.92%) NX-OS
12 5 (1.92%) SMTP
13 4 (1.53%) Skype
13 4 (1.53%) VLAN
Database & Business Intelligence
1 18 (6.90%) SQL Server
2 8 (3.07%) Oracle Database
3 6 (2.30%) MongoDB
4 5 (1.92%) Amazon RDS
5 4 (1.53%) NoSQL
6 3 (1.15%) Amazon Aurora
6 3 (1.15%) Couchbase
6 3 (1.15%) Data Warehouse
6 3 (1.15%) Elasticsearch
6 3 (1.15%) OLTP
6 3 (1.15%) PostgreSQL
6 3 (1.15%) Relational Database
7 2 (0.77%) MariaDB
7 2 (0.77%) Power BI
8 1 (0.38%) Azure SQL Database
8 1 (0.38%) MySQL
8 1 (0.38%) Redis
8 1 (0.38%) Sybase ASE
8 1 (0.38%) Tableau
Development Applications
1 17 (6.51%) JIRA
2 10 (3.83%) Git
3 5 (1.92%) GitLab
4 4 (1.53%) Jenkins
5 3 (1.15%) Bitbucket
6 2 (0.77%) Sonatype Nexus
7 1 (0.38%) Introscope
7 1 (0.38%) LoadRunner
7 1 (0.38%) Postman
7 1 (0.38%) SonarQube
7 1 (0.38%) TeamCity
General
1 58 (22.22%) Social Skills
2 30 (11.49%) Finance
3 29 (11.11%) Public Sector
4 16 (6.13%) Analytical Skills
5 10 (3.83%) Telecoms
6 9 (3.45%) Inclusion and Diversity
7 7 (2.68%) Documentation Skills
8 6 (2.30%) Banking
8 6 (2.30%) Organisational Skills
9 5 (1.92%) Law
10 3 (1.15%) Presentation Skills
11 2 (0.77%) Influencing Skills
11 2 (0.77%) Investment Banking
11 2 (0.77%) Legal
11 2 (0.77%) Retail
12 1 (0.38%) Aerospace
12 1 (0.38%) Financial Institution
Job Titles
1 58 (22.22%) Architect
2 37 (14.18%) Infrastructure Engineer
3 22 (8.43%) Senior
4 18 (6.90%) Technical Architect
5 17 (6.51%) Lead
6 15 (5.75%) Consultant
7 14 (5.36%) Linux Engineer
8 12 (4.60%) Infrastructure Architect
8 12 (4.60%) Solutions Architect
8 12 (4.60%) Virtualisation Engineer
9 10 (3.83%) Senior Architect
9 10 (3.83%) Senior Technical Architect
10 9 (3.45%) Administrator
10 9 (3.45%) VMware Engineer
11 8 (3.07%) IT Engineer
11 8 (3.07%) Systems Engineer
11 8 (3.07%) Windows Engineer
12 7 (2.68%) Infrastructure Specialist
12 7 (2.68%) Microsoft 365 Engineer
12 7 (2.68%) Network Engineer
Libraries, Frameworks & Software Standards
1 10 (3.83%) Flash
2 8 (3.07%) Kafka
3 4 (1.53%) Elastic Stack
3 4 (1.53%) LDAP
4 3 (1.15%) REST
5 2 (0.77%) HTML
5 2 (0.77%) Loki
5 2 (0.77%) Middleware
6 1 (0.38%) .NET
6 1 (0.38%) CSS
6 1 (0.38%) J2EE
6 1 (0.38%) Node.js
6 1 (0.38%) RabbitMQ
6 1 (0.38%) SAML
6 1 (0.38%) SOAP
6 1 (0.38%) Web Services
6 1 (0.38%) WF
Miscellaneous
1 43 (16.48%) Data Centre
2 19 (7.28%) Hybrid Cloud
3 15 (5.75%) Clustering
4 12 (4.60%) Data Protection Act
4 12 (4.60%) PKI
5 11 (4.21%) Private Cloud
6 10 (3.83%) Product Ownership
7 8 (3.07%) Enterprise Storage
8 7 (2.68%) Public Cloud
8 7 (2.68%) Replication
9 6 (2.30%) Cyber Threat
10 5 (1.92%) Cloud Native
10 5 (1.92%) Operational Technology
11 4 (1.53%) Enterprise Software
11 4 (1.53%) Onboarding
11 4 (1.53%) SCADA
12 3 (1.15%) Blackberry
12 3 (1.15%) iPad
13 2 (0.77%) Driving Licence
13 2 (0.77%) Wiki
Operating Systems
1 105 (40.23%) Windows
2 82 (31.42%) Linux
3 61 (23.37%) Windows Server
4 28 (10.73%) Red Hat Enterprise Linux
5 17 (6.51%) Unix
5 17 (6.51%) Windows Server 2019
6 12 (4.60%) Windows Server 2016
7 10 (3.83%) AIX
8 9 (3.45%) Windows Server 2012
9 8 (3.07%) VMS
10 5 (1.92%) Amazon Linux
10 5 (1.92%) Windows 10
11 4 (1.53%) CentOS
12 3 (1.15%) Solaris
12 3 (1.15%) Ubuntu
13 2 (0.77%) SUSE
13 2 (0.77%) Windows 7
13 2 (0.77%) Windows Server 2003
13 2 (0.77%) Windows XP
14 1 (0.38%) Windows Server 2008
Processes & Methodologies
1 62 (23.75%) Infrastructure Engineering
2 46 (17.62%) Migration
3 43 (16.48%) ITIL
4 33 (12.64%) Agile
5 30 (11.49%) High Availability
5 30 (11.49%) Problem-Solving
6 29 (11.11%) Infrastructure as Code
7 22 (8.43%) DevOps
8 21 (8.05%) Service Management
9 20 (7.66%) CI/CD
9 20 (7.66%) Containerisation
9 20 (7.66%) Roadmaps
10 17 (6.51%) Disaster Recovery
11 16 (6.13%) Cybersecurity
11 16 (6.13%) Network Virtualisation
11 16 (6.13%) Technical Leadership
12 14 (5.36%) Configuration Management
12 14 (5.36%) Data Protection
12 14 (5.36%) DevSecOps
12 14 (5.36%) Root Cause Analysis
Programming Languages
1 34 (13.03%) PowerShell
2 32 (12.26%) Python
3 19 (7.28%) Bash
4 11 (4.21%) SQL
5 7 (2.68%) Java
6 5 (1.92%) Shell Script
7 3 (1.15%) Scala
8 2 (0.77%) C
8 2 (0.77%) JavaScript
8 2 (0.77%) Perl
8 2 (0.77%) VBScript
9 1 (0.38%) C#
9 1 (0.38%) Go
Qualifications
1 96 (36.78%) Security Cleared
2 80 (30.65%) SC Cleared
3 25 (9.58%) VMware Certified Professional (VCP)
4 21 (8.05%) Cisco Certification
5 17 (6.51%) DV Cleared
6 15 (5.75%) CCNA
6 15 (5.75%) Microsoft Certification
7 14 (5.36%) Degree
8 10 (3.83%) Master's Degree
9 8 (3.07%) CCNP
9 8 (3.07%) MCSE
10 6 (2.30%) Azure Certification
11 4 (1.53%) CCIE
12 3 (1.15%) AWS Certification
12 3 (1.15%) MCP
12 3 (1.15%) RHCSA
12 3 (1.15%) VCAP
13 2 (0.77%) CISSP
13 2 (0.77%) ITIL Certification
13 2 (0.77%) OCA
Quality Assurance & Compliance
1 13 (4.98%) NIST
2 9 (3.45%) Cyber Essentials
2 9 (3.45%) NCSC
3 7 (2.68%) SLA
4 3 (1.15%) GDPR
5 2 (0.77%) Def Stans
5 2 (0.77%) Disclosure Scotland
5 2 (0.77%) HIPAA
5 2 (0.77%) PCI DSS
5 2 (0.77%) QA
6 1 (0.38%) Government Security Classifications
6 1 (0.38%) HMG Security Policy Framework
6 1 (0.38%) PMO
6 1 (0.38%) Sarbanes-Oxley
System Software
1 158 (60.54%) VMware Infrastructure
2 81 (31.03%) Active Directory
3 42 (16.09%) VMware NSX
4 40 (15.33%) VMware ESXi
5 29 (11.11%) vSphere
6 26 (9.96%) Hyper-V
7 17 (6.51%) Docker
8 13 (4.98%) Virtual Machines
9 3 (1.15%) DFS Replication
9 3 (1.15%) NFS
9 3 (1.15%) Veritas Cluster Server
9 3 (1.15%) Virtual Servers
9 3 (1.15%) XenDesktop
10 2 (0.77%) Apache ZooKeeper
10 2 (0.77%) Samba
10 2 (0.77%) Slurm Workload Manager
10 2 (0.77%) XenApp
11 1 (0.38%) BitLocker
11 1 (0.38%) VMware Server
Systems Management
1 52 (19.92%) Ansible
2 30 (11.49%) Terraform
3 28 (10.73%) vCenter Server
4 23 (8.81%) Kubernetes
4 23 (8.81%) Microsoft Intune
5 14 (5.36%) Progress Chef
5 14 (5.36%) SCCM
6 11 (4.21%) WSUS
7 8 (3.07%) Puppet
8 7 (2.68%) Prometheus
9 6 (2.30%) FortiGate
9 6 (2.30%) NetBackup
9 6 (2.30%) vRealize Orchestrator
10 5 (1.92%) Grafana
10 5 (1.92%) PowerCLI
11 4 (1.53%) Tivoli
11 4 (1.53%) Tivoli Storage Manager
11 4 (1.53%) vRealize
12 3 (1.15%) Nagios
12 3 (1.15%) yum
Vendors
1 71 (27.20%) Microsoft
2 52 (19.92%) Cisco
3 33 (12.64%) Red Hat
4 16 (6.13%) Oracle
5 13 (4.98%) HP
6 12 (4.60%) Dell
6 12 (4.60%) Palo Alto
7 11 (4.21%) Atlassian
7 11 (4.21%) SolarWinds
8 10 (3.83%) Fortinet
8 10 (3.83%) NetApp
9 9 (3.45%) Broadcom
9 9 (3.45%) Citrix
9 9 (3.45%) Splunk
9 9 (3.45%) Veritas
10 8 (3.07%) IBM
11 6 (2.30%) F5
11 6 (2.30%) Google
12 5 (1.92%) ServiceNow
12 5 (1.92%) Veeam