Technical Consultant Contracts with Work from Home Options

Technical Consultant
UK > Work from Home

The median Technical Consultant daily rate in Work from Home is £550 according to job vacancies posted during the 6 months to 24 April 2024.

The first table below provides contractor rate benchmarking and summary statistics including a comparison to same period in the previous 2 years.

6 months to
24 Apr 2024
Same period 2023 Same period 2022
Rank 276 359 494
Rank change year-on-year +83 +135 -169
Contract jobs requiring a Technical Consultant 70 110 126
As % of all contract jobs with a WFH option 0.45% 0.42% 0.28%
As % of the Job Titles category 0.48% 0.44% 0.29%
Number of daily rates quoted 42 55 73
10th Percentile £463 £433 £400
25th Percentile £500 £500 £488
Median daily rate (50th Percentile) £550 £550 £525
Median % change year-on-year - +4.76% +5.00%
75th Percentile £625 £619 £600
90th Percentile £815 £663 £685
UK median daily rate £550 £556 £550
% change year-on-year -1.12% +1.14% +10.00%
Number of hourly rates quoted 0 3 6
10th Percentile - - £58.50
25th Percentile - - £63.00
Median hourly rate - £66.00 £64.50
Median % change year-on-year - +2.33% +3.61%
75th Percentile - £75.00 £66.00
90th Percentile - £80.40 -
UK median hourly rate £61.60 £66.00 £66.00
% change year-on-year -6.67% - +5.60%

All Contract IT Job Vacancies
Work from Home

The following table is for comparison with the above and includes summary statistics for all contract IT job vacancies with a WFH option. Most job vacancies include a discernible job title that can be normalized. As such, the figures in the second row provide an indication of the number of contract jobs in our overall sample.

Contract vacancies in Work from Home with a recognized job title 14,459 24,892 42,839
% of contract IT jobs with a recognized job title 93.53% 95.28% 95.76%
Number of daily rates quoted 9,665 17,565 30,928
10th Percentile £325 £358 £356
25th Percentile £425 £445 £425
Median daily rate (50th Percentile) £525 £540 £525
Median % change year-on-year -2.78% +2.86% +10.53%
75th Percentile £638 £650 £625
90th Percentile £745 £750 £713
UK median daily rate £525 £540 £525
% change year-on-year -2.78% +2.86% +10.53%
Number of hourly rates quoted 561 589 610
10th Percentile £14.27 £18.50 £12.88
25th Percentile £22.50 £27.73 £18.75
Median hourly rate £43.00 £55.00 £35.00
Median % change year-on-year -21.82% +57.14% +40.00%
75th Percentile £62.00 £68.75 £55.00
90th Percentile £75.25 £80.25 £66.00
UK median hourly rate £35.50 £45.00 £23.00
% change year-on-year -21.11% +95.65% +1.41%

Technical Consultant
Trend for Jobs with a WFH Option

Job vacancies with a work from home option which featured Technical Consultant in the job title as a proportion of all IT jobs advertised.
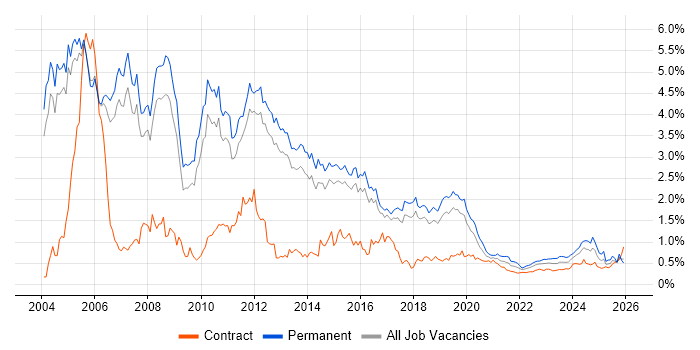
Technical Consultant trend for jobs with a WFH option

Technical Consultant
Daily Rate Trend for Jobs with a WFH Option

3-month moving average daily rate quoted in job vacancies with a work from home option citing Technical Consultant.

Technical Consultant daily rate for jobs with a WFH option

Technical Consultant
Daily Rate Histogram for Jobs with a WFH Option

Daily rate distribution for jobs with a work from home option citing Technical Consultant over the 6 months to 24 April 2024.

Technical Consultant daily rate histogram for jobs with a WFH option

Technical Consultant
Hourly Rate Trend for Jobs with a WFH Option

3-month moving average hourly rate quoted in job vacancies with a work from home option citing Technical Consultant.

Technical Consultant hourly rate for jobs with a WFH option

Technical Consultant Skill Set
Top 30 Co-occurring Skills and Capabilities in Job Vacancies with WFH Options

For the 6 months to 24 April 2024, Technical Consultant contract job roles required the following skills and capabilities in order of popularity. The figures indicate the absolute number co-occurrences and as a proportion of all contract jobs with a WFH option featuring Technical Consultant in the job title.

1 14 (20.00%) Social Skills
2 13 (18.57%) SAP
3 11 (15.71%) SC Cleared
3 11 (15.71%) Security Cleared
3 11 (15.71%) Roadmaps
4 10 (14.29%) Azure
5 9 (12.86%) AWS
5 9 (12.86%) GCP
5 9 (12.86%) Finance
5 9 (12.86%) Stakeholder Management
5 9 (12.86%) Web Services
5 9 (12.86%) ABAP
5 9 (12.86%) Microsoft
6 8 (11.43%) Oracle
6 8 (11.43%) Migration
6 8 (11.43%) Presales
7 7 (10.00%) Conversational UI
7 7 (10.00%) Chatbot
7 7 (10.00%) RESTful
7 7 (10.00%) ServiceNow
7 7 (10.00%) Artificial Intelligence
7 7 (10.00%) ITSM
7 7 (10.00%) Telecoms
7 7 (10.00%) Genesys
7 7 (10.00%) CI/CD
8 6 (8.57%) Configuration Management
8 6 (8.57%) Workflow
8 6 (8.57%) E-Commerce
8 6 (8.57%) Degree
8 6 (8.57%) VMware

Technical Consultant Skill Set
Co-occurring Skills and Capabilities with WFH Options by Category

The follow tables expand on the table above by listing co-occurrences grouped by category. The same employment type, locality and period is covered with up to 20 co-occurrences shown in each of the following categories:

Application Platforms
1 2 (2.86%) CMS
2 1 (1.43%) Microsoft Exchange
Applications
1 7 (10.00%) Chatbot
Business Applications
1 5 (7.14%) SAP S/4HANA
2 4 (5.71%) Oracle EBS
2 4 (5.71%) Oracle Subledger Accounting
2 4 (5.71%) SAP SD
3 3 (4.29%) SAP EWM
3 3 (4.29%) SAP MDG
4 2 (2.86%) Oracle Assets
4 2 (2.86%) Oracle Internet Expenses
4 2 (2.86%) Oracle iProcurement
4 2 (2.86%) Oracle iSupplier
4 2 (2.86%) Oracle Payables
4 2 (2.86%) Oracle Receivables
4 2 (2.86%) SAP Payroll
4 2 (2.86%) Workday HCM
5 1 (1.43%) Infor M3
5 1 (1.43%) Sage X3
5 1 (1.43%) SAP ERP
Cloud Services
1 10 (14.29%) Azure
2 9 (12.86%) AWS
2 9 (12.86%) GCP
3 6 (8.57%) Dynamics 365
4 3 (4.29%) Power Platform
5 2 (2.86%) Azure ExpressRoute
5 2 (2.86%) Azure Logic Apps
5 2 (2.86%) Azure Pipelines
5 2 (2.86%) Entra ID
5 2 (2.86%) IaaS
5 2 (2.86%) PaaS
6 1 (1.43%) Microsoft 365
6 1 (1.43%) OneDrive
6 1 (1.43%) Salsify
Communications & Networking
1 3 (4.29%) Firewall
1 3 (4.29%) VPN
2 2 (2.86%) DNS
3 1 (1.43%) F5 BIG-IP LTM
3 1 (1.43%) HTTP
3 1 (1.43%) NetScaler
3 1 (1.43%) NGFW
3 1 (1.43%) SD-WAN
3 1 (1.43%) SSH
3 1 (1.43%) SSL
3 1 (1.43%) TCP/IP
3 1 (1.43%) Wireless
Database & Business Intelligence
1 3 (4.29%) Power BI
1 3 (4.29%) SAP HANA
2 2 (2.86%) Oracle BI Publisher
2 2 (2.86%) Oracle Database
3 1 (1.43%) Data Lake
3 1 (1.43%) Power Query
3 1 (1.43%) SQL Server Integration Services
3 1 (1.43%) SQL Server Reporting Services
Development Applications
1 1 (1.43%) Eclipse
1 1 (1.43%) GitLab
General
1 14 (20.00%) Social Skills
2 9 (12.86%) Finance
3 7 (10.00%) Telecoms
4 6 (8.57%) Public Sector
5 5 (7.14%) Pharmaceutical
6 4 (5.71%) Inclusion and Diversity
6 4 (5.71%) Presentation Skills
7 2 (2.86%) Marketing
8 1 (1.43%) Banking
8 1 (1.43%) German Language
8 1 (1.43%) Legal
8 1 (1.43%) Manufacturing
8 1 (1.43%) Organisational Skills
8 1 (1.43%) Retail
8 1 (1.43%) Wholesale Banking
Libraries, Frameworks & Software Standards
1 9 (12.86%) Web Services
2 7 (10.00%) RESTful
3 3 (4.29%) CSS
3 3 (4.29%) HTML
4 2 (2.86%) DOM
4 2 (2.86%) Express.js
4 2 (2.86%) Node.js
4 2 (2.86%) React
4 2 (2.86%) SOAP
5 1 (1.43%) Ajax
5 1 (1.43%) BAPI
5 1 (1.43%) REST
5 1 (1.43%) SailPoint
5 1 (1.43%) SAP ALE
5 1 (1.43%) XML
Miscellaneous
1 5 (7.14%) EMV
1 5 (7.14%) IVR
2 2 (2.86%) Digital Media
3 1 (1.43%) BYOD
3 1 (1.43%) CMDB
3 1 (1.43%) Data Centre
3 1 (1.43%) FMCG
3 1 (1.43%) Greenfield Project
3 1 (1.43%) Life Science
3 1 (1.43%) Mobile App
3 1 (1.43%) Product Ownership
3 1 (1.43%) Renewable Energy
3 1 (1.43%) Replication
Operating Systems
1 5 (7.14%) Windows
2 2 (2.86%) Windows Server
3 1 (1.43%) Linux
3 1 (1.43%) Windows 10
3 1 (1.43%) Windows Server 2012
3 1 (1.43%) Windows Server 2016
Processes & Methodologies
1 11 (15.71%) Roadmaps
2 9 (12.86%) Stakeholder Management
3 8 (11.43%) Migration
3 8 (11.43%) Presales
4 7 (10.00%) Artificial Intelligence
4 7 (10.00%) CI/CD
4 7 (10.00%) Conversational UI
4 7 (10.00%) ITSM
5 6 (8.57%) Computer Science
5 6 (8.57%) Configuration Management
5 6 (8.57%) DevOps
5 6 (8.57%) DevSecOps
5 6 (8.57%) E-Commerce
5 6 (8.57%) Requirements Gathering
5 6 (8.57%) Workflow
6 5 (7.14%) IT Asset Management
6 5 (7.14%) Project Management
6 5 (7.14%) Quality Management
6 5 (7.14%) WFM
7 4 (5.71%) Operations Management
Programming Languages
1 9 (12.86%) ABAP
2 5 (7.14%) SQL
3 3 (4.29%) C
3 3 (4.29%) JavaScript
4 2 (2.86%) PowerShell
Qualifications
1 11 (15.71%) SC Cleared
1 11 (15.71%) Security Cleared
2 6 (8.57%) Degree
3 1 (1.43%) CCIE
3 1 (1.43%) CCIE Routing and Switching
3 1 (1.43%) Cisco Certification
3 1 (1.43%) CISSP
Quality Assurance & Compliance
1 5 (7.14%) NIST
2 4 (5.71%) PCI DSS
3 2 (2.86%) QA
System Software
1 4 (5.71%) Active Directory
2 3 (4.29%) Virtual Desktop
3 2 (2.86%) VMware Infrastructure
3 2 (2.86%) XenApp
4 1 (1.43%) Microsoft App-V
4 1 (1.43%) Terminal Services
4 1 (1.43%) VMware ESXi
4 1 (1.43%) VMware NSX
4 1 (1.43%) XenDesktop
Systems Management
1 1 (1.43%) FortiGate
1 1 (1.43%) Microsoft Intune
1 1 (1.43%) SCCM
1 1 (1.43%) SysTrack
1 1 (1.43%) Terraform
Vendors
1 13 (18.57%) SAP
2 9 (12.86%) Microsoft
3 8 (11.43%) Oracle
4 7 (10.00%) Genesys
4 7 (10.00%) ServiceNow
5 6 (8.57%) VMware
6 4 (5.71%) Adobe
7 3 (4.29%) Citrix
8 2 (2.86%) Avaya
8 2 (2.86%) Commvault
8 2 (2.86%) Workday
9 1 (1.43%) Altiris
9 1 (1.43%) F5
9 1 (1.43%) Fortinet
9 1 (1.43%) Infor
9 1 (1.43%) Ivanti
9 1 (1.43%) Meraki
9 1 (1.43%) Okta
9 1 (1.43%) Palo Alto
9 1 (1.43%) TSYS