Legal Contracts with Work from Home Options

Legal
UK > Work from Home

The table below looks at the prevalence of the term Legal in contract job vacancies with an option to work from home (WFH). Included is a benchmarking guide to the contractor rates offered in vacancies that have cited Legal over the 6 months to 26 April 2024 with a comparison to the same period over the previous 2 years.

6 months to
26 Apr 2024
Same period 2023 Same period 2022
Rank 126 147 153
Rank change year-on-year +21 +6 +52
Contract jobs citing Legal 267 437 793
As % of all contract jobs with a WFH option 1.74% 1.68% 1.78%
As % of the General category 2.95% 2.88% 3.31%
Number of daily rates quoted 145 309 521
10th Percentile £216 £275 £319
25th Percentile £413 £413 £413
Median daily rate (50th Percentile) £550 £508 £500
Median % change year-on-year +8.37% +1.50% +5.26%
75th Percentile £623 £625 £623
90th Percentile £706 £750 £750
UK median daily rate £500 £500 £500
% change year-on-year - - +5.26%
Number of hourly rates quoted 48 18 9
10th Percentile £20.26 - £12.10
25th Percentile £25.50 £22.16 £20.50
Median hourly rate £42.50 £50.00 £39.50
Median % change year-on-year -15.00% +26.58% +113.51%
75th Percentile £57.50 £70.65 £50.61
90th Percentile £58.70 £75.00 £64.00
UK median hourly rate £26.00 £22.16 £34.38
% change year-on-year +17.33% -35.53% +85.81%

All General Skills
Work from Home

Legal is in the General Skills category. The following table is for comparison with the above and provides summary statistics for all contract job vacancies with a WFH option and a requirement for common skills.

Contract vacancies with a requirement for common skills 9,039 15,189 23,959
As % of all contract jobs with a WFH option 58.77% 58.39% 53.87%
Number of daily rates quoted 5,911 10,697 17,332
10th Percentile £330 £363 £350
25th Percentile £425 £450 £427
Median daily rate (50th Percentile) £538 £550 £525
Median % change year-on-year -2.27% +4.76% +7.69%
75th Percentile £650 £675 £638
90th Percentile £763 £775 £738
UK median daily rate £525 £550 £530
% change year-on-year -4.55% +3.77% +7.07%
Number of hourly rates quoted 462 353 355
10th Percentile £14.00 £19.30 £13.41
25th Percentile £22.50 £30.50 £19.35
Median hourly rate £38.12 £52.50 £31.00
Median % change year-on-year -27.39% +69.35% +30.53%
75th Percentile £51.44 £68.75 £49.25
90th Percentile £68.66 £80.25 £63.90
UK median hourly rate £29.83 £35.00 £21.66
% change year-on-year -14.79% +61.61% -3.74%

Legal
Trend for Jobs with a WFH Option

Job vacancies with a work from home option citing Legal as a proportion of all IT jobs advertised.
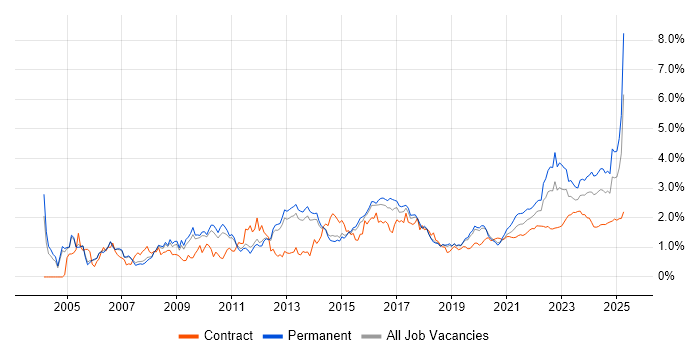
Legal trend for jobs with a WFH option

Legal
Daily Rate Trend for Jobs with a WFH Option

3-month moving average daily rate quoted in job vacancies with a work from home option citing Legal.

Legal daily rate for jobs with a WFH option

Legal
Daily Rate Histogram for Jobs with a WFH Option

Daily rate distribution for jobs with a work from home option citing Legal over the 6 months to 26 April 2024.

Legal daily rate histogram for jobs with a WFH option

Legal
Hourly Rate Trend for Jobs with a WFH Option

3-month moving average hourly rate quoted in job vacancies with a work from home option citing Legal.

Legal hourly rate for jobs with a WFH option

Legal
Hourly Rate Histogram for Jobs with a WFH Option

Hourly rate distribution for jobs with a work from home option citing Legal over the 6 months to 26 April 2024.

Legal hourly rate histogram for jobs with a WFH option

Legal
Co-occurring Skills and Capabilities with WFH Options by Category

The follow tables expand on the table above by listing co-occurrences grouped by category. The same employment type, locality and period is covered with up to 20 co-occurrences shown in each of the following categories:

Application Platforms
1 13 (4.87%) SharePoint
2 4 (1.50%) Apache Solr
2 4 (1.50%) Microsoft Exchange
2 4 (1.50%) nginx
3 3 (1.12%) Apache
3 3 (1.12%) Confluence
3 3 (1.12%) IIS
3 3 (1.12%) Tomcat
4 2 (0.75%) CMS
5 1 (0.37%) Apache Airflow
5 1 (0.37%) Apache Spark
5 1 (0.37%) Liferay
Applications
1 31 (11.61%) Microsoft Office
2 21 (7.87%) Microsoft Excel
3 19 (7.12%) Simulink
3 19 (7.12%) Stateflow
4 18 (6.74%) Microsoft PowerPoint
5 2 (0.75%) Acrobat
5 2 (0.75%) MS Visio
6 1 (0.37%) Microsoft Project
Business Applications
1 5 (1.87%) Dynamics CRM
2 4 (1.50%) SAP S/4HANA
3 3 (1.12%) Elite 3E
4 1 (0.37%) Carpe Diem
4 1 (0.37%) Dynamics AX
4 1 (0.37%) Oracle EBS
4 1 (0.37%) Salesforce CRM
4 1 (0.37%) SAP GTS
4 1 (0.37%) SAP Payroll
Cloud Services
1 20 (7.49%) Azure
2 18 (6.74%) SaaS
3 17 (6.37%) Microsoft 365
4 14 (5.24%) IaaS
5 13 (4.87%) Google Workspace
5 13 (4.87%) PaaS
6 12 (4.49%) Power Platform
7 8 (3.00%) WhatsApp
8 7 (2.62%) OneDrive
9 5 (1.87%) GCP
9 5 (1.87%) Power Automate
9 5 (1.87%) PowerApps
9 5 (1.87%) Smartsheet
9 5 (1.87%) SuccessFactors
10 4 (1.50%) Azure DevOps
10 4 (1.50%) Dynamics 365
10 4 (1.50%) OCI
11 3 (1.12%) Entra ID
12 2 (0.75%) AWS
12 2 (0.75%) Azure Data Factory
Communications & Networking
1 8 (3.00%) TCP/IP
2 5 (1.87%) DNS
2 5 (1.87%) Internet
3 4 (1.50%) HTTP
3 4 (1.50%) HTTPS
3 4 (1.50%) IPsec
3 4 (1.50%) VPN
4 3 (1.12%) H.323
5 2 (0.75%) Firewall
5 2 (0.75%) Wireless
6 1 (0.37%) Cisco IPT
6 1 (0.37%) Intranet
6 1 (0.37%) LAN
6 1 (0.37%) Software-Defined Networking
6 1 (0.37%) WAN
Database & Business Intelligence
1 9 (3.37%) Metadata
1 9 (3.37%) Power BI
2 5 (1.87%) MySQL
2 5 (1.87%) NoSQL
3 4 (1.50%) Couchbase
4 3 (1.12%) EDRMS
4 3 (1.12%) Tableau
5 2 (0.75%) Big Data
5 2 (0.75%) Data Lake
5 2 (0.75%) Data Warehouse
5 2 (0.75%) RDBMS
5 2 (0.75%) Relational Database
6 1 (0.37%) Delta Lake
6 1 (0.37%) Looker
6 1 (0.37%) SAP HANA
6 1 (0.37%) Spark SQL
Development Applications
1 4 (1.50%) JIRA
2 1 (0.37%) Git
General
1 82 (30.71%) Social Skills
2 56 (20.97%) Finance
3 42 (15.73%) Analytical Skills
4 27 (10.11%) Law
5 24 (8.99%) Automotive
6 21 (7.87%) Telecoms
7 15 (5.62%) Public Sector
8 14 (5.24%) Influencing Skills
8 14 (5.24%) Retail
9 9 (3.37%) Banking
10 8 (3.00%) Marketing
11 7 (2.62%) Manufacturing
11 7 (2.62%) Presentation Skills
12 6 (2.25%) German Language
12 6 (2.25%) Inclusion and Diversity
13 4 (1.50%) Local Government
14 3 (1.12%) Advertising
14 3 (1.12%) Italian Language
14 3 (1.12%) Organisational Skills
14 3 (1.12%) Publishing
Job Titles
1 35 (13.11%) Project Manager
2 30 (11.24%) Analyst
3 20 (7.49%) Senior
4 19 (7.12%) Software Engineer
5 13 (4.87%) IT Manager
6 12 (4.49%) Lead
7 11 (4.12%) Business Analyst
7 11 (4.12%) Senior Manager
8 10 (3.75%) Architect
8 10 (3.75%) Support Engineer
9 8 (3.00%) Data Analyst
9 8 (3.00%) Delivery Manager
9 8 (3.00%) HR Manager
10 7 (2.62%) Security Manager
10 7 (2.62%) Transformation Manager
11 6 (2.25%) Project Delivery Manager
11 6 (2.25%) Service Design Manager
12 5 (1.87%) Compliance Manager
12 5 (1.87%) Compliance Officer
12 5 (1.87%) Telecoms Manager
Libraries, Frameworks & Software Standards
1 4 (1.50%) JSON
1 4 (1.50%) LEMP Stack
1 4 (1.50%) RabbitMQ
1 4 (1.50%) YAML
2 3 (1.12%) .NET
3 2 (0.75%) REST
4 1 (0.37%) BAPI
4 1 (0.37%) Kafka
4 1 (0.37%) LDAP
4 1 (0.37%) PySpark
4 1 (0.37%) RESTful
4 1 (0.37%) SailPoint
4 1 (0.37%) SAP ALE
4 1 (0.37%) Web Services
Miscellaneous
1 24 (8.99%) Management Information System
2 22 (8.24%) Self-Motivation
3 20 (7.49%) Virtual Team
4 19 (7.12%) Algorithms
5 7 (2.62%) Onboarding
6 5 (1.87%) Analytical Mindset
6 5 (1.87%) Data Centre
6 5 (1.87%) Product Ownership
7 4 (1.50%) Cloud Native
7 4 (1.50%) Data Protection Act
8 3 (1.12%) IVR
8 3 (1.12%) Life Science
8 3 (1.12%) Replication
9 2 (0.75%) Cyberattack
9 2 (0.75%) Enterprise Software
9 2 (0.75%) Industry 4.0
9 2 (0.75%) IoT
9 2 (0.75%) Operational Technology
9 2 (0.75%) Private Cloud
10 1 (0.37%) Biopharmaceutical
Operating Systems
1 15 (5.62%) Windows
2 8 (3.00%) Linux
3 5 (1.87%) Windows 10
4 4 (1.50%) CentOS
5 3 (1.12%) Red Hat Enterprise Linux
6 2 (0.75%) Windows Server
7 1 (0.37%) Mac OS
7 1 (0.37%) Windows Server 2016
7 1 (0.37%) Windows Server 2019
Processes & Methodologies
1 49 (18.35%) Agile
2 44 (16.48%) Project Management
3 38 (14.23%) Stakeholder Management
4 36 (13.48%) Continuous Improvement
5 31 (11.61%) Computer Science
5 31 (11.61%) Problem-Solving
6 26 (9.74%) Data Protection
7 25 (9.36%) Validation
8 22 (8.24%) Cybersecurity
9 21 (7.87%) Migration
9 21 (7.87%) Test Automation
10 20 (7.49%) Verification and Validation
11 19 (7.12%) Hardware-in-the-Loop
11 19 (7.12%) Software Engineering
12 18 (6.74%) Information Management
12 18 (6.74%) Information Security
13 17 (6.37%) Change Management
14 16 (5.99%) Project Delivery
14 16 (5.99%) Roadmaps
15 15 (5.62%) Budget Management
Programming Languages
1 19 (7.12%) MATLAB
2 11 (4.12%) SQL
3 6 (2.25%) Python
4 4 (1.50%) C#
4 4 (1.50%) PHP
5 2 (0.75%) C++
5 2 (0.75%) Java
5 2 (0.75%) PowerShell
6 1 (0.37%) ABAP
6 1 (0.37%) Bash
6 1 (0.37%) JavaScript
6 1 (0.37%) R
6 1 (0.37%) Ruby
6 1 (0.37%) Scala
Qualifications
1 55 (20.60%) Degree
2 17 (6.37%) PMI Certification
2 17 (6.37%) Security Cleared
3 16 (5.99%) PMP
3 16 (5.99%) SC Cleared
4 13 (4.87%) APMP
5 6 (2.25%) Computer Science Degree
6 5 (1.87%) Master's Degree
7 4 (1.50%) CIPD
7 4 (1.50%) CISSP
8 3 (1.12%) CCIE
8 3 (1.12%) CCNP
8 3 (1.12%) Cisco Certification
8 3 (1.12%) CISM
8 3 (1.12%) DBS Check
8 3 (1.12%) PRINCE2 Practitioner
9 2 (0.75%) CCIE Security
9 2 (0.75%) CCIE Service Provider
9 2 (0.75%) CISA
9 2 (0.75%) ISEB
Quality Assurance & Compliance
1 36 (13.48%) GDPR
2 16 (5.99%) ISO/IEC 27001
2 16 (5.99%) QA
3 13 (4.87%) Data Quality
4 7 (2.62%) California Consumer Privacy Act
5 5 (1.87%) NIST
6 4 (1.50%) HIPAA
7 3 (1.12%) Cyber Essentials
8 2 (0.75%) Accessibility
8 2 (0.75%) PMO
9 1 (0.37%) COPPA
9 1 (0.37%) ISO 14001
9 1 (0.37%) ISO 22301
9 1 (0.37%) ISO 9001
9 1 (0.37%) PCI DSS
9 1 (0.37%) Sarbanes-Oxley
9 1 (0.37%) Transfer of Undertakings (Protection of Employment)
System Software
1 10 (3.75%) Active Directory
2 1 (0.37%) VMware Infrastructure
Systems Management
1 5 (1.87%) Terraform
2 4 (1.50%) Ansible
2 4 (1.50%) Kubernetes
3 1 (0.37%) HP Quality Center
3 1 (0.37%) Jamf Pro
3 1 (0.37%) SCCM
Vendors
1 51 (19.10%) Microsoft
2 24 (8.99%) Oracle
3 19 (7.12%) Google
4 15 (5.62%) SAP
5 13 (4.87%) Salesforce
6 5 (1.87%) Intapp
7 4 (1.50%) Cisco
7 4 (1.50%) iManage
7 4 (1.50%) VMware
8 3 (1.12%) Avaya
8 3 (1.12%) Red Hat
8 3 (1.12%) Verint
8 3 (1.12%) Workday
9 2 (0.75%) Adobe
9 2 (0.75%) Ariba
9 2 (0.75%) BT
9 2 (0.75%) Citrix
9 2 (0.75%) Fortinet
9 2 (0.75%) HP
9 2 (0.75%) Remedy