SuccessFactors Contracts with Work from Home Options

SAP SuccessFactors
UK > Work from Home

The table below provides summary statistics for contract job vacancies with an option to work from home (WFH) and a requirement for SuccessFactors skills. Included is a benchmarking guide to the contractor rates offered in vacancies that have cited SuccessFactors over the 6 months to 28 April 2024 with a comparison to the same period in the previous 2 years.

6 months to
28 Apr 2024
Same period 2023 Same period 2022
Rank 245 366 494
Rank change year-on-year +121 +128 -102
Contract jobs citing SuccessFactors 101 106 129
As % of all contract jobs with a WFH option 0.66% 0.41% 0.29%
As % of the Cloud Services category 1.82% 1.04% 0.70%
Number of daily rates quoted 50 61 77
10th Percentile £395 £450 £408
25th Percentile £475 £500 £420
Median daily rate (50th Percentile) £525 £575 £505
Median % change year-on-year -8.70% +13.86% +1.00%
75th Percentile £594 £675 £650
90th Percentile £661 £678 £700
UK median daily rate £530 £550 £525
% change year-on-year -3.64% +4.76% -3.93%
Number of hourly rates quoted 6 0 1
10th Percentile - - -
25th Percentile £15.85 - -
Median hourly rate £38.93 - £40.00
75th Percentile £62.00 - -
90th Percentile - - -
UK median hourly rate £42.50 - £40.00
% change year-on-year - - +343.21%

All Cloud Skills
Work from Home

SuccessFactors is in the Cloud Services category. The following table is for comparison with the above and provides summary statistics for all contract job vacancies with a WFH option and a requirement for cloud computing skills.

Contract vacancies with a requirement for cloud computing skills 5,535 10,239 18,490
As % of all contract jobs with a WFH option 36.23% 39.60% 41.47%
Number of daily rates quoted 3,958 7,517 13,788
10th Percentile £350 £374 £375
25th Percentile £425 £450 £450
Median daily rate (50th Percentile) £525 £550 £550
Median % change year-on-year -4.55% - +10.00%
75th Percentile £638 £650 £638
90th Percentile £732 £743 £725
UK median daily rate £525 £550 £550
% change year-on-year -4.55% - +10.00%
Number of hourly rates quoted 89 125 173
10th Percentile £15.50 £16.43 £14.40
25th Percentile £17.00 £21.31 £19.00
Median hourly rate £26.00 £55.00 £30.00
Median % change year-on-year -52.73% +83.33% -21.83%
75th Percentile £50.25 £70.00 £62.15
90th Percentile £64.37 £78.40 £66.00
UK median hourly rate £20.99 £35.00 £21.50
% change year-on-year -40.04% +62.79% -6.30%

SuccessFactors
Trend for Jobs with a WFH Option

Job vacancies with a work from home option citing SuccessFactors as a proportion of all IT jobs advertised.
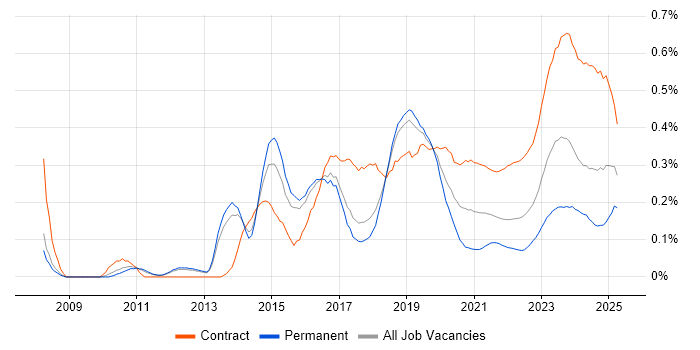
SuccessFactors trend for jobs with a WFH option

SuccessFactors
Daily Rate Trend for Jobs with a WFH Option

3-month moving average daily rate quoted in job vacancies with a work from home option citing SuccessFactors.

SuccessFactors daily rate for jobs with a WFH option

SuccessFactors
Daily Rate Histogram for Jobs with a WFH Option

Daily rate distribution for jobs with a work from home option citing SuccessFactors over the 6 months to 28 April 2024.

SuccessFactors daily rate histogram for jobs with a WFH option

SuccessFactors
Hourly Rate Trend for Jobs with a WFH Option

3-month moving average hourly rate quoted in job vacancies with a work from home option citing SuccessFactors.

SuccessFactors hourly rate for jobs with a WFH option

SuccessFactors
Hourly Rate Histogram for Jobs with a WFH Option

Hourly rate distribution for jobs with a work from home option citing SuccessFactors over the 6 months to 28 April 2024.

SuccessFactors hourly rate histogram for jobs with a WFH option

SuccessFactors
Co-occurring Skills and Capabilities with WFH Options by Category

The follow tables expand on the table above by listing co-occurrences grouped by category. The same employment type, locality and period is covered with up to 20 co-occurrences shown in each of the following categories:

Application Platforms
1 2 (1.98%) Oracle Workflow
2 1 (0.99%) Confluence
Applications
1 4 (3.96%) Microsoft Office
2 3 (2.97%) Microsoft Excel
2 3 (2.97%) Microsoft PowerPoint
Business Applications
1 21 (20.79%) SAP S/4HANA
2 17 (16.83%) SAP HCM
3 16 (15.84%) SAP HR
4 8 (7.92%) SAP Payroll
5 3 (2.97%) SAP Oil and Gas
6 2 (1.98%) SAP CO
7 1 (0.99%) Oracle Financials
7 1 (0.99%) SAP CX
7 1 (0.99%) SAP FI
7 1 (0.99%) SAP FI/CO
7 1 (0.99%) SAP PM
Cloud Services
1 3 (2.97%) SaaS
1 3 (2.97%) SAP Fieldglass
1 3 (2.97%) Smartsheet
2 1 (0.99%) Azure
2 1 (0.99%) Azure DevOps
2 1 (0.99%) Boomi
2 1 (0.99%) PaaS
Communications & Networking
1 3 (2.97%) HTTP
1 3 (2.97%) WinSCP
Database & Business Intelligence
1 2 (1.98%) Oracle Database
2 1 (0.99%) SAP HANA
Development Applications
1 3 (2.97%) Postman
1 3 (2.97%) SoapUI
2 1 (0.99%) JIRA
General
1 36 (35.64%) Social Skills
2 15 (14.85%) Analytical Skills
3 7 (6.93%) Finance
4 6 (5.94%) Retail
5 5 (4.95%) Legal
6 4 (3.96%) Local Government
6 4 (3.96%) Manufacturing
6 4 (3.96%) Public Sector
7 3 (2.97%) Banking
7 3 (2.97%) Influencing Skills
8 2 (1.98%) Organisational Skills
8 2 (1.98%) Telecoms
9 1 (0.99%) Automotive
9 1 (0.99%) Danish Language
9 1 (0.99%) General Ledger
9 1 (0.99%) Inclusion and Diversity
9 1 (0.99%) Marketing
9 1 (0.99%) Presentation Skills
Job Titles
1 27 (26.73%) Lead
2 25 (24.75%) Consultant
3 17 (16.83%) SAP Consultant
4 12 (11.88%) Project Manager
5 10 (9.90%) Payroll Consultant
6 9 (8.91%) Architect
6 9 (8.91%) SAP Payroll Consultant
7 8 (7.92%) HR Consultant
8 7 (6.93%) Analyst
8 7 (6.93%) Business Analyst
8 7 (6.93%) Functional Consultant
8 7 (6.93%) HR Manager
8 7 (6.93%) SAP HR Consultant
8 7 (6.93%) SAP HR/Payroll Consultant
8 7 (6.93%) Solutions Architect
9 6 (5.94%) SAP Functional Consultant
9 6 (5.94%) SAP HR Functional Consultant
9 6 (5.94%) Senior
10 4 (3.96%) Technical Leader
10 4 (3.96%) Technical Support
Libraries, Frameworks & Software Standards
1 5 (4.95%) REST
2 3 (2.97%) JDBC
2 3 (2.97%) Smart Contracts
2 3 (2.97%) SOAP
3 2 (1.98%) Web Services
4 1 (0.99%) Middleware
4 1 (0.99%) Oracle Fusion
4 1 (0.99%) SAP Fiori
Miscellaneous
1 10 (9.90%) Onboarding
2 7 (6.93%) Management Information System
3 3 (2.97%) Life Science
3 3 (2.97%) Renewable Energy
4 2 (1.98%) FMCG
4 2 (1.98%) Foreign Exchange (FX)
4 2 (1.98%) Learning Management System
4 2 (1.98%) Legacy Applications
4 2 (1.98%) Legacy Systems
5 1 (0.99%) Greenfield Project
Operating Systems
1 2 (1.98%) Windows Server 2016
Processes & Methodologies
1 22 (21.78%) Project Management
2 18 (17.82%) Stakeholder Management
3 17 (16.83%) Problem-Solving
4 15 (14.85%) Agile
5 12 (11.88%) Collaborative Working
6 11 (10.89%) Workflow
7 10 (9.90%) Service Delivery
8 9 (8.91%) Change Management
9 8 (7.92%) Migration
10 6 (5.94%) Roadmaps
11 5 (4.95%) Process Improvement
11 5 (4.95%) Project Delivery
11 5 (4.95%) Requirements Gathering
11 5 (4.95%) Technical Leadership
12 4 (3.96%) Computer Science
12 4 (3.96%) Data Migration
12 4 (3.96%) ITIL
12 4 (3.96%) Logistics
12 4 (3.96%) Root Cause Analysis
12 4 (3.96%) User Acceptance Testing
Programming Languages
1 3 (2.97%) SQL
2 1 (0.99%) Java
2 1 (0.99%) JavaScript
2 1 (0.99%) Python
Qualifications
1 11 (10.89%) Degree
2 7 (6.93%) Security Cleared
3 6 (5.94%) SC Cleared
4 4 (3.96%) Computer Science Degree
5 3 (2.97%) Master's Degree
5 3 (2.97%) SAP Certification
6 2 (1.98%) BPSS Clearance
7 1 (0.99%) CCA
7 1 (0.99%) ISEB
7 1 (0.99%) ISTQB
Quality Assurance & Compliance
1 5 (4.95%) SLA
2 3 (2.97%) PMO
2 3 (2.97%) QA
3 2 (1.98%) GDPR
Vendors
1 82 (81.19%) SAP
2 9 (8.91%) Ariba
2 9 (8.91%) Workday
3 8 (7.92%) ServiceNow
4 4 (3.96%) Microsoft
4 4 (3.96%) Oracle
5 3 (2.97%) OpenText
6 2 (1.98%) MuleSoft
7 1 (0.99%) Concur
7 1 (0.99%) Dell
7 1 (0.99%) IBM
7 1 (0.99%) Snow