Cloud Security Contracts with Work from Home Options

Cloud Security
UK > Work from Home

The table below provides summary statistics for contract job vacancies with an option to work from home (WFH) and a requirement for Cloud Security skills. Included is a benchmarking guide to the contractor rates offered in vacancies that have cited Cloud Security over the 6 months to 28 April 2024 with a comparison to the same period in the previous 2 years.

6 months to
28 Apr 2024
Same period 2023 Same period 2022
Rank 200 131 207
Rank change year-on-year -69 +76 -60
Contract jobs citing Cloud Security 153 488 573
As % of all contract jobs with a WFH option 1.00% 1.89% 1.29%
As % of the Processes & Methodologies category 1.14% 2.10% 1.41%
Number of daily rates quoted 104 340 405
10th Percentile £425 £475 £463
25th Percentile £517 £525 £525
Median daily rate (50th Percentile) £600 £635 £625
Median % change year-on-year -5.51% +1.60% +13.64%
75th Percentile £675 £725 £720
90th Percentile £750 £800 £800
UK median daily rate £600 £625 £625
% change year-on-year -4.00% - +11.11%
Number of hourly rates quoted 0 13 6
10th Percentile - - £28.84
25th Percentile - - £32.50
Median hourly rate - £70.00 £40.00
Median % change year-on-year - +75.00% -17.95%
75th Percentile - - £47.50
90th Percentile - - £56.63
UK median hourly rate - £70.00 £40.00
% change year-on-year - +75.00% -17.95%

All Process and Methodology Skills
Work from Home

Cloud Security is in the Processes and Methodologies category. The following table is for comparison with the above and provides summary statistics for all contract job vacancies with a WFH option and a requirement for process or methodology skills.

Contract vacancies with a requirement for process or methodology skills 13,424 23,231 40,628
As % of all contract jobs with a WFH option 87.86% 89.84% 91.13%
Number of daily rates quoted 8,959 16,419 29,475
10th Percentile £325 £363 £360
25th Percentile £425 £450 £431
Median daily rate (50th Percentile) £525 £540 £525
Median % change year-on-year -2.78% +2.86% +9.38%
75th Percentile £638 £650 £625
90th Percentile £750 £750 £715
UK median daily rate £525 £550 £525
% change year-on-year -4.55% +4.76% +8.25%
Number of hourly rates quoted 568 532 547
10th Percentile £15.12 £19.00 £13.50
25th Percentile £24.25 £30.54 £19.89
Median hourly rate £40.28 £55.00 £35.00
Median % change year-on-year -26.76% +57.14% +34.62%
75th Percentile £60.00 £68.75 £55.00
90th Percentile £75.25 £80.23 £67.20
UK median hourly rate £35.00 £37.30 £25.00
% change year-on-year -6.17% +49.20% -

Cloud Security
Trend for Jobs with a WFH Option

Job vacancies with a work from home option citing Cloud Security as a proportion of all IT jobs advertised.
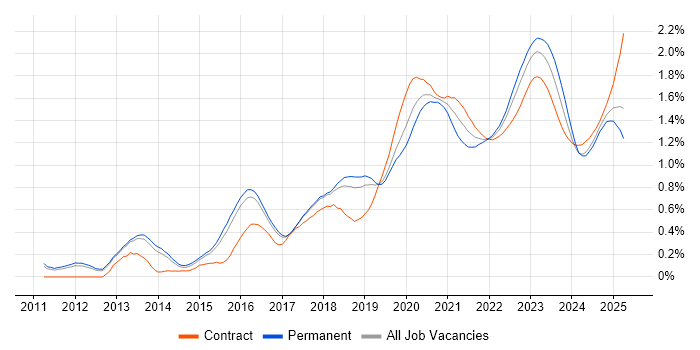
Cloud Security trend for jobs with a WFH option

Cloud Security
Daily Rate Trend for Jobs with a WFH Option

3-month moving average daily rate quoted in job vacancies with a work from home option citing Cloud Security.

Cloud Security daily rate for jobs with a WFH option

Cloud Security
Daily Rate Histogram for Jobs with a WFH Option

Daily rate distribution for jobs with a work from home option citing Cloud Security over the 6 months to 28 April 2024.

Cloud Security daily rate histogram for jobs with a WFH option

Cloud Security
Hourly Rate Trend for Jobs with a WFH Option

3-month moving average hourly rate quoted in job vacancies with a work from home option citing Cloud Security.

Cloud Security hourly rate for jobs with a WFH option

Cloud Security
Co-occurring Skills and Capabilities with WFH Options by Category

The follow tables expand on the table above by listing co-occurrences grouped by category. The same employment type, locality and period is covered with up to 20 co-occurrences shown in each of the following categories:

Application Platforms
1 2 (1.31%) Microsoft Exchange
1 2 (1.31%) nginx
1 2 (1.31%) Oracle Self-Service HR
2 1 (0.65%) Confluence
2 1 (0.65%) SharePoint
Applications
1 5 (3.27%) MS Visio
2 3 (1.96%) Microsoft Excel
3 2 (1.31%) Microsoft Office
4 1 (0.65%) Chatbot
4 1 (0.65%) Microsoft PowerPoint
4 1 (0.65%) Weka
Business Applications
1 4 (2.61%) Sparx Enterprise Architect
2 1 (0.65%) SAP CAR
2 1 (0.65%) SAP POS DM
2 1 (0.65%) SAP Retail
2 1 (0.65%) SAP S/4HANA
Cloud Services
1 85 (55.56%) Azure
2 64 (41.83%) AWS
3 27 (17.65%) GCP
4 16 (10.46%) IaaS
5 14 (9.15%) Entra ID
6 11 (7.19%) PaaS
6 11 (7.19%) SaaS
7 9 (5.88%) AWS CloudFormation
8 8 (5.23%) Microsoft 365
8 8 (5.23%) Serverless
9 7 (4.58%) Amazon CloudWatch
9 7 (4.58%) CloudFront
10 6 (3.92%) Amazon EKS
10 6 (3.92%) Azure DevOps
10 6 (3.92%) Virtual Private Cloud
11 5 (3.27%) AWS Lambda
11 5 (3.27%) Azure Monitor
11 5 (3.27%) Azure Sentinel
12 4 (2.61%) Amazon EC2
12 4 (2.61%) AWS CloudTrail
Communications & Networking
1 29 (18.95%) Network Security
2 26 (16.99%) Firewall
3 13 (8.50%) VPN
4 12 (7.84%) DNS
5 4 (2.61%) Intrusion Detection
5 4 (2.61%) TCP/IP
5 4 (2.61%) WAN
6 3 (1.96%) LAN
7 2 (1.31%) SCCP
7 2 (1.31%) SD-WAN
7 2 (1.31%) SSH
8 1 (0.65%) DHCP
8 1 (0.65%) DMZ
8 1 (0.65%) Internet
8 1 (0.65%) MPLS
8 1 (0.65%) Multicast
8 1 (0.65%) NAS
8 1 (0.65%) SAN
8 1 (0.65%) Wi-Fi
8 1 (0.65%) WLAN
Database & Business Intelligence
1 3 (1.96%) Amazon RDS
1 3 (1.96%) MySQL
1 3 (1.96%) PostgreSQL
2 2 (1.31%) Data Lake
2 2 (1.31%) DynamoDB
2 2 (1.31%) SQL Server
3 1 (0.65%) Amazon Athena
3 1 (0.65%) Azure SQL Database
3 1 (0.65%) NoSQL
3 1 (0.65%) Oracle Database
3 1 (0.65%) RDBMS
3 1 (0.65%) Relational Database
3 1 (0.65%) SAP BW
Development Applications
1 5 (3.27%) Git
2 4 (2.61%) GitLab
3 3 (1.96%) Jenkins
4 2 (1.31%) Burp Suite
4 2 (1.31%) Eclipse
4 2 (1.31%) JIRA
4 2 (1.31%) Snyk
4 2 (1.31%) Visual Studio Code
5 1 (0.65%) CircleCI
5 1 (0.65%) Visual Studio
General
1 24 (15.69%) Finance
2 22 (14.38%) Public Sector
3 21 (13.73%) Social Skills
4 14 (9.15%) Retail
5 11 (7.19%) Banking
6 8 (5.23%) Analytical Skills
7 6 (3.92%) Inclusion and Diversity
8 4 (2.61%) Documentation Skills
9 3 (1.96%) Presentation Skills
10 2 (1.31%) Automotive
10 2 (1.31%) Financial Institution
10 2 (1.31%) Legal
10 2 (1.31%) Tech for Good
11 1 (0.65%) Health Technology
11 1 (0.65%) Influencing Skills
11 1 (0.65%) Local Government
11 1 (0.65%) Manufacturing
11 1 (0.65%) Marketing
11 1 (0.65%) Organisational Skills
11 1 (0.65%) Telecoms
Job Titles
1 60 (39.22%) Architect
2 26 (16.99%) Security Architect
3 24 (15.69%) Cloud Engineer
4 21 (13.73%) Security Engineer
4 21 (13.73%) Solutions Architect
5 15 (9.80%) Senior
6 11 (7.19%) Consultant
7 9 (5.88%) Lead
8 8 (5.23%) Azure Architect
8 8 (5.23%) Cloud Architect
8 8 (5.23%) DevOps Engineer
9 7 (4.58%) Developer
10 6 (3.92%) Analyst
10 6 (3.92%) Security Analyst
10 6 (3.92%) Security Consultant
10 6 (3.92%) Senior Cloud Engineer
10 6 (3.92%) SOC Engineer
11 5 (3.27%) Applications Engineer
11 5 (3.27%) AWS Engineer
11 5 (3.27%) Senior Architect
Libraries, Frameworks & Software Standards
1 17 (11.11%) SailPoint
2 11 (7.19%) SAML
3 5 (3.27%) Node.js
3 5 (3.27%) OAuth
3 5 (3.27%) OAuth2
3 5 (3.27%) REST
4 4 (2.61%) OpenID
5 3 (1.96%) PyTorch
5 3 (1.96%) scikit-learn
5 3 (1.96%) SOAP
5 3 (1.96%) TensorFlow
6 2 (1.31%) ARM Templates
6 2 (1.31%) JAX-RS
6 2 (1.31%) JSON
6 2 (1.31%) RESTful
6 2 (1.31%) Restlet
6 2 (1.31%) Spring
6 2 (1.31%) Spring Boot
6 2 (1.31%) Web Services
6 2 (1.31%) YAML
Miscellaneous
1 16 (10.46%) Cloud Native
2 13 (8.50%) Security Posture
3 10 (6.54%) Management Information System
4 9 (5.88%) Public Cloud
5 7 (4.58%) Hybrid Cloud
6 6 (3.92%) Onboarding
6 6 (3.92%) PKI
6 6 (3.92%) Security Operations Centre
7 5 (3.27%) Distributed Denial-of-Service
8 4 (2.61%) Data Centre
9 3 (1.96%) Algorithms
9 3 (1.96%) Cloud Security Posture
9 3 (1.96%) Cyber Threat
9 3 (1.96%) Greenfield Project
9 3 (1.96%) Product Ownership
10 2 (1.31%) Cyber Security Posture
10 2 (1.31%) Insider Threat
10 2 (1.31%) Mobile App
10 2 (1.31%) Operational Technology
11 1 (0.65%) Enterprise Software
Operating Systems
1 14 (9.15%) Windows
2 9 (5.88%) Linux
3 2 (1.31%) Kali Linux
3 2 (1.31%) Unix
4 1 (0.65%) Android
4 1 (0.65%) Apple iOS
4 1 (0.65%) Windows 10
4 1 (0.65%) Windows Server
Processes & Methodologies
1 45 (29.41%) DevOps
2 37 (24.18%) Cybersecurity
3 35 (22.88%) CI/CD
4 32 (20.92%) Application Security
5 30 (19.61%) Infrastructure as Code
6 26 (16.99%) Migration
7 23 (15.03%) Information Security
7 23 (15.03%) Security Architecture
8 22 (14.38%) Identity Access Management
9 21 (13.73%) Containerisation
10 19 (12.42%) Penetration Testing
11 18 (11.76%) DevSecOps
12 17 (11.11%) Secrets Management
13 16 (10.46%) Architectural Design
13 16 (10.46%) High Availability
13 16 (10.46%) Microservices
13 16 (10.46%) SIEM
14 15 (9.80%) Agile
14 15 (9.80%) Incident Response
15 14 (9.15%) Vulnerability Management
Programming Languages
1 13 (8.50%) Python
2 7 (4.58%) PowerShell
3 6 (3.92%) TypeScript
4 5 (3.27%) Java
5 3 (1.96%) Bash
5 3 (1.96%) C#
5 3 (1.96%) Kusto Query Language
6 2 (1.31%) ABAP
6 2 (1.31%) PHP
6 2 (1.31%) SOQL
6 2 (1.31%) SOSL
6 2 (1.31%) SQL
7 1 (0.65%) Bicep
7 1 (0.65%) Go
7 1 (0.65%) JavaScript
7 1 (0.65%) Ruby
Qualifications
1 29 (18.95%) Security Cleared
2 26 (16.99%) SC Cleared
3 16 (10.46%) CISSP
4 15 (9.80%) Degree
5 10 (6.54%) Computer Science Degree
6 9 (5.88%) CISM
7 8 (5.23%) AWS Certification
8 7 (4.58%) Azure Certification
9 5 (3.27%) BPSS Clearance
9 5 (3.27%) DV Cleared
9 5 (3.27%) Microsoft Certification
10 4 (2.61%) CISA
11 3 (1.96%) (ISC)2 CCSP
11 3 (1.96%) CCSP
11 3 (1.96%) Cisco Certification
12 2 (1.31%) CompTIA Security+
12 2 (1.31%) CRISC
12 2 (1.31%) DBS Check
12 2 (1.31%) GIAC
12 2 (1.31%) Master's Degree
Quality Assurance & Compliance
1 20 (13.07%) NIST
2 19 (12.42%) ISO/IEC 27001
3 11 (7.19%) NCSC
4 5 (3.27%) PCI DSS
5 3 (1.96%) GPG13
6 2 (1.31%) Disclosure Scotland
6 2 (1.31%) GDPR
6 2 (1.31%) HMG Security Policy Framework
6 2 (1.31%) ISO/IEC 27002 (supersedes ISO/IEC 17799)
7 1 (0.65%) COBIT
7 1 (0.65%) Cyber Essentials
7 1 (0.65%) NIST 800
7 1 (0.65%) QA
7 1 (0.65%) Sarbanes-Oxley
System Software
1 18 (11.76%) Active Directory
2 15 (9.80%) Docker
3 4 (2.61%) Virtual Machines
4 3 (1.96%) VMware Infrastructure
5 2 (1.31%) Hyper-V
5 2 (1.31%) Squid
6 1 (0.65%) IAG
6 1 (0.65%) Virtual Desktop
6 1 (0.65%) VMware ESXi
Systems Management
1 23 (15.03%) Terraform
2 17 (11.11%) Kubernetes
3 9 (5.88%) Single Sign-On
4 4 (2.61%) Ansible
4 4 (2.61%) Trend Micro Deep Security
5 2 (1.31%) CASB
5 2 (1.31%) HAProxy
6 1 (0.65%) HP Fortify
6 1 (0.65%) Microsoft Intune
6 1 (0.65%) Nessus
6 1 (0.65%) SCCM
Vendors
1 32 (20.92%) Microsoft
2 15 (9.80%) BeyondTrust
2 15 (9.80%) CyberArk
2 15 (9.80%) ServiceNow
3 8 (5.23%) Google
4 6 (3.92%) Oracle
5 5 (3.27%) F5
5 5 (3.27%) Splunk
6 4 (2.61%) Palo Alto
6 4 (2.61%) Salesforce
6 4 (2.61%) Sparx
6 4 (2.61%) Zscaler
7 3 (1.96%) Cisco
7 3 (1.96%) CrowdStrike
7 3 (1.96%) SAP
7 3 (1.96%) VMware
8 2 (1.31%) Atlassian
8 2 (1.31%) CheckPoint
8 2 (1.31%) Forcepoint
8 2 (1.31%) Fortinet