ServiceNow Contracts with Hybrid/Remote/WFH Options

ServiceNow
UK > Work from Home

The table below provides summary statistics for remote or hybrid contract work requiring knowledge or experience of ServiceNow products and/or services. It includes a benchmarking guide to contractor rates offered in vacancies that cited ServiceNow over the 6 months leading up to 1 May 2025, comparing them to the same period in the previous two years.

The figures below represent the IT contractor job market in general and are not representative of contractor rates within ServiceNow.

6 months to
1 May 2025
Same period 2024 Same period 2023
Rank 87 74 109
Rank change year-on-year -13 +35 +56
Contract jobs citing ServiceNow 284 404 569
As % of all contract jobs with a WFH option 2.87% 2.63% 2.20%
As % of the Vendors category 6.26% 6.21% 5.11%
Number of daily rates quoted 204 248 422
10th Percentile £302 £280 £229
25th Percentile £375 £448 £413
Median daily rate (50th Percentile) £501 £540 £500
Median % change year-on-year -7.27% +8.00% -4.76%
75th Percentile £600 £600 £600
90th Percentile £661 £680 £743
UK median daily rate £500 £500 £500
Number of hourly rates quoted 3 11 4
10th Percentile £16.58 - £15.71
25th Percentile £20.68 £15.50 £16.01
Median hourly rate £30.00 £16.00 £20.69
Median % change year-on-year +87.50% -22.65% -8.07%
75th Percentile £50.63 £23.48 £28.65
90th Percentile £61.50 £30.25 £35.22
UK median hourly rate £18.48 £16.30 £18.42
% change year-on-year +13.34% -11.51% +18.84%

All Vendors
Work from Home

ServiceNow falls under the Vendor Products and Services category. For comparison with the information above, the following table provides summary statistics for all contract job vacancies with a remote or hybrid options requiring knowledge or experience of all vendor products and services.

Contract vacancies with a requirement for knowledge or experience of vendor products and services 4,540 6,506 11,129
As % of all contract jobs with a WFH option 45.84% 42.40% 43.04%
Number of daily rates quoted 2,959 4,024 7,488
10th Percentile £325 £325 £330
25th Percentile £413 £425 £425
Median daily rate (50th Percentile) £525 £525 £525
Median % change year-on-year -0.10% - -
75th Percentile £625 £625 £650
90th Percentile £738 £725 £750
UK median daily rate £515 £517 £525
% change year-on-year -0.39% -1.52% -
Number of hourly rates quoted 120 220 258
10th Percentile £14.20 £13.92 £17.87
25th Percentile £19.56 £16.93 £31.81
Median hourly rate £47.25 £32.31 £54.50
Median % change year-on-year +46.25% -40.72% +55.71%
75th Percentile £68.00 £60.00 £68.75
90th Percentile £86.00 £72.50 £80.25
UK median hourly rate £26.45 £22.30 £43.75
% change year-on-year +18.61% -49.03% +108.14%

ServiceNow
Trend for Jobs with a WFH Option

Job vacancies with remote working options citing ServiceNow as a proportion of all IT jobs advertised.
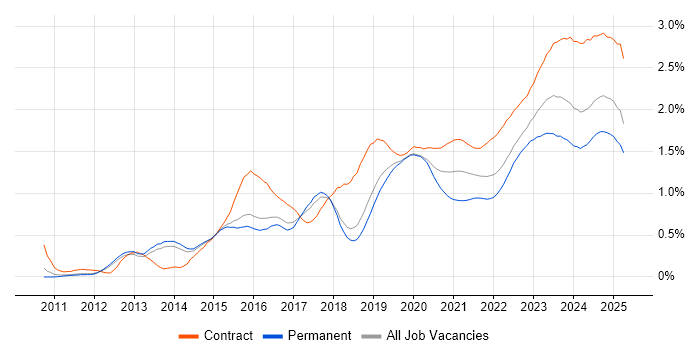
ServiceNow trend for jobs with Hybrid/Remote/WFH options

ServiceNow
Daily Rate Trend for Jobs with a WFH Option

3-month moving average daily rate quoted in job vacancies with remote working options citing ServiceNow.

ServiceNow daily rate for jobs with a WFH option

ServiceNow
Daily Rate Histogram for Jobs with a WFH Option

Daily rate distribution for jobs with remote working options citing ServiceNow over the 6 months to 1 May 2025.

ServiceNow daily rate histogram for jobs with a WFH option

ServiceNow
Hourly Rate Trend for Jobs with a WFH Option

3-month moving average hourly rate quoted in job vacancies with remote working options citing ServiceNow.

ServiceNow hourly rate for jobs with a WFH option

ServiceNow
Hourly Rate Histogram for Jobs with a WFH Option

Hourly rate distribution for jobs with remote working options citing ServiceNow over the 6 months to 1 May 2025.

ServiceNow hourly rate histogram for jobs with a WFH option

ServiceNow
Co-occurring Skills and Capabilities with WFH Options by Category

The follow tables expand on the table above by listing co-occurrences grouped by category. The same employment type, locality and period is covered with up to 20 co-occurrences shown in each of the following categories:

Application Platforms
1 19 (6.69%) SharePoint
2 6 (2.11%) Confluence
3 1 (0.35%) BizTalk Server
3 1 (0.35%) CMS
3 1 (0.35%) IBM Notes
3 1 (0.35%) IIS
3 1 (0.35%) Microsoft Exchange
3 1 (0.35%) TPMS
3 1 (0.35%) WebSphere
Applications
1 12 (4.23%) Microsoft Office
2 7 (2.46%) Microsoft Excel
3 6 (2.11%) Microsoft PowerPoint
3 6 (2.11%) MS Visio
4 2 (0.70%) Chatbot
5 1 (0.35%) Trello
Business Applications
1 4 (1.41%) Dynamics CRM
1 4 (1.41%) Remedy ITSM
2 2 (0.70%) iTrent
Cloud Services
1 37 (13.03%) Azure
2 23 (8.10%) Microsoft 365
3 20 (7.04%) AWS
4 14 (4.93%) Entra ID
4 14 (4.93%) Power Platform
5 9 (3.17%) SaaS
6 8 (2.82%) Azure DevOps
7 6 (2.11%) GCP
8 4 (1.41%) Azure Monitor
8 4 (1.41%) Dynamics 365
8 4 (1.41%) Power Automate
8 4 (1.41%) PowerApps
9 3 (1.06%) Azure Sentinel
9 3 (1.06%) GitHub
9 3 (1.06%) IaaS
9 3 (1.06%) PaaS
9 3 (1.06%) Snowflake
10 2 (0.70%) Amazon EC2
10 2 (0.70%) Amazon S3
10 2 (0.70%) Virtual Private Cloud
Communications & Networking
1 8 (2.82%) HTTP
2 5 (1.76%) 4G
2 5 (1.76%) TCP/IP
2 5 (1.76%) VPN
2 5 (1.76%) WAN
3 4 (1.41%) NAS
4 3 (1.06%) 2G
4 3 (1.06%) 3G
4 3 (1.06%) 5G
4 3 (1.06%) BGP
4 3 (1.06%) Firewall
4 3 (1.06%) LAN
4 3 (1.06%) OSPF
4 3 (1.06%) POP3
4 3 (1.06%) SMTP
4 3 (1.06%) Wireless
5 2 (0.70%) DNS
5 2 (0.70%) SD-WAN
5 2 (0.70%) SMS
5 2 (0.70%) SSL
Database & Business Intelligence
1 14 (4.93%) Power BI
2 7 (2.46%) SQL Server
3 6 (2.11%) MongoDB
4 4 (1.41%) Oracle Database
4 4 (1.41%) Relational Database
4 4 (1.41%) SQL Server Integration Services
4 4 (1.41%) SQL Server Reporting Services
5 3 (1.06%) PostgreSQL
6 2 (0.70%) Amazon RDS
6 2 (0.70%) Data Lake
7 1 (0.35%) DB2
7 1 (0.35%) MS Access
7 1 (0.35%) MySQL
7 1 (0.35%) Sybase ASE
7 1 (0.35%) Tableau
Development Applications
1 27 (9.51%) JIRA
2 5 (1.76%) Jenkins
3 4 (1.41%) Git
4 3 (1.06%) Oracle Forms
5 2 (0.70%) JUnit
5 2 (0.70%) Selenium
6 1 (0.35%) GitLab
6 1 (0.35%) GoCD
6 1 (0.35%) MLflow
6 1 (0.35%) Postman
6 1 (0.35%) Subversion
6 1 (0.35%) Team Foundation Server
6 1 (0.35%) TeamCity
6 1 (0.35%) TestNG
General
1 89 (31.34%) Social Skills
2 62 (21.83%) Finance
3 28 (9.86%) Analytical Skills
4 21 (7.39%) Public Sector
5 19 (6.69%) Banking
6 13 (4.58%) Telecoms
7 9 (3.17%) Legal
8 8 (2.82%) Inclusion and Diversity
8 8 (2.82%) Presentation Skills
9 7 (2.46%) Law
10 6 (2.11%) Documentation Skills
11 4 (1.41%) Billing
11 4 (1.41%) Organisational Skills
11 4 (1.41%) Retail
11 4 (1.41%) Retail Banking
12 3 (1.06%) Military
13 2 (0.70%) Back Office
13 2 (0.70%) Front Office
13 2 (0.70%) Investment Banking
14 1 (0.35%) Marketing
Job Titles
1 55 (19.37%) Developer
2 54 (19.01%) Architect
3 45 (15.85%) ServiceNow Developer
4 38 (13.38%) Analyst
5 35 (12.32%) ServiceNow Architect
6 25 (8.80%) Consultant
7 23 (8.10%) Lead
8 21 (7.39%) Senior
8 21 (7.39%) ServiceNow Consultant
8 21 (7.39%) Solutions Architect
9 15 (5.28%) Service Analyst
10 14 (4.93%) Service Desk Analyst
11 10 (3.52%) Lead Architect
11 10 (3.52%) Security Architect
12 9 (3.17%) Administrator
12 9 (3.17%) Business Analyst
12 9 (3.17%) Designer
12 9 (3.17%) IT Analyst
12 9 (3.17%) Service Manager
12 9 (3.17%) Technical Architect
Libraries, Frameworks & Software Standards
1 33 (11.62%) Web Services
2 28 (9.86%) HTML
3 23 (8.10%) CSS
3 23 (8.10%) REST
4 19 (6.69%) SOAP
5 18 (6.34%) AngularJS
6 16 (5.63%) JSON
7 15 (5.28%) XML
8 11 (3.87%) LDAP
9 10 (3.52%) SailPoint
10 8 (2.82%) Ajax
11 6 (2.11%) .NET
12 5 (1.76%) Bootstrap
13 3 (1.06%) CSS3
13 3 (1.06%) Kafka
13 3 (1.06%) Oracle Fusion
14 2 (0.70%) Murex MxML
14 2 (0.70%) Node.js
15 1 (0.35%) HTML5
15 1 (0.35%) RESTful
Miscellaneous
1 43 (15.14%) CMDB
2 16 (5.63%) Management Information System
3 10 (3.52%) Data Centre
3 10 (3.52%) Onboarding
4 7 (2.46%) Data Protection Act
5 6 (2.11%) CSOC
5 6 (2.11%) Self-Motivation
6 5 (1.76%) Product Ownership
6 5 (1.76%) Smartphone
7 4 (1.41%) Frameworx
7 4 (1.41%) Security Posture
7 4 (1.41%) Team-Oriented Environment
7 4 (1.41%) TM Forum
8 3 (1.06%) Derivative
8 3 (1.06%) Fixed Income
8 3 (1.06%) IoT
8 3 (1.06%) Legacy Systems
9 2 (0.70%) Credit Derivative
9 2 (0.70%) Interest Rate Derivative
9 2 (0.70%) Public Cloud
Operating Systems
1 31 (10.92%) Windows
2 21 (7.39%) Linux
3 13 (4.58%) Windows 10
4 9 (3.17%) Red Hat Enterprise Linux
5 6 (2.11%) Android
5 6 (2.11%) Apple iOS
5 6 (2.11%) VMS
6 3 (1.06%) Windows Server
7 1 (0.35%) Mac OS
7 1 (0.35%) Oracle Linux
7 1 (0.35%) Solaris
Processes & Methodologies
1 91 (32.04%) ITSM
2 84 (29.58%) ITIL
3 66 (23.24%) Agile
4 50 (17.61%) Problem-Solving
5 45 (15.85%) Service Management
6 33 (11.62%) Incident Management
7 30 (10.56%) Customer Service
8 26 (9.15%) Analytics
8 26 (9.15%) Stakeholder Management
9 24 (8.45%) DevOps
10 23 (8.10%) Change Management
10 23 (8.10%) Continuous Improvement
10 23 (8.10%) Roadmaps
11 22 (7.75%) IT Asset Management
12 21 (7.39%) Scrum
13 20 (7.04%) Workflow
14 19 (6.69%) Risk Management
15 18 (6.34%) Stakeholder Engagement
16 17 (5.99%) Process Improvement
17 16 (5.63%) Problem Management
Programming Languages
1 37 (13.03%) JavaScript
2 19 (6.69%) SQL
3 17 (5.99%) PowerShell
4 13 (4.58%) Java
4 13 (4.58%) Python
5 7 (2.46%) C#
6 6 (2.11%) Shell Script
7 4 (1.41%) Bash
8 2 (0.70%) ABAP
8 2 (0.70%) R
9 1 (0.35%) ActionScript
9 1 (0.35%) ActionScript 2.0
9 1 (0.35%) BeanShell
9 1 (0.35%) Bicep
9 1 (0.35%) Go
9 1 (0.35%) Kusto Query Language
9 1 (0.35%) TypeScript
9 1 (0.35%) VBScript
Qualifications
1 44 (15.49%) Security Cleared
2 38 (13.38%) SC Cleared
3 25 (8.80%) Degree
4 13 (4.58%) ITIL Certification
5 6 (2.11%) DV Cleared
6 5 (1.76%) Computer Science Degree
7 4 (1.41%) Cisco Certification
7 4 (1.41%) ITIL Foundation Certificate
8 3 (1.06%) BPSS Clearance
8 3 (1.06%) CCNP
8 3 (1.06%) CISM
8 3 (1.06%) CISSP
8 3 (1.06%) Microsoft Certification
9 2 (0.70%) Azure Certification
10 1 (0.35%) CCNA
10 1 (0.35%) Numerate Degree
10 1 (0.35%) PMP
10 1 (0.35%) TOGAF Certification
10 1 (0.35%) VCAP
10 1 (0.35%) VCDX
Quality Assurance & Compliance
1 15 (5.28%) SLA
2 7 (2.46%) GRC
3 6 (2.11%) ISO/IEC 27001
4 5 (1.76%) QA
5 4 (1.41%) Disclosure Scotland
5 4 (1.41%) GDPR
6 3 (1.06%) Data Quality
7 2 (0.70%) HIPAA
7 2 (0.70%) ISO/IEC 20000
7 2 (0.70%) SOC 2
8 1 (0.35%) ISO 22301
8 1 (0.35%) ISO 31000
8 1 (0.35%) NIST
8 1 (0.35%) Sarbanes-Oxley
System Software
1 28 (9.86%) Active Directory
2 4 (1.41%) Docker
2 4 (1.41%) VMware Infrastructure
3 2 (0.70%) Virtual Machines
4 1 (0.35%) Hyper-V
4 1 (0.35%) Virtual Desktop
4 1 (0.35%) VMware ESXi
4 1 (0.35%) vSphere
Systems Management
1 15 (5.28%) Single Sign-On
2 6 (2.11%) Kubernetes
2 6 (2.11%) Microsoft Intune
3 4 (1.41%) Grafana
3 4 (1.41%) PingFederate
3 4 (1.41%) SCCM
3 4 (1.41%) Terraform
4 3 (1.06%) Ansible
4 3 (1.06%) FortiGate
5 2 (0.70%) HP ALM
5 2 (0.70%) Prometheus
6 1 (0.35%) EMC NetWorker
6 1 (0.35%) Kubeflow
6 1 (0.35%) Netcool
6 1 (0.35%) Opsgenie
6 1 (0.35%) PaperCut
6 1 (0.35%) Rancher
6 1 (0.35%) SCOM
6 1 (0.35%) Tivoli
6 1 (0.35%) Tivoli Storage Manager
Vendors
1 44 (15.49%) Microsoft
2 20 (7.04%) Oracle
3 18 (6.34%) Splunk
4 16 (5.63%) SAP
5 13 (4.58%) Salesforce
6 11 (3.87%) Cisco
6 11 (3.87%) Snow
7 10 (3.52%) CyberArk
8 9 (3.17%) Palo Alto
9 8 (2.82%) Red Hat
10 7 (2.46%) F5
11 6 (2.11%) Fortinet
11 6 (2.11%) IBM
11 6 (2.11%) Qualys
11 6 (2.11%) SolarWinds
12 5 (1.76%) Dynatrace
12 5 (1.76%) VMware
13 4 (1.41%) Ping Identity
13 4 (1.41%) Remedy
13 4 (1.41%) Sybase