Middleware Contracts with Hybrid/Remote/WFH Options

Middleware
UK > Work from Home

The table below provides summary statistics for remote or hybrid contract work requiring Middleware skills. It includes a benchmarking guide to the contractor rates offered in vacancies that cited Middleware over the 6 months leading up to 1 May 2025, comparing them to the same period in the previous two years.

6 months to
1 May 2025
Same period 2024 Same period 2023
Rank 216 232 275
Rank change year-on-year +16 +43 +10
Contract jobs citing Middleware 88 113 209
As % of all contract jobs with a WFH option 0.89% 0.74% 0.81%
As % of the Libraries, Frameworks & Software Standards category 3.43% 3.08% 3.21%
Number of daily rates quoted 63 81 151
10th Percentile £365 £419 £450
25th Percentile £413 £500 £513
Median daily rate (50th Percentile) £465 £582 £600
Median % change year-on-year -20.24% -2.94% +9.09%
75th Percentile £578 £675 £700
90th Percentile £625 £750 £788
UK median daily rate £503 £600 £575
% change year-on-year -16.25% +4.35% -
Number of hourly rates quoted 7 0 0
Median hourly rate £68.00 - -
UK median hourly rate £65.00 £70.00 £65.00
% change year-on-year -7.14% +7.69% +60.04%

All Software Libraries and Frameworks
Work from Home

Middleware falls under the Software Libraries and Frameworks category. For comparison with the information above, the following table provides summary statistics for all contract job vacancies with remote or hybrid options requiring technical specification, industry standards, software libraries and framework skills.

Contract vacancies with a requirement for technical specification, industry standards, software libraries and framework skills 2,564 3,665 6,520
As % of all contract jobs with a WFH option 25.89% 23.88% 25.22%
Number of daily rates quoted 1,870 2,555 4,857
10th Percentile £365 £331 £395
25th Percentile £425 £428 £450
Median daily rate (50th Percentile) £525 £525 £540
Median % change year-on-year - -2.78% -0.46%
75th Percentile £650 £650 £663
90th Percentile £825 £775 £753
UK median daily rate £525 £530 £550
% change year-on-year -0.94% -3.64% -
Number of hourly rates quoted 31 93 80
10th Percentile £52.50 £28.00 £22.50
25th Percentile £61.25 - £42.13
Median hourly rate £65.00 £43.00 £63.25
Median % change year-on-year +51.16% -32.02% +29.08%
75th Percentile £70.25 £62.00 £75.00
90th Percentile £93.75 £72.50 £80.25
UK median hourly rate £65.00 £46.18 £65.00
% change year-on-year +40.75% -28.95% +32.65%

Middleware
Trend for Jobs with a WFH Option

Job vacancies with remote working options citing Middleware as a proportion of all IT jobs advertised.
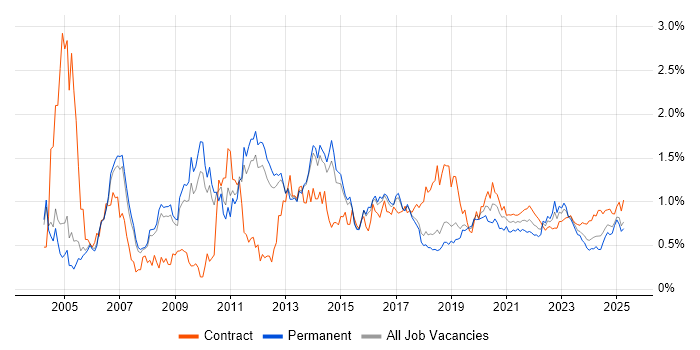
Middleware trend for jobs with Hybrid/Remote/WFH options

Middleware
Daily Rate Trend for Jobs with a WFH Option

3-month moving average daily rate quoted in job vacancies with remote working options citing Middleware.

Middleware daily rate for jobs with a WFH option

Middleware
Daily Rate Histogram for Jobs with a WFH Option

Daily rate distribution for jobs with remote working options citing Middleware over the 6 months to 1 May 2025.

Middleware daily rate histogram for jobs with a WFH option

Middleware
Hourly Rate Trend for Jobs with a WFH Option

3-month moving average hourly rate quoted in job vacancies with remote working options citing Middleware.

Middleware hourly rate for jobs with a WFH option

Middleware
Co-occurring Skills and Capabilities with WFH Options by Category

The follow tables expand on the table above by listing co-occurrences grouped by category. The same employment type, locality and period is covered with up to 20 co-occurrences shown in each of the following categories:

Application Platforms
1 6 (6.82%) CICS
1 6 (6.82%) JBoss
2 5 (5.68%) NetWeaver
3 4 (4.55%) Oracle SOA Suite
3 4 (4.55%) WebSphere
4 3 (3.41%) Anypoint
4 3 (3.41%) CMS
4 3 (3.41%) WebLogic
4 3 (3.41%) WebSphere Application Server
5 1 (1.14%) Confluence
5 1 (1.14%) Headless CMS
Business Applications
1 4 (4.55%) SAP S/4HANA
2 2 (2.27%) Oracle Payables
2 2 (2.27%) SAP SCM
3 1 (1.14%) Dynamics CRM
3 1 (1.14%) Oracle Applications
3 1 (1.14%) Oracle ERP
3 1 (1.14%) SAP EWM
3 1 (1.14%) SAP Payroll
3 1 (1.14%) SAP SD
Cloud Services
1 24 (27.27%) Azure
2 14 (15.91%) GCP
3 11 (12.50%) AWS
4 8 (9.09%) Power Platform
5 6 (6.82%) Power Automate
5 6 (6.82%) PowerApps
6 5 (5.68%) Azure DevOps
6 5 (5.68%) Cloud Computing
6 5 (5.68%) Entra ID
6 5 (5.68%) OCI
7 4 (4.55%) Oracle CX
8 3 (3.41%) Azure API Management
8 3 (3.41%) Cloud Run
8 3 (3.41%) Dynamics 365
9 2 (2.27%) Azure Functions
9 2 (2.27%) Serverless
9 2 (2.27%) SuccessFactors
10 1 (1.14%) Amazon CloudWatch
10 1 (1.14%) Azure Data Factory
10 1 (1.14%) OpenShift
Communications & Networking
1 6 (6.82%) HTTP
2 2 (2.27%) LAN
2 2 (2.27%) WAN
3 1 (1.14%) ATM
3 1 (1.14%) Converged Networks
3 1 (1.14%) HTTPS
3 1 (1.14%) Kerberos
3 1 (1.14%) SSL
Database & Business Intelligence
1 6 (6.82%) MS Access
2 5 (5.68%) Relational Database
3 4 (4.55%) Data Lake
3 4 (4.55%) DB2
3 4 (4.55%) RDBMS
4 3 (3.41%) BigQuery
4 3 (3.41%) SQL Server
5 2 (2.27%) Azure SQL Database
5 2 (2.27%) IMS/DB
5 2 (2.27%) Oracle Database
6 1 (1.14%) Big Data
6 1 (1.14%) Data Warehouse
6 1 (1.14%) MongoDB
6 1 (1.14%) Oracle Exadata
6 1 (1.14%) PostgreSQL
6 1 (1.14%) Power BI
6 1 (1.14%) Tableau
Development Applications
1 5 (5.68%) JIRA
2 4 (4.55%) QARun
2 4 (4.55%) WinRunner
3 2 (2.27%) Git
4 1 (1.14%) Bitbucket
4 1 (1.14%) Gerrit
General
1 31 (35.23%) Social Skills
2 23 (26.14%) Finance
3 13 (14.77%) Analytical Skills
4 12 (13.64%) Banking
5 4 (4.55%) Public Sector
6 3 (3.41%) Investment Banking
6 3 (3.41%) Law
6 3 (3.41%) Marketing
7 2 (2.27%) Automotive
7 2 (2.27%) Billing
7 2 (2.27%) Documentation Skills
7 2 (2.27%) Front Office
7 2 (2.27%) Influencing Skills
7 2 (2.27%) Legal
7 2 (2.27%) Police
7 2 (2.27%) Retail
8 1 (1.14%) Inclusion and Diversity
8 1 (1.14%) Presentation Skills
8 1 (1.14%) Telecoms
Job Titles
1 24 (27.27%) Architect
2 17 (19.32%) Developer
3 15 (17.05%) Solutions Architect
4 10 (11.36%) Consultant
4 10 (11.36%) Senior
5 8 (9.09%) Product Engineer
5 8 (9.09%) Products Support Engineer
5 8 (9.09%) Software Support Engineer
5 8 (9.09%) Support Engineer
6 7 (7.95%) Analyst
6 7 (7.95%) Linux Engineer
6 7 (7.95%) Linux Support
6 7 (7.95%) Linux Support Engineer
7 6 (6.82%) Integration Developer
7 6 (6.82%) SAP Developer
7 6 (6.82%) Senior Analyst
7 6 (6.82%) Senior Test Analyst
7 6 (6.82%) Test Analyst
8 5 (5.68%) Azure Architect
9 4 (4.55%) Senior UAT Analyst
Libraries, Frameworks & Software Standards
1 12 (13.64%) Web Services
2 11 (12.50%) SOAP
3 9 (10.23%) Oracle Fusion
3 9 (10.23%) REST
3 9 (10.23%) XML
4 7 (7.95%) JDBC
4 7 (7.95%) XSLT
5 5 (5.68%) .NET
5 5 (5.68%) EDI
5 5 (5.68%) IDoc
5 5 (5.68%) JMS
5 5 (5.68%) SAP PI
6 4 (4.55%) J2EE
6 4 (4.55%) RESTful
7 3 (3.41%) AngularJS
7 3 (3.41%) IBM Integration Bus
7 3 (3.41%) Microsoft Graph
7 3 (3.41%) React
7 3 (3.41%) WebSphere MQ
8 2 (2.27%) Loki
Miscellaneous
1 6 (6.82%) Mainframe
1 6 (6.82%) Onboarding
1 6 (6.82%) Virtual Team
2 5 (5.68%) Legacy Applications
2 5 (5.68%) Legacy Systems
2 5 (5.68%) Management Information System
3 3 (3.41%) Enterprise Software
3 3 (3.41%) Product Ownership
3 3 (3.41%) SWIFT Messaging Network
4 2 (2.27%) Cloud Native
4 2 (2.27%) Data Protection Act
4 2 (2.27%) Data Structures
4 2 (2.27%) Distributed Applications
4 2 (2.27%) Distributed Architecture
4 2 (2.27%) Fixed Income
4 2 (2.27%) IBM Mainframe
4 2 (2.27%) Public Cloud
4 2 (2.27%) Replication
4 2 (2.27%) SCADA
4 2 (2.27%) VSAM
Operating Systems
1 21 (23.86%) Linux
2 15 (17.05%) Unix
2 15 (17.05%) Windows
3 8 (9.09%) Ubuntu
4 3 (3.41%) Red Hat Enterprise Linux
5 1 (1.14%) Embedded Linux
Processes & Methodologies
1 28 (31.82%) Problem-Solving
2 25 (28.41%) Agile
3 20 (22.73%) DevOps
4 15 (17.05%) Microservices
5 13 (14.77%) System Integration Testing
6 12 (13.64%) CI/CD
6 12 (13.64%) ERP
6 12 (13.64%) User Acceptance Testing
6 12 (13.64%) Waterfall
7 11 (12.50%) Migration
8 10 (11.36%) Analytics
9 9 (10.23%) Logistics
9 9 (10.23%) SDLC
9 9 (10.23%) Software Engineering
10 8 (9.09%) Data Governance
10 8 (9.09%) Scrum
10 8 (9.09%) Test Automation
11 7 (7.95%) Integration Patterns
11 7 (7.95%) Software Testing
11 7 (7.95%) Technical Leadership
Programming Languages
1 19 (21.59%) SQL
2 15 (17.05%) Java
3 14 (15.91%) JavaScript
4 12 (13.64%) Shell Script
5 9 (10.23%) C
5 9 (10.23%) C++
6 8 (9.09%) Ada
7 6 (6.82%) Python
8 5 (5.68%) ABAP
9 4 (4.55%) C#
9 4 (4.55%) PL/SQL
9 4 (4.55%) REXX
10 3 (3.41%) TypeScript
11 2 (2.27%) Apex Code
11 2 (2.27%) Perl
11 2 (2.27%) Ruby
12 1 (1.14%) ActionScript
12 1 (1.14%) ActionScript 2.0
12 1 (1.14%) Bash
12 1 (1.14%) PowerShell
Qualifications
1 9 (10.23%) Security Cleared
2 8 (9.09%) SC Cleared
3 5 (5.68%) TOGAF Certification
4 4 (4.55%) Degree
5 3 (3.41%) Computer Science Degree
6 2 (2.27%) Master's Degree
7 1 (1.14%) AWS Certification
7 1 (1.14%) AWS Certified Solutions Architect
7 1 (1.14%) Azure Certification
7 1 (1.14%) BPSS Clearance
7 1 (1.14%) IBM Certification
7 1 (1.14%) Microsoft Certification
Quality Assurance & Compliance
1 13 (14.77%) QA
2 4 (4.55%) Disclosure Scotland
2 4 (4.55%) GDPR
3 3 (3.41%) ISO/IEC 27001
4 2 (2.27%) PMO
5 1 (1.14%) Accessibility
5 1 (1.14%) California Consumer Privacy Act
5 1 (1.14%) Data Quality
5 1 (1.14%) ISO 20022
System Software
1 7 (7.95%) Active Directory
2 2 (2.27%) Apache ZooKeeper
2 2 (2.27%) Docker
2 2 (2.27%) Veritas Cluster Server
2 2 (2.27%) Virtual Machines
Systems Management
1 4 (4.55%) Kubernetes
2 2 (2.27%) Ansible
2 2 (2.27%) Grafana
2 2 (2.27%) HP ALM
2 2 (2.27%) Prometheus
2 2 (2.27%) Terraform
Vendors
1 22 (25.00%) Microsoft
2 17 (19.32%) Oracle
3 11 (12.50%) SAP
4 9 (10.23%) IBM
4 9 (10.23%) MuleSoft
5 8 (9.09%) Google
5 8 (9.09%) Red Hat
6 6 (6.82%) Citrix
7 4 (4.55%) Dynatrace
8 3 (3.41%) Databricks
8 3 (3.41%) Salesforce
9 2 (2.27%) CyberArk
9 2 (2.27%) HP
9 2 (2.27%) Splunk
9 2 (2.27%) Veritas
9 2 (2.27%) VMware
10 1 (1.14%) DocuSign
10 1 (1.14%) ForgeRock
10 1 (1.14%) IBM Sterling