ERP Contracts with Hybrid/Remote/WFH Options

Enterprise Resource Planning (ERP)
UK > Work from Home

The table below provides summary statistics for remote or hybrid contract work requiring ERP skills. It includes a benchmarking guide to the contractor rates offered in vacancies that cited ERP over the 6 months leading up to 1 May 2025, comparing them to the same period in the previous two years.

6 months to
1 May 2025
Same period 2024 Same period 2023
Rank 91 71 105
Rank change year-on-year -20 +34 +14
Contract jobs citing ERP 273 428 588
As % of all contract jobs with a WFH option 2.76% 2.79% 2.27%
As % of the Processes & Methodologies category 3.03% 3.17% 2.53%
Number of daily rates quoted 170 304 389
10th Percentile £355 £358 £400
25th Percentile £425 £472 £453
Median daily rate (50th Percentile) £544 £550 £550
Median % change year-on-year -1.14% - -
75th Percentile £675 £650 £638
90th Percentile £750 £725 £714
UK median daily rate £538 £550 £550
% change year-on-year -2.27% - -
Number of hourly rates quoted 7 9 9
10th Percentile £64.50 £38.40 £39.55
25th Percentile £65.00 £51.25 £56.25
Median hourly rate £70.00 £55.00 £64.68
Median % change year-on-year +27.27% -14.96% +249.59%
75th Percentile £75.00 £61.25 £75.00
90th Percentile - £86.50 -
UK median hourly rate £71.25 £40.00 £62.50
% change year-on-year +78.13% -36.00% +262.32%

All Process and Methodology Skills
Work from Home

ERP falls under the Processes and Methodologies category. For comparison with the information above, the following table provides summary statistics for all contract job vacancies with remote or hybrid options requiring process or methodology skills.

Contract vacancies with a requirement for process or methodology skills 9,021 13,483 23,229
As % of all contract jobs with a WFH option 91.08% 87.87% 89.84%
Number of daily rates quoted 6,191 8,996 16,418
10th Percentile £340 £325 £363
25th Percentile £419 £425 £450
Median daily rate (50th Percentile) £525 £525 £540
Median % change year-on-year - -2.78% +2.86%
75th Percentile £638 £638 £650
90th Percentile £763 £750 £750
UK median daily rate £520 £525 £550
% change year-on-year -0.95% -4.55% +4.76%
Number of hourly rates quoted 224 579 532
10th Percentile £14.20 £15.17 £19.00
25th Percentile £19.56 £25.25 £30.54
Median hourly rate £39.52 £43.00 £55.00
Median % change year-on-year -8.09% -21.82% +57.14%
75th Percentile £66.13 £60.00 £68.75
90th Percentile £75.00 £75.25 £80.23
UK median hourly rate £29.00 £35.65 £37.30
% change year-on-year -18.65% -4.42% +49.20%

ERP
Trend for Jobs with a WFH Option

Job vacancies with remote working options citing ERP as a proportion of all IT jobs advertised.
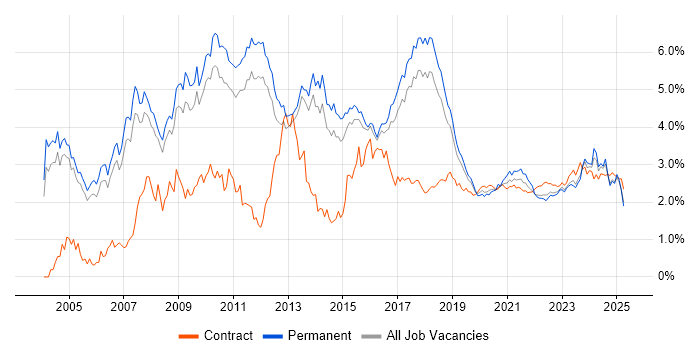
ERP trend for jobs with Hybrid/Remote/WFH options

ERP
Daily Rate Trend for Jobs with a WFH Option

3-month moving average daily rate quoted in job vacancies with remote working options citing ERP.

ERP daily rate for jobs with a WFH option

ERP
Daily Rate Histogram for Jobs with a WFH Option

Daily rate distribution for jobs with remote working options citing ERP over the 6 months to 1 May 2025.

ERP daily rate histogram for jobs with a WFH option

ERP
Hourly Rate Trend for Jobs with a WFH Option

3-month moving average hourly rate quoted in job vacancies with remote working options citing ERP.

ERP hourly rate for jobs with a WFH option

ERP
Co-occurring Skills and Capabilities with WFH Options by Category

The follow tables expand on the table above by listing co-occurrences grouped by category. The same employment type, locality and period is covered with up to 20 co-occurrences shown in each of the following categories:

Application Platforms
1 4 (1.47%) Confluence
1 4 (1.47%) Oracle SOA Suite
2 2 (0.73%) CMS
2 2 (0.73%) NetWeaver
2 2 (0.73%) SAP EP
3 1 (0.37%) Drupal
3 1 (0.37%) FactoryTalk
3 1 (0.37%) Microsoft Exchange
3 1 (0.37%) Oracle Workflow
3 1 (0.37%) SharePoint
3 1 (0.37%) Sitecore CMS
Applications
1 15 (5.49%) Microsoft Excel
2 3 (1.10%) Oracle Smart View
3 2 (0.73%) Microsoft Project
4 1 (0.37%) Microsoft Office
4 1 (0.37%) Microsoft PowerPoint
4 1 (0.37%) Trello
Business Applications
1 31 (11.36%) SAP S/4HANA
2 24 (8.79%) Oracle ERP
3 11 (4.03%) Oracle EBS
3 11 (4.03%) SAP ERP
4 8 (2.93%) Unit4 Business World
5 7 (2.56%) Infor LN
5 7 (2.56%) NetSuite
5 7 (2.56%) Oracle Payables
6 5 (1.83%) Dynamics CRM
6 5 (1.83%) Oracle Financials
7 3 (1.10%) Oracle Assets
7 3 (1.10%) Oracle General Ledger
7 3 (1.10%) Oracle Procure-to-Pay
7 3 (1.10%) Oracle Receivables
7 3 (1.10%) SAP MDG
7 3 (1.10%) SAP SD
8 2 (0.73%) iTrent
8 2 (0.73%) Oracle Cash Management
8 2 (0.73%) Oracle EBS R12
8 2 (0.73%) SAP FSCM
Cloud Services
1 31 (11.36%) Azure
2 29 (10.62%) OCI
3 16 (5.86%) SaaS
4 15 (5.49%) Power Platform
5 13 (4.76%) Dynamics 365
6 10 (3.66%) AWS
7 8 (2.93%) Azure Data Factory
8 7 (2.56%) Azure DevOps
8 7 (2.56%) Power Automate
8 7 (2.56%) PowerApps
9 5 (1.83%) Azure Synapse Analytics
9 5 (1.83%) BigCommerce
9 5 (1.83%) GCP
9 5 (1.83%) IBM Blueworks
9 5 (1.83%) Microsoft 365
9 5 (1.83%) SuccessFactors
10 4 (1.47%) Oracle CX
11 2 (0.73%) Azure Logic Apps
11 2 (0.73%) Boomi
12 1 (0.37%) Azure Service Bus
Communications & Networking
1 1 (0.37%) Ethernet
1 1 (0.37%) Firewall
1 1 (0.37%) Intranet
1 1 (0.37%) S/MIME
1 1 (0.37%) SSL
1 1 (0.37%) Wireless
Database & Business Intelligence
1 10 (3.66%) Oracle Reports
2 9 (3.30%) Data Lake
2 9 (3.30%) Oracle Database
3 8 (2.93%) Oracle BI Publisher
3 8 (2.93%) Power BI
3 8 (2.93%) SQL Server
4 7 (2.56%) Data Warehouse
5 3 (1.10%) SQL Server Integration Services
5 3 (1.10%) SQL Server Reporting Services
6 2 (0.73%) Azure SQL Database
6 2 (0.73%) Metadata
6 2 (0.73%) Metadata Repository
6 2 (0.73%) Power Query
6 2 (0.73%) SAP HANA
7 1 (0.37%) Data Hub
7 1 (0.37%) MongoDB
7 1 (0.37%) NoSQL
7 1 (0.37%) PowerPivot
7 1 (0.37%) SAP Data Services
7 1 (0.37%) Tableau
Development Applications
1 13 (4.76%) JIRA
2 1 (0.37%) ERwin
2 1 (0.37%) GCC
2 1 (0.37%) Hudson
2 1 (0.37%) Jenkins
2 1 (0.37%) JMeter
2 1 (0.37%) LoadRunner
2 1 (0.37%) LSMW
2 1 (0.37%) NeoLoad
2 1 (0.37%) Oracle Forms
2 1 (0.37%) Postman
2 1 (0.37%) PowerDesigner
2 1 (0.37%) TestRail
General
1 113 (41.39%) Finance
2 87 (31.87%) Social Skills
3 48 (17.58%) Analytical Skills
4 39 (14.29%) Manufacturing
5 21 (7.69%) Public Sector
5 21 (7.69%) Retail
6 9 (3.30%) Automotive
7 7 (2.56%) Marketing
8 6 (2.20%) Billing
8 6 (2.20%) Law
9 5 (1.83%) Aerospace
9 5 (1.83%) Legal
9 5 (1.83%) Local Government
9 5 (1.83%) Presentation Skills
10 4 (1.47%) Back Office
10 4 (1.47%) Banking
10 4 (1.47%) German Language
10 4 (1.47%) Influencing Skills
10 4 (1.47%) Polish Language
11 3 (1.10%) Documentation Skills
Job Titles
1 56 (20.51%) Consultant
2 34 (12.45%) Analyst
2 34 (12.45%) Lead
3 30 (10.99%) Architect
4 23 (8.42%) Business Analyst
5 20 (7.33%) Developer
5 20 (7.33%) Project Manager
6 15 (5.49%) ERP Consultant
7 14 (5.13%) Oracle Consultant
8 13 (4.76%) Solutions Architect
9 12 (4.40%) ERP Manager
10 10 (3.66%) SAP Manager
11 8 (2.93%) ERP Implementation Consultant
11 8 (2.93%) Implementation Consultant
12 7 (2.56%) Data Steward
12 7 (2.56%) IFS Developer
12 7 (2.56%) Infor Consultant
12 7 (2.56%) SAP Architect
12 7 (2.56%) SAP Consultant
12 7 (2.56%) Test Manager
Libraries, Frameworks & Software Standards
1 40 (14.65%) Oracle Fusion
2 12 (4.40%) Middleware
3 7 (2.56%) XML
4 4 (1.47%) SAP Fiori
4 4 (1.47%) SAP PI
4 4 (1.47%) Web Services
5 3 (1.10%) PySpark
5 3 (1.10%) REST
5 3 (1.10%) SailPoint
5 3 (1.10%) SOAP
6 2 (0.73%) .NET
6 2 (0.73%) BAPI
6 2 (0.73%) OAuth
6 2 (0.73%) SAML
6 2 (0.73%) SAPUI5
7 1 (0.37%) JSON
7 1 (0.37%) OAuth2
7 1 (0.37%) OpenID
7 1 (0.37%) RESTful
7 1 (0.37%) WebCenter
Miscellaneous
1 14 (5.13%) Legacy Systems
2 10 (3.66%) Onboarding
3 9 (3.30%) Management Information System
4 6 (2.20%) Manufacturing Execution System
5 4 (1.47%) Data Structures
5 4 (1.47%) Enterprise Software
5 4 (1.47%) FMCG
5 4 (1.47%) Life Science
6 3 (1.10%) Greenfield Project
6 3 (1.10%) Industry 4.0
6 3 (1.10%) Self-Motivation
7 2 (0.73%) Product Ownership
7 2 (0.73%) Virtual Team
8 1 (0.37%) Augmented Reality
8 1 (0.37%) Data Protection Act
8 1 (0.37%) Hybrid Cloud
8 1 (0.37%) PMI
8 1 (0.37%) Private Cloud
8 1 (0.37%) Renewable Energy
8 1 (0.37%) SCADA
Operating Systems
1 1 (0.37%) OpenVMS
1 1 (0.37%) Windows
1 1 (0.37%) Windows Server 2019
Processes & Methodologies
1 72 (26.37%) Migration
2 55 (20.15%) Problem-Solving
3 45 (16.48%) Project Management
4 41 (15.02%) Stakeholder Management
5 36 (13.19%) Data Migration
6 34 (12.45%) Agile
7 29 (10.62%) CRM
8 26 (9.52%) Analytics
9 23 (8.42%) Data Management
9 23 (8.42%) DevOps
10 22 (8.06%) Change Management
11 21 (7.69%) Business Intelligence
12 20 (7.33%) Stakeholder Engagement
13 18 (6.59%) Data Modelling
13 18 (6.59%) User Acceptance Testing
13 18 (6.59%) Validation
14 16 (5.86%) Data Governance
14 16 (5.86%) Requirements Gathering
15 15 (5.49%) Decision-Making
15 15 (5.49%) E-Commerce
Programming Languages
1 40 (14.65%) SQL
2 18 (6.59%) PL/SQL
3 7 (2.56%) Java
4 4 (1.47%) ABAP
5 3 (1.10%) Apex Code
5 3 (1.10%) Python
6 2 (0.73%) C#
6 2 (0.73%) JavaScript
6 2 (0.73%) T-SQL
6 2 (0.73%) VBA
7 1 (0.37%) PeopleCode
7 1 (0.37%) PowerShell
7 1 (0.37%) ProC
7 1 (0.37%) VB
7 1 (0.37%) VB6
Qualifications
1 29 (10.62%) Degree
2 20 (7.33%) Security Cleared
3 14 (5.13%) SC Cleared
4 10 (3.66%) BPSS Clearance
5 8 (2.93%) PMP
6 6 (2.20%) Computer Science Degree
7 5 (1.83%) TOGAF Certification
8 4 (1.47%) ACCA
8 4 (1.47%) Master's Degree
9 3 (1.10%) PMI Certification
10 2 (0.73%) CCAB
10 2 (0.73%) CIMA
10 2 (0.73%) CIPFA
10 2 (0.73%) CISSP
10 2 (0.73%) DV Cleared
11 1 (0.37%) APMG
11 1 (0.37%) APMP
11 1 (0.37%) CTC Cleared
11 1 (0.37%) ISTQB
11 1 (0.37%) PRINCE2 Practitioner
Quality Assurance & Compliance
1 12 (4.40%) Data Quality
2 8 (2.93%) QA
3 7 (2.56%) GDPR
3 7 (2.56%) PMO
4 5 (1.83%) Sarbanes-Oxley
5 3 (1.10%) Accessibility
5 3 (1.10%) HIPAA
6 2 (0.73%) ISO/IEC 27001
7 1 (0.37%) COBIT
7 1 (0.37%) COSO
7 1 (0.37%) GRC
7 1 (0.37%) GxP
7 1 (0.37%) ITGC
7 1 (0.37%) SOC 2
System Software
1 4 (1.47%) Active Directory
2 1 (0.37%) VMware ESXi
Systems Management
1 4 (1.47%) MOM
2 2 (0.73%) Single Sign-On
Vendors
1 85 (31.14%) Oracle
2 74 (27.11%) SAP
3 41 (15.02%) Microsoft
4 17 (6.23%) Salesforce
5 16 (5.86%) IFS
6 14 (5.13%) Workday
7 7 (2.56%) Infor
8 6 (2.20%) Ariba
9 5 (1.83%) IBM
10 4 (1.47%) Informatica
10 4 (1.47%) Rockwell
10 4 (1.47%) Siemens
11 2 (0.73%) Adaptive Insights
11 2 (0.73%) Atlassian
11 2 (0.73%) HubSpot
11 2 (0.73%) Liquidlogic
11 2 (0.73%) ReadSoft
12 1 (0.37%) AVEVA
12 1 (0.37%) MuleSoft
12 1 (0.37%) Sitecore