Continuous Improvement Jobs in the City of London

Continual Improvement
Central London > City of London

The table below provides summary statistics for permanent job vacancies advertised in the City of London requiring Continuous Improvement skills. It includes a benchmarking guide to the annual salaries offered in vacancies that cited Continuous Improvement over the 6 months leading up to 20 September 2024, comparing them to the same period in the previous two years.

6 months to
20 Sep 2024
Same period 2023 Same period 2022
Rank 20 86 73
Rank change year-on-year +66 -13 +18
Permanent jobs citing Continuous Improvement 300 117 325
As % of all permanent jobs advertised in the City of London 9.69% 3.23% 4.23%
As % of the Processes & Methodologies category 10.35% 3.38% 4.41%
Number of salaries quoted 155 97 267
10th Percentile £48,500 £42,750 £46,250
25th Percentile £56,250 £55,000 £60,000
Median annual salary (50th Percentile) £70,000 £72,500 £70,000
Median % change year-on-year -3.45% +3.57% -6.67%
75th Percentile £90,000 £107,500 £90,000
90th Percentile £117,500 £125,000 £103,750
Central London median annual salary £70,000 £82,500 £70,000
% change year-on-year -15.15% +17.86% -

All Process and Methodology Skills
City of London

Continuous Improvement falls under the Processes and Methodologies category. For comparison with the information above, the following table provides summary statistics for all permanent job vacancies requiring process or methodology skills in the City of London.

Permanent vacancies with a requirement for process or methodology skills 2,899 3,464 7,370
As % of all permanent jobs advertised in the City of London 93.67% 95.58% 95.81%
Number of salaries quoted 1,825 2,922 5,622
10th Percentile £42,598 £42,500 £45,025
25th Percentile £55,000 £55,000 £56,250
Median annual salary (50th Percentile) £75,000 £75,000 £72,500
Median % change year-on-year - +3.45% -
75th Percentile £95,000 £96,250 £95,000
90th Percentile £112,500 £117,375 £110,000
Central London median annual salary £72,500 £73,250 £72,500
% change year-on-year -1.02% +1.03% +3.57%

Continuous Improvement
Job Vacancy Trend in the City of London

Job postings citing Continuous Improvement as a proportion of all IT jobs advertised in the City of London.
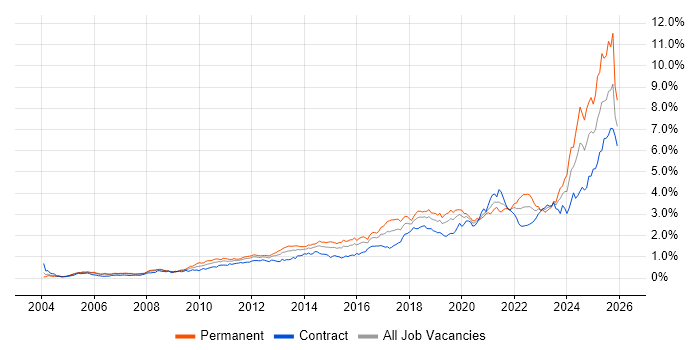
Job vacancy trend for Continuous Improvement in the City of London

Continuous Improvement
Salary Trend in the City of London

3-month moving average salary quoted in jobs citing Continuous Improvement in the City of London.

Salary trend for Continuous Improvement in the City of London

Continuous Improvement
Salary Histogram in the City of London

Salary distribution for jobs citing Continuous Improvement in the City of London over the 6 months to 20 September 2024.

Salary histogram for Continuous Improvement in the City of London

Continuous Improvement
Job Locations in the City of London

The table below looks at the demand and provides a guide to the median salaries quoted in IT jobs citing Continuous Improvement within the City of London region over the 6 months to 20 September 2024. The 'Rank Change' column provides an indication of the change in demand within each location based on the same 6 month period last year.

Location Rank Change
on Same Period
Last Year
Matching
Permanent
IT Job Ads
Median Salary
Past 6 Months
Median Salary
% Change
on Same Period
Last Year
Live
Jobs
London Bridge - 2 £76,250 -
Continuous Improvement
Central London

Continuous Improvement
Co-occurring Skills and Capabilities in the City of London by Category

The follow tables expand on the table above by listing co-occurrences grouped by category. The same employment type, locality and period is covered with up to 20 co-occurrences shown in each of the following categories:

Application Platforms
1 10 (3.33%) CMS
1 10 (3.33%) Drupal
2 5 (1.67%) SharePoint
3 4 (1.33%) Microsoft Exchange
4 3 (1.00%) Confluence
4 3 (1.00%) WordPress
5 2 (0.67%) Cloud Foundry
5 2 (0.67%) SAS
6 1 (0.33%) Adobe Experience Manager
Applications
1 12 (4.00%) Microsoft Excel
2 10 (3.33%) Microsoft Office
3 7 (2.33%) Chatbot
4 5 (1.67%) Microsoft PowerPoint
5 4 (1.33%) MS Visio
6 2 (0.67%) 3ds Max
6 2 (0.67%) AutoCAD
7 1 (0.33%) Microsoft Project
Business Applications
1 11 (3.67%) Remedy ITSM
2 7 (2.33%) Dynamics CRM
3 5 (1.67%) CiviCRM
4 1 (0.33%) Oracle ERP
4 1 (0.33%) Payment Gateway
Cloud Services
1 71 (23.67%) Azure
2 43 (14.33%) GCP
3 34 (11.33%) Microsoft 365
4 32 (10.67%) AWS
4 32 (10.67%) Power Platform
5 23 (7.67%) Dynamics 365
6 20 (6.67%) Power Automate
6 20 (6.67%) PowerApps
7 17 (5.67%) Entra ID
8 11 (3.67%) Azure Monitor
8 11 (3.67%) Azure Storage
9 10 (3.33%) Azure DevOps
9 10 (3.33%) Cloud Computing
10 7 (2.33%) Azure Data Factory
11 5 (1.67%) Amazon ECS
11 5 (1.67%) Azure Synapse Analytics
11 5 (1.67%) SaaS
12 4 (1.33%) GitHub
12 4 (1.33%) OneDrive
13 3 (1.00%) WhatsApp
Communications & Networking
1 73 (24.33%) Broadband
2 13 (4.33%) Firewall
3 10 (3.33%) NAS
4 9 (3.00%) TCP/IP
5 7 (2.33%) BGP
5 7 (2.33%) OSPF
5 7 (2.33%) VLAN
6 5 (1.67%) Network Security
7 4 (1.33%) Wireless
8 3 (1.00%) Intrusion Detection
8 3 (1.00%) ISDN
8 3 (1.00%) Unified Communications
8 3 (1.00%) VPN
8 3 (1.00%) WebEx
9 2 (0.67%) DHCP
9 2 (0.67%) DNS
9 2 (0.67%) Internet
9 2 (0.67%) Structured Cabling
10 1 (0.33%) Intranet
10 1 (0.33%) VSAN
Database & Business Intelligence
1 37 (12.33%) Data Hub
2 12 (4.00%) SQL Server
3 11 (3.67%) Power BI
4 9 (3.00%) MySQL
5 7 (2.33%) Data Warehouse
6 5 (1.67%) Metabase
6 5 (1.67%) MS Access
7 4 (1.33%) PostgreSQL
7 4 (1.33%) Relational Database
7 4 (1.33%) SQL Server Integration Services
8 3 (1.00%) Data Mining
9 2 (0.67%) Amazon RDS
9 2 (0.67%) Azure SQL Database
9 2 (0.67%) Big Data
9 2 (0.67%) Data Lake
9 2 (0.67%) NoSQL
9 2 (0.67%) Star Schema
9 2 (0.67%) Tableau
Development Applications
1 9 (3.00%) Git
2 7 (2.33%) JIRA
3 5 (1.67%) NUnit
3 5 (1.67%) Selenium
3 5 (1.67%) SpecFlow
4 3 (1.00%) Cucumber
4 3 (1.00%) Vite
5 2 (0.67%) Atlassian Bamboo
5 2 (0.67%) Team Foundation Server
5 2 (0.67%) Visual Studio
6 1 (0.33%) CircleCI
6 1 (0.33%) Jenkins
6 1 (0.33%) Octopus Deploy
6 1 (0.33%) SonarQube
6 1 (0.33%) TeamCity
6 1 (0.33%) Terragrunt
General
1 159 (53.00%) Social Skills
2 97 (32.33%) Finance
3 91 (30.33%) Analytical Skills
4 42 (14.00%) Influencing Skills
5 24 (8.00%) Law
6 14 (4.67%) Public Sector
7 12 (4.00%) Inclusion and Diversity
7 12 (4.00%) Presentation Skills
8 11 (3.67%) Legal
9 9 (3.00%) Banking
10 4 (1.33%) Marketing
11 3 (1.00%) Advertising
11 3 (1.00%) Financial Institution
11 3 (1.00%) Investment Banking
11 3 (1.00%) Manufacturing
11 3 (1.00%) Organisational Skills
12 2 (0.67%) Retail
13 1 (0.33%) Telecoms
Job Titles
1 75 (25.00%) Analyst
2 64 (21.33%) Senior
3 56 (18.67%) Lead
4 39 (13.00%) Senior Analyst
5 34 (11.33%) IT Analyst
6 29 (9.67%) Audit Analyst
7 27 (9.00%) Developer
8 26 (8.67%) Team Leader
9 15 (5.00%) Azure Engineer
10 14 (4.67%) Cloud Engineer
11 11 (3.67%) Principal Engineer
12 10 (3.33%) Linux Engineer
13 9 (3.00%) Power Platform Developer
13 9 (3.00%) Project Manager
13 9 (3.00%) Site Reliability Engineer
13 9 (3.00%) Support Analyst
14 8 (2.67%) Product Owner
15 7 (2.33%) Incident Analyst
15 7 (2.33%) Portfolio Analyst
15 7 (2.33%) Senior Product Owner
Libraries, Frameworks & Software Standards
1 25 (8.33%) Elastic Stack
2 13 (4.33%) CSS
2 13 (4.33%) HTML
3 11 (3.67%) React
4 8 (2.67%) AngularJS
5 7 (2.33%) .NET
6 6 (2.00%) XML
7 5 (1.67%) JSON
8 4 (1.33%) .NET Framework
8 4 (1.33%) Entity Framework
9 3 (1.00%) .NET Core
9 3 (1.00%) ARM Templates
9 3 (1.00%) GraphQL
9 3 (1.00%) Jest
9 3 (1.00%) JWT
9 3 (1.00%) Node.js
9 3 (1.00%) Playwright
9 3 (1.00%) REST
9 3 (1.00%) RESTful
9 3 (1.00%) Tailwind CSS
Miscellaneous
1 25 (8.33%) Private Cloud
2 17 (5.67%) Linux Command Line
2 17 (5.67%) Management Information System
2 17 (5.67%) Self-Motivation
3 15 (5.00%) Public Cloud
4 14 (4.67%) Data Centre
4 14 (4.67%) Onboarding
5 12 (4.00%) Product Ownership
6 10 (3.33%) Enterprise Software
7 9 (3.00%) Security Posture
8 8 (2.67%) Cyber Threat
9 6 (2.00%) Cloud Native
9 6 (2.00%) CMDB
9 6 (2.00%) Robotics
10 5 (1.67%) Hybrid Cloud
11 4 (1.33%) Video Conferencing
12 3 (1.00%) Driving Licence
13 2 (0.67%) iPhone
13 2 (0.67%) Operational Technology
13 2 (0.67%) Reinsurance
Operating Systems
1 51 (17.00%) Linux
2 33 (11.00%) Windows
3 15 (5.00%) Windows Server
4 7 (2.33%) Windows 10
4 7 (2.33%) Windows Server 2016
5 4 (1.33%) Mac OS
6 2 (0.67%) Android
6 2 (0.67%) Apple iOS
6 2 (0.67%) CentOS
6 2 (0.67%) Red Hat Enterprise Linux
6 2 (0.67%) Ubuntu
6 2 (0.67%) VMS
6 2 (0.67%) Windows Server 2019
7 1 (0.33%) Unix
7 1 (0.33%) Windows Server 2012
Processes & Methodologies
1 133 (44.33%) Problem-Solving
2 64 (21.33%) Analytics
3 62 (20.67%) Data Management
4 61 (20.33%) DevOps
5 56 (18.67%) Data Analysis
6 55 (18.33%) CI/CD
7 52 (17.33%) Roadmaps
8 50 (16.67%) Customer Experience
9 46 (15.33%) Agile
9 46 (15.33%) Mentoring
10 38 (12.67%) Data Governance
10 38 (12.67%) Data Transformation
11 36 (12.00%) Deployment Automation
11 36 (12.00%) Site Reliability Engineering
12 34 (11.33%) Computer Science
12 34 (11.33%) Stakeholder Management
12 34 (11.33%) Validation
13 33 (11.00%) ITSM
14 32 (10.67%) Change Management
14 32 (10.67%) Continuous Integration
Programming Languages
1 52 (17.33%) Bash
2 35 (11.67%) Python
3 30 (10.00%) SQL
4 26 (8.67%) PowerShell
5 25 (8.33%) Shell Script
6 14 (4.67%) C#
6 14 (4.67%) JavaScript
7 11 (3.67%) Java
8 10 (3.33%) TypeScript
9 2 (0.67%) Bicep
9 2 (0.67%) Data Analysis Expressions
9 2 (0.67%) Kotlin
9 2 (0.67%) Perl
9 2 (0.67%) X++
10 1 (0.33%) PHP
10 1 (0.33%) Rust
Qualifications
1 49 (16.33%) Degree
2 41 (13.67%) CISA
3 36 (12.00%) Master's Degree
4 32 (10.67%) Computer Science Degree
5 25 (8.33%) LPIC
5 25 (8.33%) RHCSA
6 16 (5.33%) Azure Certification
7 14 (4.67%) Security Cleared
8 8 (2.67%) ITIL Certification
9 5 (1.67%) CCNP
9 5 (1.67%) Cisco Certification
9 5 (1.67%) ISEB
9 5 (1.67%) ISTQB
9 5 (1.67%) JNCIP
9 5 (1.67%) MBA
9 5 (1.67%) Six Sigma Black Belt
10 4 (1.33%) AWS Certification
10 4 (1.33%) CISM
10 4 (1.33%) PMI Certification
10 4 (1.33%) PMP
Quality Assurance & Compliance
1 40 (13.33%) Sarbanes-Oxley
2 33 (11.00%) NIST
3 25 (8.33%) SOC 2
4 16 (5.33%) QA
5 14 (4.67%) ISO/IEC 27001
6 7 (2.33%) PCI DSS
7 5 (1.67%) Data Quality
8 4 (1.33%) GDPR
8 4 (1.33%) HIPAA
9 3 (1.00%) COBIT
9 3 (1.00%) FISMA
9 3 (1.00%) GLBA
9 3 (1.00%) SLA
10 2 (0.67%) Cyber Essentials
10 2 (0.67%) GRC
11 1 (0.33%) ISO 22301
System Software
1 37 (12.33%) Docker
2 26 (8.67%) Active Directory
3 9 (3.00%) VMware Infrastructure
4 6 (2.00%) NFS
5 3 (1.00%) VMware ESXi
6 2 (0.67%) Virtual Machines
6 2 (0.67%) vSphere
Systems Management
1 31 (10.33%) Ansible
2 25 (8.33%) Grafana
2 25 (8.33%) Prometheus
3 16 (5.33%) Kubernetes
4 5 (1.67%) Microsoft Intune
4 5 (1.67%) Puppet
5 4 (1.33%) SCCM
5 4 (1.33%) Terraform
6 3 (1.00%) CASB
6 3 (1.00%) Cisco Prime
6 3 (1.00%) FortiGate
6 3 (1.00%) Single Sign-On
6 3 (1.00%) vCenter Server
7 2 (0.67%) Microsoft Clustering
7 2 (0.67%) Progress Chef
7 2 (0.67%) Salt
8 1 (0.33%) cPanel
8 1 (0.33%) Jamf Pro
Vendors
1 77 (25.67%) Microsoft
2 41 (13.67%) Google
3 22 (7.33%) Cisco
4 15 (5.00%) Remedy
5 13 (4.33%) VMware
6 12 (4.00%) ServiceNow
7 11 (3.67%) BMC
8 9 (3.00%) Databricks
8 9 (3.00%) Palo Alto
9 7 (2.33%) Fortinet
9 7 (2.33%) iManage
10 5 (1.67%) Juniper
10 5 (1.67%) Minitab
10 5 (1.67%) SolarWinds
11 4 (1.33%) Extreme Networks
11 4 (1.33%) Sony
12 3 (1.00%) Adobe
12 3 (1.00%) HP
12 3 (1.00%) Oracle
12 3 (1.00%) Zoho