Presales Jobs in the City of London

Presales
Central London > City of London

The table below provides summary statistics for permanent job vacancies advertised in the City of London requiring Presales skills. It includes a benchmarking guide to the annual salaries offered in vacancies that cited Presales over the 6 months leading up to 17 May 2025, comparing them to the same period in the previous two years.

6 months to
17 May 2025
Same period 2024 Same period 2023
Rank 105 97 126
Rank change year-on-year -8 +29 +85
Permanent jobs citing Presales 33 87 106
As % of all permanent jobs advertised in the City of London 1.62% 2.60% 2.31%
As % of the Processes & Methodologies category 1.69% 2.83% 2.43%
Number of salaries quoted 22 46 30
10th Percentile £61,250 £56,250 £61,250
25th Percentile £67,500 £68,750 £67,500
Median annual salary (50th Percentile) £92,500 £85,000 £85,000
Median % change year-on-year +8.82% - +21.43%
75th Percentile £105,938 £103,125 £105,000
90th Percentile £118,625 £113,750 £125,000
Central London median annual salary £95,000 £80,000 £85,000
% change year-on-year +18.75% -5.88% +21.43%

All Process and Methodology Skills
City of London

Presales falls under the Processes and Methodologies category. For comparison with the information above, the following table provides summary statistics for all permanent job vacancies requiring process or methodology skills in the City of London.

Permanent vacancies with a requirement for process or methodology skills 1,955 3,074 4,370
As % of all permanent jobs advertised in the City of London 95.97% 91.95% 95.19%
Number of salaries quoted 1,479 2,417 3,651
10th Percentile £41,750 £41,250 £42,750
25th Percentile £53,750 £55,000 £56,250
Median annual salary (50th Percentile) £75,000 £75,000 £75,000
Median % change year-on-year - - +3.45%
75th Percentile £97,500 £95,000 £98,000
90th Percentile £120,000 £112,500 £115,000
Central London median annual salary £75,000 £72,500 £75,000
% change year-on-year +3.45% -3.33% +3.45%

Presales
Job Vacancy Trend in the City of London

Job postings citing Presales as a proportion of all IT jobs advertised in the City of London.
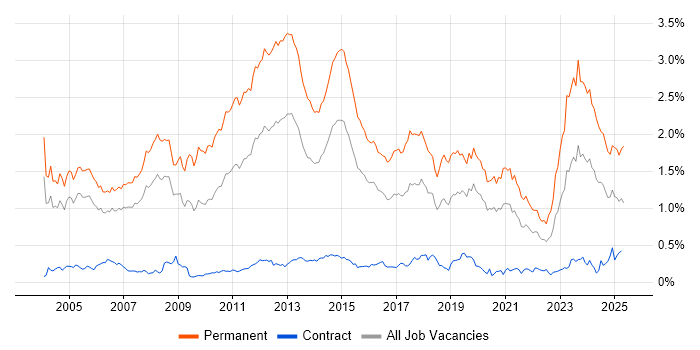
Job vacancy trend for Presales in the City of London

Presales
Salary Trend in the City of London

3-month moving average salary quoted in jobs citing Presales in the City of London.

Salary trend for Presales in the City of London

Presales
Salary Histogram in the City of London

Salary distribution for jobs citing Presales in the City of London over the 6 months to 17 May 2025.

Salary histogram for Presales in the City of London

Presales
Job Locations in the City of London

The table below looks at the demand and provides a guide to the median salaries quoted in IT jobs citing Presales within the City of London region over the 6 months to 17 May 2025. The 'Rank Change' column provides an indication of the change in demand within each location based on the same 6 month period last year.

Location Rank Change
on Same Period
Last Year
Matching
Permanent
IT Job Ads
Median Salary
Past 6 Months
Median Salary
% Change
on Same Period
Last Year
Live
Jobs
London Bridge - 5 - -
Presales
Central London

Presales
Co-occurring Skills and Capabilities in the City of London by Category

The follow tables expand on the table above by listing co-occurrences grouped by category. The same employment type, locality and period is covered with up to 20 co-occurrences shown in each of the following categories:

Application Platforms
1 1 (3.03%) Oracle SOA Suite
Applications
1 3 (9.09%) Microsoft Excel
1 3 (9.09%) MS Visio
Business Applications
1 3 (9.09%) Dynamics CRM
2 2 (6.06%) Oracle EBS
2 2 (6.06%) SAP S/4HANA
3 1 (3.03%) SAP CO
3 1 (3.03%) SAP FI
3 1 (3.03%) SAP FI/CO
Cloud Services
1 11 (33.33%) Azure
2 9 (27.27%) AWS
3 6 (18.18%) GCP
4 5 (15.15%) AWS CloudFormation
4 5 (15.15%) Dynamics 365
4 5 (15.15%) Pulumi
5 4 (12.12%) Power Platform
6 3 (9.09%) PowerApps
6 3 (9.09%) SaaS
7 2 (6.06%) Azure Logic Apps
7 2 (6.06%) IaaS
7 2 (6.06%) OCI
7 2 (6.06%) PaaS
7 2 (6.06%) Serverless
8 1 (3.03%) Amazon CloudWatch
8 1 (3.03%) Amazon Macie
8 1 (3.03%) AWS CloudTrail
8 1 (3.03%) Entra ID
8 1 (3.03%) Microsoft 365
8 1 (3.03%) Microsoft Purview
Communications & Networking
1 1 (3.03%) Firewall
1 1 (3.03%) VPN
Database & Business Intelligence
1 3 (9.09%) SQL Server
2 2 (6.06%) SQL Server Reporting Services
3 1 (3.03%) Oracle ODI
3 1 (3.03%) Power BI
3 1 (3.03%) SAP BW
3 1 (3.03%) SAP HANA
Development Applications
1 1 (3.03%) Eclipse
General
1 14 (42.42%) Social Skills
2 8 (24.24%) Finance
3 4 (12.12%) Presentation Skills
4 3 (9.09%) Law
4 3 (9.09%) Marketing
4 3 (9.09%) Public Sector
5 2 (6.06%) Automotive
6 1 (3.03%) Advertising
6 1 (3.03%) Analytical Skills
6 1 (3.03%) Banking
6 1 (3.03%) Inclusion and Diversity
6 1 (3.03%) Retail
6 1 (3.03%) Telecoms
Job Titles
1 13 (39.39%) Architect
2 9 (27.27%) Solutions Architect
3 8 (24.24%) Consultant
4 6 (18.18%) Senior
5 5 (15.15%) Oracle Consultant
6 4 (12.12%) Senior Consultant
7 3 (9.09%) Audio Visual Engineer
7 3 (9.09%) Dynamics 365 Architect
7 3 (9.09%) Dynamics 365 Solution Architect
7 3 (9.09%) Salesforce Architect
7 3 (9.09%) Salesforce Solution Architect
7 3 (9.09%) Site Reliability Engineer
8 2 (6.06%) Functional Consultant
8 2 (6.06%) Infrastructure Portfolio Manager
8 2 (6.06%) IT Infrastructure Manager
8 2 (6.06%) IT Manager
8 2 (6.06%) Lead
8 2 (6.06%) Platform Engineer
8 2 (6.06%) Presales Solution Architect
8 2 (6.06%) Senior Platform Engineer
Libraries, Frameworks & Software Standards
1 5 (15.15%) Loki
2 3 (9.09%) .NET
3 2 (6.06%) .NET Framework
3 2 (6.06%) Oracle Fusion
4 1 (3.03%) ASP.NET Web API
4 1 (3.03%) CSS
4 1 (3.03%) Entity Framework
4 1 (3.03%) HTML
4 1 (3.03%) JSON
4 1 (3.03%) Microsoft Enterprise Library
4 1 (3.03%) Node.js
4 1 (3.03%) SailPoint
4 1 (3.03%) WCF
4 1 (3.03%) XML
Miscellaneous
1 3 (9.09%) IoT
1 3 (9.09%) Onboarding
2 2 (6.06%) Cloud Native
3 1 (3.03%) Cyber Threat
3 1 (3.03%) Enterprise Software
3 1 (3.03%) Operational Technology
3 1 (3.03%) Public Cloud
3 1 (3.03%) Virtual Team
Processes & Methodologies
1 10 (30.30%) Customer Requirements
2 9 (27.27%) Mentoring
3 8 (24.24%) Problem-Solving
4 7 (21.21%) CI/CD
4 7 (21.21%) Stakeholder Management
5 6 (18.18%) Containerisation
5 6 (18.18%) Validation
6 5 (15.15%) Business Development
6 5 (15.15%) Continuous Deployment
6 5 (15.15%) Continuous Integration
6 5 (15.15%) Creative Problem-Solving
6 5 (15.15%) Digital Engineering
6 5 (15.15%) Infrastructure as Code
6 5 (15.15%) Migration
6 5 (15.15%) Observability
6 5 (15.15%) Platform Engineering
6 5 (15.15%) Project Management
6 5 (15.15%) Site Reliability Engineering
6 5 (15.15%) Value Proposition
7 4 (12.12%) Use Case
Programming Languages
1 6 (18.18%) Python
2 5 (15.15%) Bash
2 5 (15.15%) Go
3 4 (12.12%) JavaScript
4 3 (9.09%) C#
5 2 (6.06%) SQL
6 1 (3.03%) ABAP
6 1 (3.03%) Java
6 1 (3.03%) TypeScript
Qualifications
1 9 (27.27%) Security Cleared
2 6 (18.18%) Degree
3 3 (9.09%) SC Cleared
3 3 (9.09%) TOGAF Certification
4 2 (6.06%) AWS Certification
4 2 (6.06%) Master's Degree
5 1 (3.03%) ACSA
5 1 (3.03%) ACSP
5 1 (3.03%) AWS Certified DevOps Engineer
5 1 (3.03%) AWS Certified Solutions Architect
5 1 (3.03%) AWS Certified SysOps Administrator
5 1 (3.03%) Azure Certification
5 1 (3.03%) CCSK
5 1 (3.03%) CCSP
5 1 (3.03%) CIPD
5 1 (3.03%) Cisco Certification
5 1 (3.03%) CREST Certified
5 1 (3.03%) ISSAP
5 1 (3.03%) ITIL Certification
5 1 (3.03%) SAP Certification
Quality Assurance & Compliance
1 2 (6.06%) QA
2 1 (3.03%) COBIT
2 1 (3.03%) NCSC
2 1 (3.03%) NIST
System Software
1 1 (3.03%) Active Directory
Systems Management
1 6 (18.18%) Kubernetes
2 5 (15.15%) Grafana
2 5 (15.15%) Terraform
Vendors
1 10 (30.30%) Microsoft
2 6 (18.18%) Oracle
3 5 (15.15%) Hitachi
4 3 (9.09%) Salesforce
4 3 (9.09%) SAP
5 2 (6.06%) TOWER Software
6 1 (3.03%) CyberArk
6 1 (3.03%) Netskope
6 1 (3.03%) Okta
6 1 (3.03%) Workday
6 1 (3.03%) Zscaler