Migration Jobs in the City of London

Migration
Central London > City of London

The following table provides summary statistics for permanent job vacancies advertised in the City of London with a requirement for Migration skills. Included is a benchmarking guide to the salaries offered in vacancies that have cited Migration over the 6 months to 27 April 2024 with a comparison to the same period in the previous 2 years.

6 months to
27 Apr 2024
Same period 2023 Same period 2022
Rank 59 50 71
Rank change year-on-year -9 +21 -9
Permanent jobs citing Migration 142 285 296
As % of all permanent jobs advertised in the City of London 4.23% 5.97% 4.20%
As % of the Processes & Methodologies category 4.58% 6.27% 4.41%
Number of salaries quoted 111 208 241
10th Percentile £40,000 £52,500 £52,500
25th Percentile £55,000 £62,500 £58,750
Median annual salary (50th Percentile) £75,000 £85,000 £80,000
Median % change year-on-year -11.76% +6.25% +3.23%
75th Percentile £98,125 £95,000 £96,250
90th Percentile £115,000 £110,000 £108,750
Central London median annual salary £75,000 £85,000 £77,500
% change year-on-year -11.76% +9.68% +3.33%

All Process and Methodology Skills
City of London

Migration is in the Processes and Methodologies category. The following table is for comparison with the above and provides summary statistics for all permanent job vacancies advertised in the City of London with a requirement for process or methodology skills.

Permanent vacancies with a requirement for process or methodology skills 3,103 4,543 6,719
As % of all permanent jobs advertised in the City of London 92.38% 95.14% 95.39%
Number of salaries quoted 2,472 3,814 5,602
10th Percentile £41,250 £43,750 £45,250
25th Percentile £55,000 £56,250 £57,500
Median annual salary (50th Percentile) £75,000 £75,000 £72,500
Median % change year-on-year - +3.45% -
75th Percentile £95,000 £97,500 £93,750
90th Percentile £112,500 £112,500 £110,000
Central London median annual salary £72,500 £75,000 £72,500
% change year-on-year -3.33% +3.45% +3.57%

Migration
Job Vacancy Trend in the City of London

Job postings citing Migration as a proportion of all IT jobs advertised in the City of London.
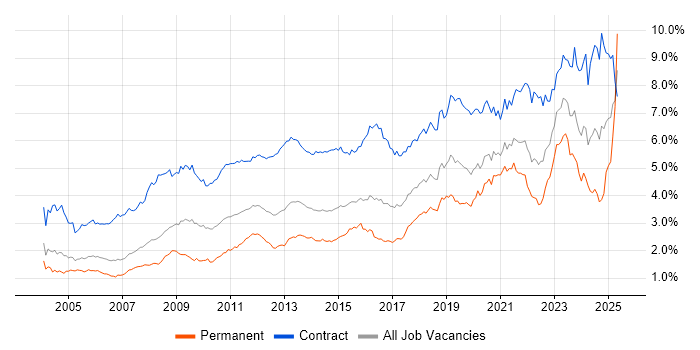
Job vacancy trend for Migration in the City of London

Migration
Salary Trend in the City of London

3-month moving average salary quoted in jobs citing Migration in the City of London.

Salary trend for Migration in the City of London

Migration
Salary Histogram in the City of London

Salary distribution for jobs citing Migration in the City of London over the 6 months to 27 April 2024.

Salary histogram for Migration in the City of London

Migration
Co-occurring Skills and Capabilities in the City of London by Category

The follow tables expand on the table above by listing co-occurrences grouped by category. The same employment type, locality and period is covered with up to 20 co-occurrences shown in each of the following categories:

Application Platforms
1 14 (9.86%) SharePoint
2 13 (9.15%) Microsoft Exchange
3 7 (4.93%) CMS
4 5 (3.52%) Drupal
5 4 (2.82%) WebLogic
6 3 (2.11%) Confluence
7 1 (0.70%) Apache Solr
7 1 (0.70%) Blackberry Enterprise Server
7 1 (0.70%) IIS
7 1 (0.70%) Skype for Business
Applications
1 5 (3.52%) Microsoft Excel
2 4 (2.82%) Microsoft Office
3 1 (0.70%) Microsoft PowerPoint
3 1 (0.70%) Spreadsheet
Business Applications
1 4 (2.82%) SAP S/4HANA
1 4 (2.82%) Sparx Enterprise Architect
2 3 (2.11%) Teamcenter
3 2 (1.41%) MIS ActiveH
3 2 (1.41%) NEC Housing
3 2 (1.41%) SAP ERP
4 1 (0.70%) Loan IQ
4 1 (0.70%) Oracle ERP
4 1 (0.70%) SAP CO
4 1 (0.70%) SAP FI
4 1 (0.70%) SAP FI/CO
4 1 (0.70%) SAP FSCM
4 1 (0.70%) SAP IBP
Cloud Services
1 58 (40.85%) Azure
2 47 (33.10%) AWS
3 28 (19.72%) Microsoft 365
4 13 (9.15%) SaaS
5 12 (8.45%) GCP
6 11 (7.75%) Entra ID
7 10 (7.04%) Power Platform
8 8 (5.63%) Azure DevOps
9 7 (4.93%) Azure Data Factory
10 6 (4.23%) Amazon EKS
11 5 (3.52%) AWS Lambda
11 5 (3.52%) GitHub
11 5 (3.52%) Serverless
12 4 (2.82%) Amazon SQS
12 4 (2.82%) AWS CloudFormation
12 4 (2.82%) Azure AKS
12 4 (2.82%) Azure API Management
12 4 (2.82%) IaaS
12 4 (2.82%) PaaS
12 4 (2.82%) WhatsApp
Communications & Networking
1 6 (4.23%) DNS
2 4 (2.82%) BGP
2 4 (2.82%) Firewall
2 4 (2.82%) Network Security
2 4 (2.82%) SSL
2 4 (2.82%) TCP/IP
3 1 (0.70%) DHCP
3 1 (0.70%) Intranet
3 1 (0.70%) LAN
3 1 (0.70%) MPLS
3 1 (0.70%) SD-WAN
3 1 (0.70%) Skype
3 1 (0.70%) WAN
3 1 (0.70%) Wireless
Database & Business Intelligence
1 13 (9.15%) Oracle Database
2 12 (8.45%) SQL Server
3 11 (7.75%) Data Warehouse
4 9 (6.34%) PostgreSQL
4 9 (6.34%) Relational Database
5 8 (5.63%) Power BI
6 7 (4.93%) Data Lake
6 7 (4.93%) Oracle Database 11g
7 6 (4.23%) RDBMS
8 5 (3.52%) Amazon RDS
8 5 (3.52%) Metadata
9 3 (2.11%) MySQL
9 3 (2.11%) SQL Server Integration Services
10 2 (1.41%) Data Mining
10 2 (1.41%) Snowflake Schema
10 2 (1.41%) SQL Server Analysis Services
10 2 (1.41%) SQL Server Reporting Services
10 2 (1.41%) SQLite
10 2 (1.41%) Star Schema
11 1 (0.70%) Oracle Reports
Development Applications
1 6 (4.23%) JIRA
2 5 (3.52%) Jenkins
3 2 (1.41%) GitLab
4 1 (0.70%) Eclipse
4 1 (0.70%) ERwin
4 1 (0.70%) Octopus Deploy
4 1 (0.70%) TeamCity
General
1 35 (24.65%) Finance
2 26 (18.31%) Social Skills
3 25 (17.61%) Banking
4 11 (7.75%) Presentation Skills
5 8 (5.63%) Analytical Skills
6 6 (4.23%) Inclusion and Diversity
6 6 (4.23%) Retail Banking
7 5 (3.52%) Law
7 5 (3.52%) Organisational Skills
8 3 (2.11%) Marketing
8 3 (2.11%) Retail
9 2 (1.41%) Legal
9 2 (1.41%) Pharmaceutical
10 1 (0.70%) Advertising
10 1 (0.70%) Games
10 1 (0.70%) Investment Banking
10 1 (0.70%) Manufacturing
Job Titles
1 36 (25.35%) Architect
2 34 (23.94%) Senior
3 19 (13.38%) Solutions Architect
4 17 (11.97%) Developer
5 14 (9.86%) Analyst
6 13 (9.15%) Cloud Architect
6 13 (9.15%) Senior Developer
7 11 (7.75%) Azure Engineer
7 11 (7.75%) Data Engineer
8 10 (7.04%) Lead
9 8 (5.63%) Azure Architect
9 8 (5.63%) Business Analyst
10 7 (4.93%) Consultant
10 7 (4.93%) Database Developer
10 7 (4.93%) DevOps Engineer
10 7 (4.93%) Infrastructure Engineer
10 7 (4.93%) PostgreSQL Developer
10 7 (4.93%) Senior DevOps
10 7 (4.93%) Senior DevOps Engineer
11 6 (4.23%) Windows Infrastructure Engineer
Libraries, Frameworks & Software Standards
1 9 (6.34%) HTML
2 7 (4.93%) CSS
2 7 (4.93%) Spring Boot
3 6 (4.23%) Kafka
4 5 (3.52%) .NET
5 4 (2.82%) RabbitMQ
6 3 (2.11%) Itk
6 3 (2.11%) Node.js
6 3 (2.11%) Spring
7 2 (1.41%) MDX
7 2 (1.41%) Middleware
7 2 (1.41%) Oracle Fusion
7 2 (1.41%) Web Services
7 2 (1.41%) XML
8 1 (0.70%) ADO
8 1 (0.70%) AngularJS
8 1 (0.70%) ARM Templates
8 1 (0.70%) Lightning Web Components
8 1 (0.70%) REST
8 1 (0.70%) SAP Fiori
Miscellaneous
1 15 (10.56%) Public Cloud
2 9 (6.34%) Enterprise Software
3 8 (5.63%) PKI
4 6 (4.23%) Cloud Native
5 4 (2.82%) Data Structures
5 4 (2.82%) Self-Motivation
6 3 (2.11%) Data Centre
6 3 (2.11%) NHS
6 3 (2.11%) Onboarding
7 2 (1.41%) Algorithms
7 2 (1.41%) Biopharmaceutical
7 2 (1.41%) Driving Licence
7 2 (1.41%) IoT
7 2 (1.41%) Learning Management System
7 2 (1.41%) Legacy Applications
7 2 (1.41%) Life Science
7 2 (1.41%) LIMS
7 2 (1.41%) Management Information System
8 1 (0.70%) Greenfield Project
8 1 (0.70%) Reinsurance
Operating Systems
1 20 (14.08%) Windows
2 13 (9.15%) Windows Server
3 4 (2.82%) Linux
3 4 (2.82%) Red Hat Enterprise Linux
4 3 (2.11%) Windows 10
5 1 (0.70%) Android
5 1 (0.70%) Apple iOS
5 1 (0.70%) Windows Server 2012
5 1 (0.70%) Windows Server 2016
5 1 (0.70%) Windows Server 2019
Processes & Methodologies
1 53 (37.32%) Data Migration
2 39 (27.46%) Agile
3 25 (17.61%) DevOps
3 25 (17.61%) Problem-Solving
4 21 (14.79%) Actionable Insight
5 20 (14.08%) Roadmaps
6 18 (12.68%) Data Modelling
6 18 (12.68%) Project Management
7 17 (11.97%) Stakeholder Management
8 16 (11.27%) Continuous Improvement
9 15 (10.56%) TOGAF
10 14 (9.86%) ETL
11 13 (9.15%) CI/CD
12 12 (8.45%) Business Intelligence
12 12 (8.45%) Continuous Delivery
12 12 (8.45%) Microservices
13 11 (7.75%) Analytics
13 11 (7.75%) Infrastructure as Code
14 9 (6.34%) Artificial Intelligence
14 9 (6.34%) Decision-Making
Programming Languages
1 25 (17.61%) SQL
2 11 (7.75%) Java
2 11 (7.75%) PowerShell
3 9 (6.34%) PL/SQL
4 8 (5.63%) Python
5 4 (2.82%) C#
6 3 (2.11%) C++
6 3 (2.11%) Data Analysis Expressions
6 3 (2.11%) T-SQL
7 2 (1.41%) C
7 2 (1.41%) Shell Script
8 1 (0.70%) Apex Code
8 1 (0.70%) Bash
8 1 (0.70%) Go
8 1 (0.70%) JavaScript
Qualifications
1 9 (6.34%) Azure Certification
2 7 (4.93%) SC Cleared
2 7 (4.93%) Security Cleared
3 6 (4.23%) Degree
4 5 (3.52%) AWS Certification
5 4 (2.82%) AWS Certified Solutions Architect
6 3 (2.11%) Microsoft Certification
7 2 (1.41%) MCAD
7 2 (1.41%) TOGAF Certification
8 1 (0.70%) BPSS Clearance
8 1 (0.70%) CEH
8 1 (0.70%) CISSP
8 1 (0.70%) Computer Science Degree
8 1 (0.70%) Master's Degree
8 1 (0.70%) PMI Certification
8 1 (0.70%) PMP
Quality Assurance & Compliance
1 11 (7.75%) Data Quality
2 5 (3.52%) QA
3 3 (2.11%) PMO
4 2 (1.41%) ISO/IEC 27001
5 1 (0.70%) Cyber Essentials
5 1 (0.70%) Cyber Essentials PLUS
5 1 (0.70%) GDPR
5 1 (0.70%) NIST
5 1 (0.70%) PCI DSS
5 1 (0.70%) SLA
System Software
1 14 (9.86%) Active Directory
2 9 (6.34%) VMware Infrastructure
3 3 (2.11%) Docker
4 2 (1.41%) Hyper-V
5 1 (0.70%) Microsoft App-V
5 1 (0.70%) Veritas Cluster Server
5 1 (0.70%) vSphere
Systems Management
1 14 (9.86%) Kubernetes
2 11 (7.75%) Terraform
3 3 (2.11%) Ansible
3 3 (2.11%) Microsoft Intune
4 2 (1.41%) Puppet
4 2 (1.41%) SCCM
5 1 (0.70%) Active Directory Federation Services
5 1 (0.70%) Cacti
5 1 (0.70%) Grafana
5 1 (0.70%) McAfee ePO
5 1 (0.70%) Nagios
5 1 (0.70%) NetBackup
5 1 (0.70%) OfficeScan
5 1 (0.70%) Packer
5 1 (0.70%) Progress Chef
5 1 (0.70%) Salt
5 1 (0.70%) SCOM
5 1 (0.70%) Trend Micro Deep Security
5 1 (0.70%) ZABBIX
Vendors
1 26 (18.31%) Microsoft
2 19 (13.38%) Oracle
3 13 (9.15%) Google
4 10 (7.04%) VMware
5 8 (5.63%) SAP
6 6 (4.23%) Sparx
7 5 (3.52%) Databricks
7 5 (3.52%) Salesforce
8 4 (2.82%) Alteryx
9 2 (1.41%) Cisco
9 2 (1.41%) Citrix
9 2 (1.41%) NEC
9 2 (1.41%) Screaming Frog
9 2 (1.41%) Workday
10 1 (0.70%) Dell
10 1 (0.70%) HP
10 1 (0.70%) IBM
10 1 (0.70%) Juniper
10 1 (0.70%) McAfee
10 1 (0.70%) Siemens