Collaborative Working Jobs in the North West

Collaborative Working
England > North West

The following table provides summary statistics for permanent job vacancies advertised in the North West with a requirement for Collaborative Working skills. Included is a benchmarking guide to the salaries offered in vacancies that have cited Collaborative Working over the 6 months to 14 May 2024 with a comparison to the same period in the previous 2 years.

6 months to
14 May 2024
Same period 2023 Same period 2022
Rank 73 118 100
Rank change year-on-year +45 -18 +20
Permanent jobs citing Collaborative Working 299 217 305
As % of all permanent jobs advertised in the North West 3.03% 2.78% 3.23%
As % of the Processes & Methodologies category 3.66% 2.91% 3.38%
Number of salaries quoted 177 119 198
10th Percentile £31,250 £32,314 £35,903
25th Percentile £39,316 £42,500 £40,000
Median annual salary (50th Percentile) £52,000 £55,000 £55,000
Median % change year-on-year -5.45% - +10.00%
75th Percentile £77,500 £67,500 £67,500
90th Percentile £90,000 £77,715 £87,500
England median annual salary £50,000 £59,526 £59,763
% change year-on-year -16.00% -0.40% +13.83%

All Process and Methodology Skills
North West

Collaborative Working is in the Processes and Methodologies category. The following table is for comparison with the above and provides summary statistics for all permanent job vacancies advertised in the North West with a requirement for process or methodology skills.

Permanent vacancies with a requirement for process or methodology skills 8,164 7,462 9,022
As % of all permanent jobs advertised in the North West 82.78% 95.61% 95.43%
Number of salaries quoted 6,201 3,898 5,313
10th Percentile £27,500 £31,040 £30,000
25th Percentile £37,500 £41,250 £39,000
Median annual salary (50th Percentile) £50,000 £55,000 £52,500
Median % change year-on-year -9.09% +4.76% +10.53%
75th Percentile £65,000 £70,000 £67,500
90th Percentile £80,000 £82,500 £81,250
England median annual salary £55,000 £62,500 £60,000
% change year-on-year -12.00% +4.17% +9.09%

Collaborative Working
Job Vacancy Trend in the North West

Job postings citing Collaborative Working as a proportion of all IT jobs advertised in the North West.
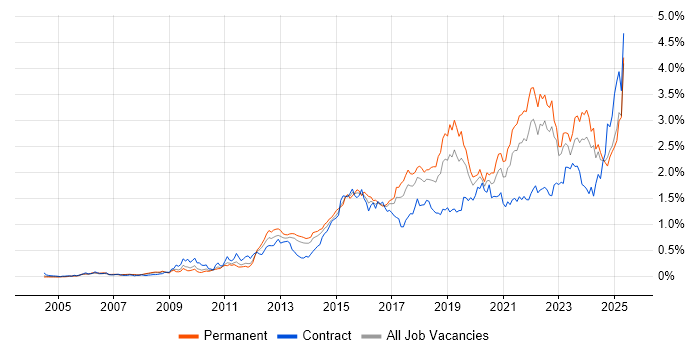
Job vacancy trend for Collaborative Working in the North West

Collaborative Working
Salary Trend in the North West

3-month moving average salary quoted in jobs citing Collaborative Working in the North West.

Salary trend for Collaborative Working in the North West

Collaborative Working
Salary Histogram in the North West

Salary distribution for jobs citing Collaborative Working in the North West over the 6 months to 14 May 2024.

Salary histogram for Collaborative Working in the North West

Collaborative Working
Job Locations in the North West

The table below looks at the demand and provides a guide to the median salaries quoted in IT jobs citing Collaborative Working within the North West region over the 6 months to 14 May 2024. The 'Rank Change' column provides an indication of the change in demand within each location based on the same 6 month period last year.

Location Rank Change
on Same Period
Last Year
Matching
Permanent
IT Job Ads
Median Salary
Past 6 Months
Median Salary
% Change
on Same Period
Last Year
Live
Jobs
Manchester +43 182 £52,250 -9.62% 79
Cheshire -9 39 £66,250 +29.42% 23
Merseyside +26 32 £85,000 +98.83% 16
Lancashire +6 27 £42,500 - 11
Cumbria -3 18 £42,500 -34.62% 8
Collaborative Working
England

Collaborative Working
Co-occurring Skills and Capabilities in the North West by Category

The follow tables expand on the table above by listing co-occurrences grouped by category. The same employment type, locality and period is covered with up to 20 co-occurrences shown in each of the following categories:

Application Platforms
1 11 (3.68%) Apache
1 11 (3.68%) Apache Spark
2 8 (2.68%) WebLogic
3 4 (1.34%) CMS
3 4 (1.34%) SAS
3 4 (1.34%) WordPress
4 3 (1.00%) Apache Solr
5 2 (0.67%) JBoss
5 2 (0.67%) Red Hat Fuse
6 1 (0.33%) ArcGIS
6 1 (0.33%) BizTalk Server
6 1 (0.33%) Jetty
6 1 (0.33%) Microsoft Exchange
6 1 (0.33%) OpenStack
6 1 (0.33%) SharePoint
Applications
1 31 (10.37%) Microsoft PowerPoint
2 11 (3.68%) Microsoft Excel
3 5 (1.67%) Spreadsheet
4 4 (1.34%) Maya
5 2 (0.67%) SPSS
5 2 (0.67%) Stata
6 1 (0.33%) AutoCAD
6 1 (0.33%) Microsoft Office
Business Applications
1 8 (2.68%) Sparx Enterprise Architect
2 4 (1.34%) SAP APO
2 4 (1.34%) SAP CO
2 4 (1.34%) SAP ERP
2 4 (1.34%) SAP FI
2 4 (1.34%) SAP FI/CO
2 4 (1.34%) SAP MM
2 4 (1.34%) SAP PP
2 4 (1.34%) SAP S/4HANA
2 4 (1.34%) SAP SD
2 4 (1.34%) SAP WM
2 4 (1.34%) Shopify
3 2 (0.67%) Primavera
4 1 (0.33%) SAP SCM
Cloud Services
1 88 (29.43%) Azure
2 47 (15.72%) AWS
3 38 (12.71%) Power Platform
4 24 (8.03%) Azure DevOps
5 19 (6.35%) Amazon EKS
6 12 (4.01%) AWS CloudFormation
6 12 (4.01%) OpenShift
6 12 (4.01%) Serverless
7 11 (3.68%) AWS Lambda
7 11 (3.68%) Azure Data Factory
7 11 (3.68%) GCP
8 10 (3.34%) GitHub
8 10 (3.34%) GitHub Actions
9 9 (3.01%) SaaS
10 8 (2.68%) Amazon SQS
11 5 (1.67%) Google Sheets
11 5 (1.67%) NuGet
11 5 (1.67%) PowerApps
12 3 (1.00%) WhatsApp
13 2 (0.67%) Entra ID
Communications & Networking
1 20 (6.69%) TCP/IP
2 12 (4.01%) Broadband
2 12 (4.01%) DNS
3 11 (3.68%) AMQP
4 9 (3.01%) BGP
4 9 (3.01%) SSL
5 6 (2.01%) LAN
5 6 (2.01%) WAN
6 5 (1.67%) Firewall
6 5 (1.67%) Network Security
6 5 (1.67%) OSPF
7 4 (1.34%) Ethernet
7 4 (1.34%) Multicast
7 4 (1.34%) RS-232
7 4 (1.34%) Unified Communications
8 3 (1.00%) VoIP
8 3 (1.00%) Wireless
9 2 (0.67%) PBX
9 2 (0.67%) SMS
9 2 (0.67%) Wi-Fi
Database & Business Intelligence
1 33 (11.04%) Power BI
2 32 (10.70%) SQL Server
3 19 (6.35%) Data Vault
4 12 (4.01%) Azure SQL Database
4 12 (4.01%) Data Warehouse
5 11 (3.68%) Big Data
5 11 (3.68%) Cloudera CDH
5 11 (3.68%) Hadoop
5 11 (3.68%) Relational Database
5 11 (3.68%) SQL Server Integration Services
6 10 (3.34%) Azure SQL Data Warehouse
6 10 (3.34%) Oracle Database
7 8 (2.68%) Amazon RDS
7 8 (2.68%) RDBMS
8 7 (2.34%) Delta Lake
9 6 (2.01%) MySQL
10 2 (0.67%) Data Lake
10 2 (0.67%) Data Mining
10 2 (0.67%) Electronic Patient Records
10 2 (0.67%) SQL Server Reporting Services
Development Applications
1 41 (13.71%) JIRA
2 14 (4.68%) Git
3 6 (2.01%) PHPUnit
4 5 (1.67%) Jenkins
4 5 (1.67%) JetBrains Rider
4 5 (1.67%) TeamCity
5 4 (1.34%) Rational DOORS
5 4 (1.34%) Subversion
5 4 (1.34%) Xcode
6 2 (0.67%) IntelliJ
7 1 (0.33%) Cucumber
7 1 (0.33%) Selenium
7 1 (0.33%) SpecFlow
7 1 (0.33%) Visual Studio Coded UI
General
1 114 (38.13%) Social Skills
2 47 (15.72%) Analytical Skills
3 46 (15.38%) Marketing
4 42 (14.05%) Retail
5 38 (12.71%) Finance
6 34 (11.37%) Aerospace
7 25 (8.36%) Public Sector
8 11 (3.68%) Inclusion and Diversity
9 9 (3.01%) Organisational Skills
10 7 (2.34%) Games
10 7 (2.34%) Legal
11 6 (2.01%) Documentation Skills
11 6 (2.01%) Telecoms
12 5 (1.67%) Local Government
12 5 (1.67%) Manufacturing
12 5 (1.67%) Presentation Skills
13 3 (1.00%) Fire and Rescue
13 3 (1.00%) Law
14 2 (0.67%) Banking
14 2 (0.67%) Cantonese Language
Job Titles
1 44 (14.72%) Developer
2 41 (13.71%) Senior
3 32 (10.70%) Lead
4 29 (9.70%) Architect
5 26 (8.70%) Software Engineer
6 22 (7.36%) Analyst
7 21 (7.02%) Data Engineer
8 19 (6.35%) Informatica Engineer
8 19 (6.35%) Senior Developer
9 17 (5.69%) DevOps Engineer
10 12 (4.01%) DBA
10 12 (4.01%) SQL DBA
11 11 (3.68%) Business Intelligence Developer
11 11 (3.68%) DV Cleared Software Engineer
11 11 (3.68%) Project Manager
11 11 (3.68%) Technical Manager
12 10 (3.34%) Solutions Architect
13 9 (3.01%) Development Manager
13 9 (3.01%) Senior Software Engineer
14 8 (2.68%) .NET Developer
Libraries, Frameworks & Software Standards
1 25 (8.36%) .NET
2 24 (8.03%) Spring Boot
3 22 (7.36%) RabbitMQ
3 22 (7.36%) REST
4 20 (6.69%) AngularJS
5 19 (6.35%) React
6 18 (6.02%) Spring
7 16 (5.35%) CSS
7 16 (5.35%) HTML
8 15 (5.02%) .NET Framework
8 15 (5.02%) Node.js
9 12 (4.01%) Web Services
10 11 (3.68%) gRPC
10 11 (3.68%) Material-UI
10 11 (3.68%) OpenAPI
10 11 (3.68%) Swagger
11 10 (3.34%) .NET Core
12 9 (3.01%) jQuery
12 9 (3.01%) Laravel
12 9 (3.01%) WCF
Miscellaneous
1 23 (7.69%) Public Cloud
2 19 (6.35%) Data Structures
3 13 (4.35%) Cloud Native
3 13 (4.35%) Reinsurance
3 13 (4.35%) Self-Motivation
4 11 (3.68%) Greenfield Project
5 9 (3.01%) Mobile App
6 8 (2.68%) Enterprise Software
7 7 (2.34%) Management Information System
8 6 (2.01%) Analytical Mindset
8 6 (2.01%) IoT
9 4 (1.34%) Cyber Threat
9 4 (1.34%) Linux Command Line
9 4 (1.34%) Security Posture
10 3 (1.00%) Acoustics
10 3 (1.00%) PropTech
10 3 (1.00%) SWIFT Messaging Network
11 2 (0.67%) Legacy Applications
11 2 (0.67%) NHS
11 2 (0.67%) Robotics
Operating Systems
1 59 (19.73%) Linux
2 19 (6.35%) Red Hat Enterprise Linux
3 17 (5.69%) Ubuntu
4 12 (4.01%) VMS
5 11 (3.68%) Apple iOS
5 11 (3.68%) CentOS
5 11 (3.68%) Debian
6 9 (3.01%) Windows
7 7 (2.34%) Android
8 3 (1.00%) Windows Server
9 2 (0.67%) Windows Server 2003
10 1 (0.33%) Unix
Processes & Methodologies
1 130 (43.48%) Agile
2 105 (35.12%) Problem-Solving
3 64 (21.40%) Scrum
4 63 (21.07%) Analytics
5 49 (16.39%) DevOps
6 41 (13.71%) Kanban
7 38 (12.71%) Actionable Insight
8 37 (12.37%) Software Engineering
9 36 (12.04%) Business Development
10 35 (11.71%) Collaborative Culture
11 32 (10.70%) Continuous Improvement
12 31 (10.37%) Business Intelligence
12 31 (10.37%) Project Management
13 30 (10.03%) ETL
13 30 (10.03%) Scaled Agile Framework
14 29 (9.70%) Creative Problem-Solving
15 28 (9.36%) Cybersecurity
16 26 (8.70%) Project Delivery
17 25 (8.36%) CI/CD
17 25 (8.36%) SDLC
Programming Languages
1 45 (15.05%) SQL
2 35 (11.71%) JavaScript
3 25 (8.36%) C#
4 24 (8.03%) T-SQL
5 23 (7.69%) Java
5 23 (7.69%) Python
6 9 (3.01%) PHP
7 6 (2.01%) Swift
7 6 (2.01%) TypeScript
8 4 (1.34%) C
8 4 (1.34%) Objective-C
9 2 (0.67%) Data Analysis Expressions
9 2 (0.67%) Kotlin
9 2 (0.67%) Shell Script
Qualifications
1 50 (16.72%) Security Cleared
2 48 (16.05%) Degree
3 28 (9.36%) DV Cleared
3 28 (9.36%) SC Cleared
4 12 (4.01%) Microsoft Certification
5 8 (2.68%) AWS Certification
5 8 (2.68%) AWS Certified Solutions Architect
5 8 (2.68%) Azure Certification
5 8 (2.68%) Chartered Engineer
5 8 (2.68%) HND
6 7 (2.34%) HNC
6 7 (2.34%) Master's Degree
7 5 (1.67%) Cisco Certification
8 4 (1.34%) CEH
8 4 (1.34%) CISSP
8 4 (1.34%) CompTIA Security+
8 4 (1.34%) SAP Certification
9 3 (1.00%) DBS Check
10 2 (0.67%) Numerate Degree
10 2 (0.67%) SAS Certification
Quality Assurance & Compliance
1 21 (7.02%) Data Quality
2 8 (2.68%) SLA
3 7 (2.34%) PMO
4 6 (2.01%) GDPR
4 6 (2.01%) QA
5 4 (1.34%) Cyber Essentials
5 4 (1.34%) Cyber Essentials PLUS
5 4 (1.34%) ISO 9001
5 4 (1.34%) ISO/IEC 27001
5 4 (1.34%) SOC 2
6 3 (1.00%) Accessibility
6 3 (1.00%) PSD2
7 1 (0.33%) Def Stans
System Software
1 29 (9.70%) Docker
2 12 (4.01%) Virtual Machines
3 4 (1.34%) Active Directory
4 1 (0.33%) Lustre
4 1 (0.33%) RACF
4 1 (0.33%) Slurm Workload Manager
4 1 (0.33%) VMware Infrastructure
Systems Management
1 35 (11.71%) Kubernetes
2 33 (11.04%) Terraform
3 28 (9.36%) Ansible
4 11 (3.68%) Puppet
5 1 (0.33%) Icinga
5 1 (0.33%) Microsoft Intune
5 1 (0.33%) Proxmox
5 1 (0.33%) Single Sign-On
Vendors
1 44 (14.72%) Microsoft
2 23 (7.69%) Oracle
3 21 (7.02%) Google
4 20 (6.69%) Databricks
5 19 (6.35%) Informatica
6 11 (3.68%) Red Hat
6 11 (3.68%) SaltStack
7 10 (3.34%) SAP
8 8 (2.68%) Sparx
9 7 (2.34%) Cisco
9 7 (2.34%) Thales
10 5 (1.67%) Alteryx
10 5 (1.67%) Salesforce
10 5 (1.67%) Workday
11 2 (0.67%) BT
11 2 (0.67%) Teradata
11 2 (0.67%) VMware
12 1 (0.33%) Bloomberg
12 1 (0.33%) Dell
12 1 (0.33%) HP