Collaborative Working Jobs in England

Collaborative Working
UK > England

The table below provides summary statistics for permanent job vacancies advertised in England requiring Collaborative Working skills. It includes a benchmarking guide to the annual salaries offered in vacancies that cited Collaborative Working over the 6 months leading up to 31 May 2025, comparing them to the same period in the previous two years.

6 months to
31 May 2025
Same period 2024 Same period 2023
Rank 63 82 113
Rank change year-on-year +19 +31 +22
Permanent jobs citing Collaborative Working 2,022 2,663 2,577
As % of all permanent jobs advertised in England 4.10% 2.96% 3.03%
As % of the Processes & Methodologies category 4.36% 3.53% 3.17%
Number of salaries quoted 771 1,719 1,262
10th Percentile £32,500 £28,750 £37,500
25th Percentile £42,862 £37,178 £46,250
Median annual salary (50th Percentile) £54,793 £50,000 £59,763
Median % change year-on-year +9.59% -16.34% -0.40%
75th Percentile £72,500 £70,000 £77,715
90th Percentile £87,500 £86,500 £97,290
UK median annual salary £55,000 £50,000 £59,526
% change year-on-year +10.00% -16.00% +2.69%

All Process and Methodology Skills
England

Collaborative Working falls under the Processes and Methodologies category. For comparison with the information above, the following table provides summary statistics for all permanent job vacancies requiring process or methodology skills in England.

Permanent vacancies with a requirement for process or methodology skills 46,342 75,409 81,364
As % of all permanent jobs advertised in England 93.97% 83.96% 95.53%
Number of salaries quoted 23,102 54,812 48,959
10th Percentile £29,250 £29,000 £34,452
25th Percentile £41,250 £40,000 £46,000
Median annual salary (50th Percentile) £57,500 £55,000 £62,500
Median % change year-on-year +4.55% -12.00% +4.17%
75th Percentile £75,000 £72,500 £82,500
90th Percentile £97,528 £93,750 £102,500
UK median annual salary £57,000 £55,000 £60,899
% change year-on-year +3.64% -9.69% +1.50%

Collaborative Working
Job Vacancy Trend in England

Job postings citing Collaborative Working as a proportion of all IT jobs advertised in England.

Job vacancy trend for Collaborative Working in England

Collaborative Working
Salary Trend in England

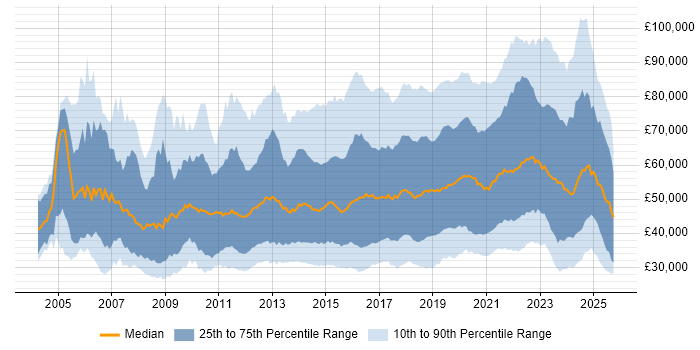
3-month moving average salary quoted in jobs citing Collaborative Working in England.

Salary trend for Collaborative Working in England

Collaborative Working
Salary Histogram in England

Salary distribution for jobs citing Collaborative Working in England over the 6 months to 31 May 2025.

Salary histogram for Collaborative Working in England

Collaborative Working
Job Locations in England

The table below looks at the demand and provides a guide to the median salaries quoted in IT jobs citing Collaborative Working within the England region over the 6 months to 31 May 2025. The 'Rank Change' column provides an indication of the change in demand within each location based on the same 6 month period last year.

Location Rank Change
on Same Period
Last Year
Matching
Permanent
IT Job Ads
Median Salary
Past 6 Months
Median Salary
% Change
on Same Period
Last Year
Live
Jobs
Midlands +89 531 £52,500 +16.67% 161
London +30 497 £65,000 -3.70% 898
South East -9 383 £54,750 +21.67% 275
West Midlands +111 359 £55,000 +0.06% 114
East of England +58 262 £50,967 +10.09% 96
North of England -68 249 £54,793 +15.35% 307
East Midlands +46 172 £47,500 +26.67% 44
North West -75 170 £54,793 +1.47% 174
South West -54 79 £60,000 +26.32% 168
Yorkshire -8 64 £58,500 +26.49% 104
North East +2 15 £35,000 -16.67% 31
Collaborative Working
UK

Collaborative Working
Co-occurring Skills and Capabilities in England by Category

The follow tables expand on the table above by listing co-occurrences grouped by category. The same employment type, locality and period is covered with up to 20 co-occurrences shown in each of the following categories:

Application Platforms
1 41 (2.03%) CMS
2 36 (1.78%) Microsoft Exchange
3 23 (1.14%) Confluence
4 15 (0.74%) SharePoint
5 14 (0.69%) Apache Airflow
6 13 (0.64%) WordPress
7 11 (0.54%) nginx
8 10 (0.49%) Drupal
8 10 (0.49%) IIS
9 9 (0.45%) Apache
9 9 (0.45%) Apache Spark
10 4 (0.20%) Headless CMS
11 3 (0.15%) Umbraco
12 2 (0.099%) Oracle SOA Suite
13 1 (0.049%) OpenStack
13 1 (0.049%) Oracle Workflow
13 1 (0.049%) SAS
13 1 (0.049%) Strapi
Applications
1 60 (2.97%) Microsoft Excel
2 30 (1.48%) Microsoft Office
3 15 (0.74%) Microsoft PowerPoint
3 15 (0.74%) Microsoft Project
4 10 (0.49%) MS Visio
5 7 (0.35%) Adobe Creative Suite
5 7 (0.35%) InDesign
5 7 (0.35%) Trello
6 6 (0.30%) Adobe Illustrator
6 6 (0.30%) Photoshop
7 5 (0.25%) Adobe Premiere
7 5 (0.25%) Spreadsheet
7 5 (0.25%) SPSS
8 4 (0.20%) Sketch
9 3 (0.15%) Adobe XD
10 2 (0.099%) AutoCAD
10 2 (0.099%) Blender
10 2 (0.099%) EngageOne
10 2 (0.099%) Maya
11 1 (0.049%) Final Cut Pro
Business Applications
1 54 (2.67%) NetSuite
2 29 (1.43%) SAP BPC
3 28 (1.38%) Infor LN
4 15 (0.74%) Oracle EBS
5 10 (0.49%) Oracle Applications
6 5 (0.25%) Dynamics NAV
6 5 (0.25%) SAP S/4HANA
7 4 (0.20%) Magento
7 4 (0.20%) SAP CO
7 4 (0.20%) SAP FI
7 4 (0.20%) SAP HR
8 3 (0.15%) Dynamics CRM
8 3 (0.15%) Infor CloudSuite
8 3 (0.15%) Infor CloudSuite Industrial (formerly SyteLine)
8 3 (0.15%) Orchestrade
8 3 (0.15%) SAP FI/CO
8 3 (0.15%) Shopify
9 2 (0.099%) Raiser’s Edge
9 2 (0.099%) Salesforce CRM
9 2 (0.099%) SAP HCM
Cloud Services
1 220 (10.88%) Azure
2 180 (8.90%) AWS
3 76 (3.76%) Power Platform
4 68 (3.36%) Microsoft 365
5 60 (2.97%) Amazon EKS
6 54 (2.67%) AWS CloudFormation
7 51 (2.52%) SaaS
8 35 (1.73%) GCP
9 32 (1.58%) Serverless
10 27 (1.34%) Azure DevOps
10 27 (1.34%) GitHub
11 24 (1.19%) Dynamics 365
12 20 (0.99%) AWS Lambda
12 20 (0.99%) Google Analytics
13 17 (0.84%) Entra ID
14 14 (0.69%) Amazon EC2
14 14 (0.69%) Boomi
14 14 (0.69%) Google Workspace
15 12 (0.59%) Amazon ECS
16 11 (0.54%) Power Automate
Communications & Networking
1 38 (1.88%) Firewall
2 33 (1.63%) DNS
3 31 (1.53%) TCP/IP
4 30 (1.48%) DHCP
5 19 (0.94%) VLAN
5 19 (0.94%) WAN
6 17 (0.84%) Network Security
7 16 (0.79%) LAN
7 16 (0.79%) VPN
8 13 (0.64%) Internet
9 10 (0.49%) Intrusion Detection
9 10 (0.49%) VoIP
9 10 (0.49%) Wi-Fi
10 8 (0.40%) Wireless
11 7 (0.35%) ADSL
12 5 (0.25%) IPv4
12 5 (0.25%) PBX
12 5 (0.25%) RTP
12 5 (0.25%) Softphone
13 4 (0.20%) OSPF
Database & Business Intelligence
1 57 (2.82%) Power BI
2 54 (2.67%) Big Data
3 52 (2.57%) Tableau
4 50 (2.47%) Elasticsearch
5 37 (1.83%) Relational Database
6 29 (1.43%) NoSQL
7 26 (1.29%) SQL Server
8 23 (1.14%) PostgreSQL
9 17 (0.84%) RDBMS
10 15 (0.74%) Data Warehouse
11 13 (0.64%) Amazon RDS
11 13 (0.64%) Metadata
12 10 (0.49%) Metadata Repository
13 9 (0.45%) Hadoop
13 9 (0.45%) MongoDB
14 8 (0.40%) Power Query
14 8 (0.40%) SQL Server Reporting Services
15 7 (0.35%) DynamoDB
15 7 (0.35%) GIS
15 7 (0.35%) MySQL
Development Applications
1 79 (3.91%) JIRA
2 52 (2.57%) Git
3 35 (1.73%) Jenkins
4 28 (1.38%) Oracle Forms
5 26 (1.29%) Rational DOORS
6 12 (0.59%) Bitbucket
7 11 (0.54%) JUnit
8 10 (0.49%) GitLab
8 10 (0.49%) Mockito
9 8 (0.40%) JMeter
10 6 (0.30%) Cucumber
10 6 (0.30%) Mocha
11 5 (0.25%) Jasmine
11 5 (0.25%) Karma Test Runner
12 4 (0.20%) Visual Studio
12 4 (0.20%) Visual Studio Code
13 3 (0.15%) Octopus Deploy
13 3 (0.15%) Subversion
13 3 (0.15%) Vite
14 2 (0.099%) Rational Rhapsody
General
1 1,099 (54.35%) Social Skills
2 620 (30.66%) Finance
3 477 (23.59%) Analytical Skills
4 457 (22.60%) Marketing
5 332 (16.42%) Public Sector
6 208 (10.29%) Law
7 163 (8.06%) Influencing Skills
8 118 (5.84%) Organisational Skills
9 117 (5.79%) Inclusion and Diversity
10 116 (5.74%) Advertising
11 68 (3.36%) Legal
12 67 (3.31%) Banking
13 61 (3.02%) Avionics
14 58 (2.87%) Telecoms
15 55 (2.72%) Manufacturing
16 48 (2.37%) Documentation Skills
17 40 (1.98%) Retail
18 31 (1.53%) Police
19 27 (1.34%) Presentation Skills
20 26 (1.29%) Electronics
Job Titles
1 324 (16.02%) Senior
2 292 (14.44%) Principal Engineer
3 290 (14.34%) Principal Systems Engineer
4 268 (13.25%) Business Manager
5 267 (13.20%) Business Development Manager
5 267 (13.20%) Development Manager
6 196 (9.69%) Analyst
7 189 (9.35%) Developer
8 137 (6.78%) Systems Engineer
9 114 (5.64%) Lead
10 98 (4.85%) Change Analyst
11 95 (4.70%) Senior Systems Engineer
12 88 (4.35%) Business Change Analyst
13 86 (4.25%) Account Manager
14 81 (4.01%) Consultant
15 65 (3.21%) Senior Manager
16 60 (2.97%) Software Developer
17 50 (2.47%) Engineering Manager
18 49 (2.42%) Functional Consultant
18 49 (2.42%) Project Manager
Libraries, Frameworks & Software Standards
1 97 (4.80%) .NET
2 84 (4.15%) HTML
3 76 (3.76%) CSS
4 68 (3.36%) Node.js
5 56 (2.77%) Pandas
6 51 (2.52%) React
7 36 (1.78%) AngularJS
8 33 (1.63%) Web Services
9 32 (1.58%) REST
10 27 (1.34%) Middleware
11 26 (1.29%) Spring
12 24 (1.19%) Spring Boot
13 23 (1.14%) SailPoint
14 21 (1.04%) OAuth
15 19 (0.94%) HTML5
15 19 (0.94%) RESTful
16 16 (0.79%) .NET Core
17 14 (0.69%) .NET Framework
17 14 (0.69%) Django
17 14 (0.69%) Oracle Fusion
Miscellaneous
1 158 (7.81%) Management Information System
2 83 (4.10%) Digital Media
2 83 (4.10%) Marketing Technology
3 61 (3.02%) Self-Motivation
4 60 (2.97%) Product Ownership
5 58 (2.87%) Social Media
6 51 (2.52%) Cyberattack
7 47 (2.32%) Virtual Team
8 32 (1.58%) Onboarding
9 28 (1.38%) Team-Oriented Environment
10 21 (1.04%) Analytical Mindset
10 21 (1.04%) Data Centre
10 21 (1.04%) Mobile App
11 16 (0.79%) Cloud Native
12 12 (0.59%) Distributed Systems
12 12 (0.59%) FMCG
13 11 (0.54%) Driving Licence
14 10 (0.49%) Security Posture
15 9 (0.45%) Cyber Threat
15 9 (0.45%) Legacy Systems
Operating Systems
1 105 (5.19%) Windows
2 101 (5.00%) Linux
3 66 (3.26%) Android
4 32 (1.58%) Windows Vista
5 26 (1.29%) Windows Server
6 22 (1.09%) Unix
7 16 (0.79%) Windows Server 2016
8 14 (0.69%) Windows Server 2012
9 13 (0.64%) Apple iOS
10 12 (0.59%) Windows Server 2019
11 6 (0.30%) Red Hat Enterprise Linux
12 4 (0.20%) AIX
13 3 (0.15%) Mac OS
14 2 (0.099%) Windows Server 2008
15 1 (0.049%) Amazon Linux
15 1 (0.049%) Debian
15 1 (0.049%) Embedded Linux
15 1 (0.049%) Windows 10
15 1 (0.049%) zOS
Processes & Methodologies
1 509 (25.17%) Problem-Solving
2 433 (21.41%) Systems Engineering
3 399 (19.73%) Model-Based Systems Engineering
4 333 (16.47%) Project Management
5 325 (16.07%) Marketing Strategy
6 307 (15.18%) Continuous Improvement
7 301 (14.89%) Collaborative Culture
8 298 (14.74%) Business Development
9 287 (14.19%) Agile
10 274 (13.55%) Facilities Management
11 271 (13.40%) Mathematics
12 204 (10.09%) Physics
13 197 (9.74%) Strategic Thinking
14 184 (9.10%) Logistics
15 168 (8.31%) Chemistry
16 151 (7.47%) CI/CD
17 143 (7.07%) Change Management
18 140 (6.92%) Digital Marketing
19 130 (6.43%) Systems Thinking
20 128 (6.33%) Process Improvement
Programming Languages
1 177 (8.75%) SQL
2 174 (8.61%) Python
3 149 (7.37%) JavaScript
4 120 (5.93%) Java
5 71 (3.51%) PowerShell
6 62 (3.07%) Go
7 60 (2.97%) C++
8 54 (2.67%) C#
9 51 (2.52%) Rust
10 38 (1.88%) TypeScript
11 20 (0.99%) Bash
12 15 (0.74%) R
13 14 (0.69%) Shell Script
14 11 (0.54%) C
15 9 (0.45%) T-SQL
16 8 (0.40%) PL/SQL
17 7 (0.35%) ABAP
18 6 (0.30%) PHP
19 5 (0.25%) Apex Code
19 5 (0.25%) Swift
Qualifications
1 628 (31.06%) Degree
2 400 (19.78%) BPSS Clearance
3 128 (6.33%) Security Cleared
4 89 (4.40%) CBAP
5 66 (3.26%) Computer Science Degree
6 64 (3.17%) HND
7 62 (3.07%) DV Cleared
8 61 (3.02%) HNC
9 59 (2.92%) DBS Check
10 36 (1.78%) ACCA
10 36 (1.78%) CISSP
11 35 (1.73%) CIMA
11 35 (1.73%) Master's Degree
11 35 (1.73%) PMP
12 31 (1.53%) PMI Certification
13 28 (1.38%) SC Cleared
14 26 (1.29%) Microsoft Certification
15 21 (1.04%) Azure Certification
16 19 (0.94%) Cisco Certification
17 17 (0.84%) CISM
Quality Assurance & Compliance
1 126 (6.23%) ISO/IEC 15288
2 95 (4.70%) QA
3 62 (3.07%) Accessibility
4 40 (1.98%) GDPR
5 33 (1.63%) Data Quality
6 32 (1.58%) SLA
7 29 (1.43%) IFRS
7 29 (1.43%) ISO/IEC 27001
8 28 (1.38%) GAAP
9 22 (1.09%) Cyber Essentials
10 21 (1.04%) Cyber Essentials PLUS
11 20 (0.99%) NIST
12 10 (0.49%) PMO
13 7 (0.35%) GRC
13 7 (0.35%) WCAG
14 6 (0.30%) California Consumer Privacy Act
15 5 (0.25%) PCI DSS
16 4 (0.20%) IEC 62304
16 4 (0.20%) ISO 13485
17 3 (0.15%) ISO 9000
System Software
1 101 (5.00%) Docker
2 69 (3.41%) Active Directory
3 26 (1.29%) VMware Infrastructure
4 12 (0.59%) Hyper-V
5 8 (0.40%) Firmware
6 7 (0.35%) HDFS
7 5 (0.25%) Embedded Firmware
8 3 (0.15%) Virtual Machines
8 3 (0.15%) vSphere
9 2 (0.099%) Postfix
10 1 (0.049%) Job Entry Subsystem
10 1 (0.049%) Time Sharing Option
10 1 (0.049%) Virtual Desktop
10 1 (0.049%) VMware ESXi
10 1 (0.049%) VMware NSX
10 1 (0.049%) XenApp
10 1 (0.049%) XenDesktop
Systems Management
1 116 (5.74%) Kubernetes
2 78 (3.86%) Terraform
3 67 (3.31%) Ansible
4 26 (1.29%) Microsoft Intune
5 15 (0.74%) Single Sign-On
6 12 (0.59%) SCCM
7 11 (0.54%) NetBackup
7 11 (0.54%) SCOM
8 10 (0.49%) Kibana
9 9 (0.45%) Grafana
9 9 (0.45%) Prometheus
10 7 (0.35%) Puppet
11 5 (0.25%) Active Directory Federation Services
12 4 (0.20%) Nagios
12 4 (0.20%) Progress Chef
13 3 (0.15%) FortiGate
14 2 (0.099%) Nmap
14 2 (0.099%) Proxmox
14 2 (0.099%) ZABBIX
15 1 (0.049%) vCenter Server
Vendors
1 161 (7.96%) Microsoft
2 99 (4.90%) SAP
3 62 (3.07%) Oracle
4 51 (2.52%) Salesforce
5 47 (2.32%) Google
6 38 (1.88%) ServiceNow
7 37 (1.83%) VMware
8 31 (1.53%) Infor
9 28 (1.38%) Cognos
10 23 (1.14%) Okta
11 22 (1.09%) Adobe
12 21 (1.04%) Cisco
13 18 (0.89%) Splunk
14 14 (0.69%) Dynatrace
15 12 (0.59%) Veeam
16 11 (0.54%) SolarWinds
17 10 (0.49%) MuleSoft
18 9 (0.45%) Databricks
18 9 (0.45%) HubSpot
19 8 (0.40%) Red Hat