DevOps Jobs in the North West

DevOps
England > North West

The table below provides summary statistics for permanent job vacancies advertised in the North West requiring DevOps skills. It includes a benchmarking guide to the annual salaries offered in vacancies that cited DevOps over the 6 months leading up to 13 May 2025, comparing them to the same period in the previous two years.

6 months to
13 May 2025
Same period 2024 Same period 2023
Rank 32 17 10
Rank change year-on-year -15 -7 -2
Permanent jobs citing DevOps 650 862 1,299
As % of all permanent jobs advertised in the North West 8.10% 8.74% 16.50%
As % of the Processes & Methodologies category 8.44% 10.55% 17.25%
Number of salaries quoted 204 553 585
10th Percentile £42,500 £38,750 £42,500
25th Percentile £52,188 £50,000 £51,750
Median annual salary (50th Percentile) £70,000 £62,500 £65,000
Median % change year-on-year +12.00% -3.85% +8.33%
75th Percentile £85,625 £80,000 £80,000
90th Percentile £95,000 £93,750 £90,000
England median annual salary £72,000 £65,000 £70,000
% change year-on-year +10.77% -7.14% -

All Process and Methodology Skills
North West

DevOps falls under the Processes and Methodologies category. For comparison with the information above, the following table provides summary statistics for all permanent job vacancies requiring process or methodology skills in the North West.

Permanent vacancies with a requirement for process or methodology skills 7,697 8,168 7,530
As % of all permanent jobs advertised in the North West 95.86% 82.81% 95.63%
Number of salaries quoted 4,045 6,196 3,942
10th Percentile £26,250 £27,500 £30,831
25th Percentile £40,000 £37,500 £41,250
Median annual salary (50th Percentile) £50,055 £50,000 £55,000
Median % change year-on-year +0.11% -9.09% +4.76%
75th Percentile £61,000 £65,000 £70,000
90th Percentile £77,500 £80,000 £82,500
England median annual salary £57,500 £55,000 £62,500
% change year-on-year +4.55% -12.00% +4.17%

DevOps
Job Vacancy Trend in the North West

Job postings citing DevOps as a proportion of all IT jobs advertised in the North West.
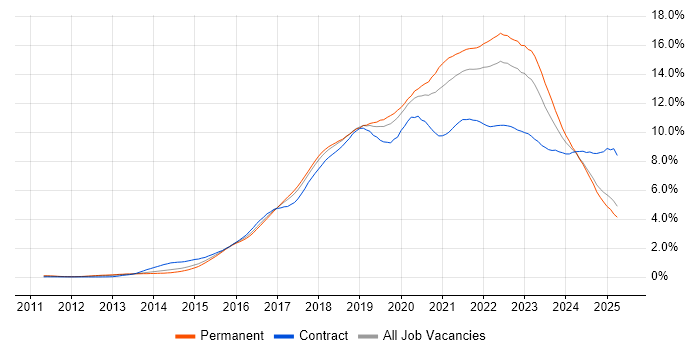
Job vacancy trend for DevOps in the North West

DevOps
Salary Trend in the North West

3-month moving average salary quoted in jobs citing DevOps in the North West.

Salary trend for DevOps in the North West

DevOps
Salary Histogram in the North West

Salary distribution for jobs citing DevOps in the North West over the 6 months to 13 May 2025.

Salary histogram for DevOps in the North West

DevOps
Job Locations in the North West

The table below looks at the demand and provides a guide to the median salaries quoted in IT jobs citing DevOps within the North West region over the 6 months to 13 May 2025. The 'Rank Change' column provides an indication of the change in demand within each location based on the same 6 month period last year.

Location Rank Change
on Same Period
Last Year
Matching
Permanent
IT Job Ads
Median Salary
Past 6 Months
Median Salary
% Change
on Same Period
Last Year
Live
Jobs
Manchester -3 293 £72,500 +11.54% 379
Lancashire -15 219 £43,567 -30.61% 130
Cheshire +16 109 £60,000 +14.29% 70
Merseyside -11 26 £61,000 +1.67% 31
Cumbria -96 3 £72,500 +20.83% 1
DevOps
England

DevOps
Co-occurring Skills and Capabilities in the North West by Category

The follow tables expand on the table above by listing co-occurrences grouped by category. The same employment type, locality and period is covered with up to 20 co-occurrences shown in each of the following categories:

Application Platforms
1 51 (7.85%) Confluence
2 15 (2.31%) Oracle Application Server
3 5 (0.77%) SharePoint
4 4 (0.62%) IIS
4 4 (0.62%) Microsoft Exchange
5 3 (0.46%) nginx
6 2 (0.31%) Apache
6 2 (0.31%) CMS
7 1 (0.15%) Apache Solr
7 1 (0.15%) Apache Spark
7 1 (0.15%) Headless CMS
7 1 (0.15%) Oracle SOA Suite
Applications
1 8 (1.23%) Microsoft Excel
2 4 (0.62%) Microsoft PowerPoint
2 4 (0.62%) MS Visio
3 2 (0.31%) Microsoft Office
4 1 (0.15%) Chatbot
Business Applications
1 2 (0.31%) SAP Oil and Gas
2 1 (0.15%) Dynamics CRM
2 1 (0.15%) Oracle EBS
Cloud Services
1 250 (38.46%) Azure
2 234 (36.00%) AWS
3 90 (13.85%) GCP
4 50 (7.69%) Azure DevOps
5 26 (4.00%) SaaS
6 18 (2.77%) Power Platform
7 15 (2.31%) Cloud Computing
8 13 (2.00%) GitHub
9 11 (1.69%) Amazon EKS
9 11 (1.69%) Serverless
10 10 (1.54%) Microsoft 365
10 10 (1.54%) PaaS
11 9 (1.38%) AWS CloudFormation
11 9 (1.38%) Entra ID
12 8 (1.23%) Azure Monitor
12 8 (1.23%) Dynamics 365
12 8 (1.23%) Power Automate
13 7 (1.08%) IaaS
14 6 (0.92%) GitHub Actions
14 6 (0.92%) Pulumi
Communications & Networking
1 256 (39.38%) VPN
2 248 (38.15%) Cisco IOS
3 12 (1.85%) TCP/IP
4 11 (1.69%) Firewall
5 7 (1.08%) DNS
6 4 (0.62%) Network Security
7 3 (0.46%) Broadband
7 3 (0.46%) FTP
7 3 (0.46%) HTTPS
7 3 (0.46%) Internet
7 3 (0.46%) Reverse Proxy
7 3 (0.46%) SD-WAN
7 3 (0.46%) WAN
8 2 (0.31%) HTTP
8 2 (0.31%) SSH
8 2 (0.31%) SSL
9 1 (0.15%) EIGRP
9 1 (0.15%) Intrusion Detection
9 1 (0.15%) VLAN
9 1 (0.15%) VoIP
Database & Business Intelligence
1 133 (20.46%) SQL Server
2 27 (4.15%) NoSQL
3 17 (2.62%) Data Warehouse
3 17 (2.62%) Oracle Reports
4 16 (2.46%) MySQL
5 15 (2.31%) Enterprise Data Warehouse
6 13 (2.00%) Power BI
7 12 (1.85%) PostgreSQL
8 10 (1.54%) Relational Database
9 9 (1.38%) MongoDB
10 7 (1.08%) Data Lake
11 6 (0.92%) Azure SQL Database
11 6 (0.92%) BigQuery
12 5 (0.77%) Amazon RDS
12 5 (0.77%) Redis
13 4 (0.62%) DynamoDB
13 4 (0.62%) SQL Server Reporting Services
14 3 (0.46%) Cloud Spanner
14 3 (0.46%) Elasticsearch
14 3 (0.46%) RDBMS
Development Applications
1 128 (19.69%) JIRA
2 125 (19.23%) GitLab
3 122 (18.77%) SonarQube
4 113 (17.38%) Cucumber
4 113 (17.38%) Maven
5 112 (17.23%) Bitbucket
5 112 (17.23%) Sonatype Nexus
6 111 (17.08%) Selenium
7 44 (6.77%) Git
8 33 (5.08%) Jenkins
9 5 (0.77%) JMeter
10 4 (0.62%) Balsamiq
10 4 (0.62%) Robot Framework
11 3 (0.46%) CircleCI
11 3 (0.46%) Jaeger
11 3 (0.46%) JUnit
12 2 (0.31%) LoadRunner
12 2 (0.31%) NUnit
12 2 (0.31%) REST Assured
12 2 (0.31%) Team Foundation Server
General
1 371 (57.08%) Inclusion and Diversity
2 291 (44.77%) Analytical Skills
3 202 (31.08%) Finance
4 144 (22.15%) Banking
5 91 (14.00%) Social Skills
6 82 (12.62%) Retail
7 70 (10.77%) Corporate Banking
7 70 (10.77%) Investment Banking
8 17 (2.62%) Organisational Skills
9 15 (2.31%) Military
10 10 (1.54%) Manufacturing
11 9 (1.38%) Law
12 6 (0.92%) Marketing
12 6 (0.92%) Telecoms
13 5 (0.77%) Financial Institution
13 5 (0.77%) Games
13 5 (0.77%) Legal
14 4 (0.62%) Automotive
14 4 (0.62%) Influencing Skills
15 3 (0.46%) Documentation Skills
Job Titles
1 260 (40.00%) Infrastructure Engineer
2 145 (22.31%) Software Engineer
3 62 (9.54%) Developer
4 55 (8.46%) Lead
5 46 (7.08%) Senior
6 35 (5.38%) DevOps Engineer
7 23 (3.54%) Cloud Engineer
8 22 (3.38%) Senior Developer
9 19 (2.92%) .NET Developer
10 17 (2.62%) Azure Engineer
11 15 (2.31%) Security Engineer
12 14 (2.15%) Architect
12 14 (2.15%) Technical Leader
13 12 (1.85%) AWS Engineer
14 11 (1.69%) Cloud Security Engineer
14 11 (1.69%) Team Leader
15 10 (1.54%) Lead Developer
16 9 (1.38%) Solutions Architect
17 8 (1.23%) Analyst
17 8 (1.23%) AWS DevOps
Libraries, Frameworks & Software Standards
1 254 (39.08%) Elastic Stack
2 141 (21.69%) React
3 132 (20.31%) Kafka
4 130 (20.00%) Spring
5 125 (19.23%) CSS
6 124 (19.08%) HTML
7 121 (18.62%) Spring Boot
8 110 (16.92%) Redux
9 109 (16.77%) JPA
10 86 (13.23%) RESTful
11 83 (12.77%) REST
12 76 (11.69%) Sass
13 75 (11.54%) Jest
14 71 (10.92%) CSS3
14 71 (10.92%) HTML5
15 70 (10.77%) .NET
16 45 (6.92%) Hibernate
17 34 (5.23%) .NET Core
18 26 (4.00%) Node.js
19 19 (2.92%) AngularJS
Miscellaneous
1 248 (38.15%) Cyberattack
2 138 (21.23%) Product Ownership
3 112 (17.23%) Enterprise Software
4 33 (5.08%) Cloud Native
5 13 (2.00%) Security Posture
6 12 (1.85%) Distributed Systems
6 12 (1.85%) Hybrid Cloud
7 9 (1.38%) Greenfield Project
7 9 (1.38%) Mobile App
7 9 (1.38%) Public Cloud
8 7 (1.08%) Life Science
8 7 (1.08%) Management Information System
9 6 (0.92%) Linux Command Line
10 5 (0.77%) Data Centre
11 4 (0.62%) Cyber Security Posture
11 4 (0.62%) Data Structures
12 3 (0.46%) IoT
12 3 (0.46%) Private Cloud
12 3 (0.46%) Virtual Team
12 3 (0.46%) Wiki
Operating Systems
1 289 (44.46%) Linux
2 263 (40.46%) Windows
3 248 (38.15%) Android
4 13 (2.00%) Unix
5 7 (1.08%) Red Hat Enterprise Linux
6 6 (0.92%) CentOS
7 5 (0.77%) Ubuntu
8 2 (0.31%) AIX
8 2 (0.31%) Debian
8 2 (0.31%) Oracle Linux
8 2 (0.31%) Windows Server
9 1 (0.15%) VMS
9 1 (0.15%) Windows 10
9 1 (0.15%) zOS
Processes & Methodologies
1 306 (47.08%) Problem-Solving
2 271 (41.69%) Infrastructure Engineering
3 263 (40.46%) Line Management
4 262 (40.31%) Platform Engineering
5 260 (40.00%) Agile
6 255 (39.23%) Risk Management
7 253 (38.92%) Task Automation
8 249 (38.31%) Mathematics
9 248 (38.15%) Storage Management
10 239 (36.77%) CI/CD
11 186 (28.62%) Software Engineering
12 180 (27.69%) Microservices
13 161 (24.77%) Containerisation
14 147 (22.62%) Full-Stack Development
15 144 (22.15%) SDLC
16 132 (20.31%) Mentoring
16 132 (20.31%) Test Automation
17 122 (18.77%) Performance Optimisation
18 119 (18.31%) Front End Development
19 93 (14.31%) User Experience
Programming Languages
1 317 (48.77%) Python
2 271 (41.69%) Bash
2 271 (41.69%) PowerShell
3 167 (25.69%) Java
4 160 (24.62%) SQL
5 149 (22.92%) JavaScript
6 108 (16.62%) TypeScript
7 60 (9.23%) C#
8 15 (2.31%) Go
9 8 (1.23%) Bicep
9 8 (1.23%) T-SQL
10 7 (1.08%) PHP
11 3 (0.46%) C++
11 3 (0.46%) PL/SQL
12 2 (0.31%) AWK
12 2 (0.31%) C
12 2 (0.31%) Korn
12 2 (0.31%) Perl
12 2 (0.31%) VB
13 1 (0.15%) X++
Qualifications
1 35 (5.38%) Degree
2 23 (3.54%) Azure Certification
3 19 (2.92%) DBS Check
4 17 (2.62%) AWS Certification
5 15 (2.31%) Security Cleared
6 12 (1.85%) Computer Science Degree
6 12 (1.85%) SC Cleared
7 9 (1.38%) AWS Certified Solutions Architect
8 3 (0.46%) DV Cleared
8 3 (0.46%) Linux+ Certification
8 3 (0.46%) Master's Degree
8 3 (0.46%) Microsoft Certification
8 3 (0.46%) RHCE
9 2 (0.31%) Cisco Certification
10 1 (0.15%) CCIE
10 1 (0.15%) CCNP
10 1 (0.15%) CCSP
10 1 (0.15%) CISSP
10 1 (0.15%) JNCIE
10 1 (0.15%) PhD
Quality Assurance & Compliance
1 141 (21.69%) QA
2 76 (11.69%) Accessibility
3 16 (2.46%) GDPR
4 11 (1.69%) HIPAA
5 10 (1.54%) NIST
6 6 (0.92%) ISO/IEC 27001
7 5 (0.77%) Sarbanes-Oxley
7 5 (0.77%) SOC 2
8 1 (0.15%) Data Quality
8 1 (0.15%) ISO 20022
8 1 (0.15%) NCSC
8 1 (0.15%) PCI DSS
System Software
1 445 (68.46%) Docker
2 252 (38.77%) Hyper-V
3 248 (38.15%) VMware NSX
3 248 (38.15%) vSphere
4 13 (2.00%) Virtual Machines
5 6 (0.92%) Active Directory
6 5 (0.77%) Postfix
7 4 (0.62%) VMware Infrastructure
8 3 (0.46%) Dovecot
9 2 (0.31%) KVM
9 2 (0.31%) Sendmail
10 1 (0.15%) Firmware
10 1 (0.15%) NFS
Systems Management
1 334 (51.38%) Terraform
2 271 (41.69%) Ansible
3 207 (31.85%) Kubernetes
4 16 (2.46%) Grafana
5 9 (1.38%) Prometheus
6 6 (0.92%) Puppet
7 5 (0.77%) Istio
8 4 (0.62%) Argo
8 4 (0.62%) Kibana
9 3 (0.46%) AWS Copilot
9 3 (0.46%) Kustomize
10 2 (0.31%) Nagios
10 2 (0.31%) Nessus
10 2 (0.31%) Salt
10 2 (0.31%) Single Sign-On
11 1 (0.15%) Automic
11 1 (0.15%) cPanel
11 1 (0.15%) Microsoft Intune
11 1 (0.15%) Progress Chef
11 1 (0.15%) Proxmox
Vendors
1 252 (38.77%) Splunk
2 249 (38.31%) Cisco
2 249 (38.31%) Juniper
3 248 (38.15%) 3PAR
4 109 (16.77%) Solace
5 47 (7.23%) Microsoft
6 31 (4.77%) Google
7 23 (3.54%) Oracle
8 6 (0.92%) SAP
9 5 (0.77%) Hitachi
9 5 (0.77%) IBM
9 5 (0.77%) Red Hat
10 4 (0.62%) Databricks
10 4 (0.62%) ServiceNow
10 4 (0.62%) VMware
11 3 (0.46%) Okta
11 3 (0.46%) Ping Identity
11 3 (0.46%) Workday
12 2 (0.31%) Dynatrace
12 2 (0.31%) Tenable