SQL Server Jobs in the North West

Microsoft SQL Server (MS SQL)
England > North West

The table below provides summary statistics for permanent job vacancies advertised in the North West requiring SQL Server skills. It includes a benchmarking guide to the annual salaries offered in vacancies that cited SQL Server over the 6 months leading up to 27 May 2025, comparing them to the same period in the previous two years.

6 months to
27 May 2025
Same period 2024 Same period 2023
Rank 100 32 72
Rank change year-on-year -68 +40 -32
Permanent jobs citing SQL Server 276 547 365
As % of all permanent jobs advertised in the North West 3.55% 5.37% 4.77%
As % of the Database & Business Intelligence category 37.05% 30.36% 25.10%
Number of salaries quoted 152 497 317
10th Percentile £31,250 £35,000 £31,655
25th Percentile £37,500 £40,000 £37,500
Median annual salary (50th Percentile) £50,000 £50,000 £50,000
Median % change year-on-year - - +5.26%
75th Percentile £61,250 £65,000 £61,835
90th Percentile £71,250 £85,000 £75,000
England median annual salary £55,000 £55,000 £57,000
% change year-on-year - -3.51% +3.64%

All Database and Business Intelligence Skills
North West

SQL Server falls under the Databases and Business Intelligence category. For comparison with the information above, the following table provides summary statistics for all permanent job vacancies requiring database or business intelligence skills in the North West.

Permanent vacancies with a requirement for database or business intelligence skills 745 1,802 1,454
As % of all permanent jobs advertised in the North West 9.58% 17.69% 18.99%
Number of salaries quoted 410 1,251 861
10th Percentile £33,750 £33,609 £34,723
25th Percentile £41,000 £40,000 £42,500
Median annual salary (50th Percentile) £55,000 £51,000 £55,000
Median % change year-on-year +7.84% -7.27% +4.21%
75th Percentile £72,777 £66,450 £70,000
90th Percentile £87,500 £84,964 £80,000
England median annual salary £62,500 £57,500 £65,000
% change year-on-year +8.70% -11.54% +8.33%

SQL Server
Job Vacancy Trend in the North West

Job postings citing SQL Server as a proportion of all IT jobs advertised in the North West.
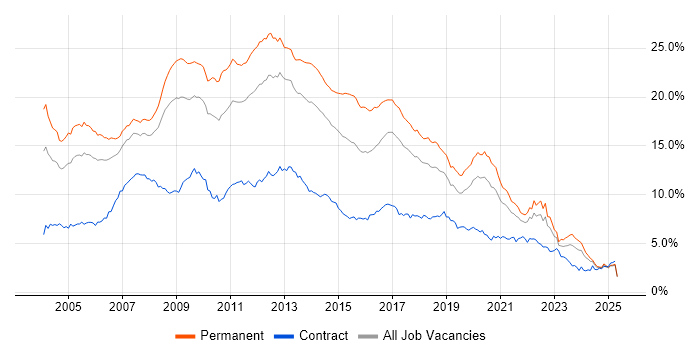
Job vacancy trend for SQL Server in the North West

SQL Server
Salary Trend in the North West

3-month moving average salary quoted in jobs citing SQL Server in the North West.

Salary trend for SQL Server in the North West

SQL Server
Salary Histogram in the North West

Salary distribution for jobs citing SQL Server in the North West over the 6 months to 27 May 2025.

Salary histogram for SQL Server in the North West

SQL Server
Job Locations in the North West

The table below looks at the demand and provides a guide to the median salaries quoted in IT jobs citing SQL Server within the North West region over the 6 months to 27 May 2025. The 'Rank Change' column provides an indication of the change in demand within each location based on the same 6 month period last year.

Location Rank Change
on Same Period
Last Year
Matching
Permanent
IT Job Ads
Median Salary
Past 6 Months
Median Salary
% Change
on Same Period
Last Year
Live
Jobs
Manchester -27 106 £57,500 +15.00% 210
Cheshire -7 64 £48,750 +21.88% 117
Merseyside +8 40 £32,500 -40.91% 66
Lancashire -86 35 £50,000 +17.65% 85
Cumbria -55 31 £41,000 -21.90%
SQL Server
England

SQL Server
Co-occurring Skills and Capabilities in the North West by Category

The follow tables expand on the table above by listing co-occurrences grouped by category. The same employment type, locality and period is covered with up to 20 co-occurrences shown in each of the following categories:

Application Platforms
1 39 (14.13%) Confluence
2 18 (6.52%) CMS
2 18 (6.52%) Umbraco
3 11 (3.99%) IIS
4 8 (2.90%) Microsoft Exchange
5 2 (0.72%) SAS
6 1 (0.36%) Apache Airflow
Applications
1 6 (2.17%) Microsoft Office
2 5 (1.81%) Microsoft Excel
Business Applications
1 1 (0.36%) Dynamics NAV
1 1 (0.36%) Oracle EBS
Cloud Services
1 161 (58.33%) Azure
2 131 (47.46%) AWS
3 45 (16.30%) GCP
4 18 (6.52%) Power Platform
5 13 (4.71%) SaaS
6 7 (2.54%) Microsoft 365
7 5 (1.81%) Azure Data Factory
7 5 (1.81%) Azure DevOps
7 5 (1.81%) Azure Functions
7 5 (1.81%) GitHub
7 5 (1.81%) Serverless
8 4 (1.45%) Azure Service Bus
9 3 (1.09%) Firebase
10 1 (0.36%) Amazon EKS
10 1 (0.36%) Azure Monitor
10 1 (0.36%) Cloudflare
10 1 (0.36%) dbt
10 1 (0.36%) Dynamics 365
10 1 (0.36%) Snowflake
10 1 (0.36%) Stitch
Communications & Networking
1 18 (6.52%) Intranet
2 10 (3.62%) DNS
3 7 (2.54%) DHCP
3 7 (2.54%) NAS
3 7 (2.54%) SAN
4 6 (2.17%) Firewall
5 5 (1.81%) VSAN
6 2 (0.72%) DMZ
6 2 (0.72%) TCP/IP
6 2 (0.72%) VLAN
6 2 (0.72%) VPN
7 1 (0.36%) RTP
Database & Business Intelligence
1 24 (8.70%) MongoDB
2 18 (6.52%) Power BI
3 16 (5.80%) PostgreSQL
4 12 (4.35%) SQL Server Reporting Services
5 10 (3.62%) Data Warehouse
6 8 (2.90%) NoSQL
6 8 (2.90%) Relational Database
7 5 (1.81%) Big Data
7 5 (1.81%) Data Hub
7 5 (1.81%) SQL CLR
8 4 (1.45%) MySQL
9 3 (1.09%) Metadata
9 3 (1.09%) Oracle Database
9 3 (1.09%) SQL Server Analysis Services
9 3 (1.09%) SQL Server Integration Services
10 2 (0.72%) Amazon RDS
10 2 (0.72%) Azure SQL Database
11 1 (0.36%) Couchbase
11 1 (0.36%) Hadoop
11 1 (0.36%) RDBMS
Development Applications
1 111 (40.22%) JIRA
2 110 (39.86%) Bitbucket
2 110 (39.86%) Maven
3 109 (39.49%) Cucumber
3 109 (39.49%) GitLab
3 109 (39.49%) Selenium
3 109 (39.49%) SonarQube
3 109 (39.49%) Sonatype Nexus
4 21 (7.61%) Git
5 6 (2.17%) SQL Server Management Studio (SSMS)
6 5 (1.81%) Oracle Forms
7 3 (1.09%) Cypress.io
7 3 (1.09%) JMeter
8 2 (0.72%) NUnit
9 1 (0.36%) Jasmine
9 1 (0.36%) Karma Test Runner
9 1 (0.36%) Subversion
9 1 (0.36%) Visual Studio
General
1 129 (46.74%) Finance
2 114 (41.30%) Banking
3 109 (39.49%) Inclusion and Diversity
4 84 (30.43%) Retail
5 70 (25.36%) Corporate Banking
5 70 (25.36%) Investment Banking
6 43 (15.58%) Social Skills
7 11 (3.99%) Back Office
8 7 (2.54%) Law
9 5 (1.81%) Analytical Skills
10 2 (0.72%) Legal
10 2 (0.72%) Local Government
10 2 (0.72%) Manufacturing
10 2 (0.72%) Marketing
11 1 (0.36%) Aerospace
11 1 (0.36%) Automotive
11 1 (0.36%) Organisational Skills
Job Titles
1 113 (40.94%) Software Engineer
2 112 (40.58%) Developer
3 38 (13.77%) Software Developer
4 31 (11.23%) .NET Developer
5 27 (9.78%) Senior
6 18 (6.52%) Senior Developer
6 18 (6.52%) Umbraco Developer
7 13 (4.71%) C# Developer
8 11 (3.99%) Data Engineer
8 11 (3.99%) Lead
9 10 (3.62%) SQL Developer
10 9 (3.26%) C# .NET Developer
11 8 (2.90%) Lead Developer
11 8 (2.90%) Senior .NET Developer
12 7 (2.54%) Database Developer
12 7 (2.54%) Full-Stack Developer
12 7 (2.54%) Infrastructure Engineer
13 6 (2.17%) Analyst
13 6 (2.17%) DBA
14 5 (1.81%) Data Analyst
Libraries, Frameworks & Software Standards
1 149 (53.99%) CSS
2 144 (52.17%) HTML
3 121 (43.84%) React
4 119 (43.12%) Kafka
5 110 (39.86%) Spring Boot
6 109 (39.49%) JPA
6 109 (39.49%) Redux
6 109 (39.49%) Spring
7 91 (32.97%) HTML5
8 79 (28.62%) RESTful
9 74 (26.81%) Sass
10 73 (26.45%) CSS3
10 73 (26.45%) Jest
10 73 (26.45%) REST
11 55 (19.93%) .NET
12 39 (14.13%) Hibernate
13 29 (10.51%) .NET Core
14 21 (7.61%) ASP.NET
15 20 (7.25%) jQuery
16 15 (5.43%) .NET Framework
Miscellaneous
1 113 (40.94%) Product Ownership
2 109 (39.49%) Enterprise Software
3 27 (9.78%) Management Information System
4 18 (6.52%) NHS
5 6 (2.17%) Greenfield Project
5 6 (2.17%) Legacy Systems
5 6 (2.17%) Team-Oriented Environment
6 5 (1.81%) Hybrid Cloud
6 5 (1.81%) Private Cloud
7 4 (1.45%) Distributed Systems
7 4 (1.45%) Mobile App
8 3 (1.09%) Clustering
9 2 (0.72%) Data Structures
9 2 (0.72%) Driving Licence
9 2 (0.72%) EPoS
10 1 (0.36%) Algorithms
10 1 (0.36%) Data Centre
10 1 (0.36%) Data Fabric
10 1 (0.36%) Public Cloud
10 1 (0.36%) Self-Motivation
Operating Systems
1 18 (6.52%) Windows
2 16 (5.80%) Linux
3 7 (2.54%) Windows Server
4 2 (0.72%) Windows Server 2012
4 2 (0.72%) Windows Server 2019
5 1 (0.36%) Debian
5 1 (0.36%) Mac OS
5 1 (0.36%) Ubuntu
5 1 (0.36%) Windows 10
Processes & Methodologies
1 183 (66.30%) Agile
2 151 (54.71%) Software Engineering
3 128 (46.38%) Microservices
4 127 (46.01%) CI/CD
5 126 (45.65%) Full-Stack Development
5 126 (45.65%) Performance Optimisation
6 125 (45.29%) DevOps
7 120 (43.48%) SDLC
8 119 (43.12%) Containerisation
9 111 (40.22%) Test Automation
10 110 (39.86%) Front End Development
11 92 (33.33%) Mentoring
12 84 (30.43%) Migration
13 78 (28.26%) Problem-Solving
13 78 (28.26%) User Experience
14 70 (25.36%) Responsive Web Design
14 70 (25.36%) Strategic Thinking
15 67 (24.28%) Clean Code
16 48 (17.39%) TDD
17 47 (17.03%) Continuous Improvement
Programming Languages
1 185 (67.03%) SQL
2 145 (52.54%) Java
3 136 (49.28%) JavaScript
4 95 (34.42%) C#
5 82 (29.71%) TypeScript
6 19 (6.88%) Python
7 17 (6.16%) T-SQL
8 5 (1.81%) PHP
9 3 (1.09%) Bicep
10 2 (0.72%) C++
10 2 (0.72%) PowerShell
10 2 (0.72%) Shell Script
10 2 (0.72%) VB.NET
11 1 (0.36%) Bash
11 1 (0.36%) PL/SQL
11 1 (0.36%) Ruby
11 1 (0.36%) VB
11 1 (0.36%) VB6
11 1 (0.36%) VBA
11 1 (0.36%) VBScript
Qualifications
1 62 (22.46%) Degree
2 5 (1.81%) Azure Certification
2 5 (1.81%) Microsoft Certification
2 5 (1.81%) VMware Certified Professional (VCP)
3 4 (1.45%) DBS Check
3 4 (1.45%) Security Cleared
4 3 (1.09%) BPSS Clearance
4 3 (1.09%) Computer Science Degree
4 3 (1.09%) SC Cleared
5 2 (0.72%) CISM
5 2 (0.72%) CISSP
5 2 (0.72%) CompTIA Security+
5 2 (0.72%) ITIL Certification
5 2 (0.72%) TOGAF Certification
Quality Assurance & Compliance
1 112 (40.58%) QA
2 89 (32.25%) Accessibility
3 20 (7.25%) GDPR
4 18 (6.52%) WCAG
5 6 (2.17%) ISO 9001
6 4 (1.45%) Data Quality
7 2 (0.72%) Cyber Essentials
7 2 (0.72%) ISO/IEC 27001
7 2 (0.72%) NCSC
7 2 (0.72%) NIST
7 2 (0.72%) PCI DSS
System Software
1 121 (43.84%) Docker
2 8 (2.90%) VMware Infrastructure
3 5 (1.81%) Active Directory
3 5 (1.81%) VMware NSX
4 1 (0.36%) Virtual Machines
4 1 (0.36%) vSphere
Systems Management
1 115 (41.67%) Kubernetes
2 8 (2.90%) Terraform
3 5 (1.81%) Progress Chef
4 3 (1.09%) Failover Clustering
4 3 (1.09%) Microsoft Intune
5 1 (0.36%) Grafana
Vendors
1 109 (39.49%) Solace
2 44 (15.94%) Microsoft
3 39 (14.13%) Oracle
4 18 (6.52%) HP
5 13 (4.71%) VMware
6 6 (2.17%) Google
7 5 (1.81%) Splunk
8 4 (1.45%) Databricks
9 3 (1.09%) Cisco
9 3 (1.09%) Sage
9 3 (1.09%) SAP
9 3 (1.09%) Veeam
10 2 (0.72%) ESET
10 2 (0.72%) MobileIron
10 2 (0.72%) Sophos
11 1 (0.36%) Cloudera
11 1 (0.36%) CyberArk
11 1 (0.36%) Imperva
11 1 (0.36%) ServiceNow
11 1 (0.36%) Talend