SQL Server Jobs in England

Microsoft SQL Server (MS SQL)
UK > England

The following table provides summary statistics for permanent job vacancies advertised in England with a requirement for SQL Server skills. Included is a benchmarking guide to the salaries offered in vacancies that have cited SQL Server over the 6 months to 6 December 2023 with a comparison to the same period in the previous 2 years.

6 months to
6 Dec 2023
Same period 2022 Same period 2021
Rank 36 37 34
Rank change year-on-year +1 -3 -11
Permanent jobs citing SQL Server 2,927 7,405 8,570
As % of all permanent jobs advertised in England 6.23% 6.80% 7.68%
As % of the Database & Business Intelligence category 29.40% 29.43% 28.28%
Number of salaries quoted 2,453 5,344 6,808
10th Percentile £36,750 £35,000 £33,750
25th Percentile £46,250 £43,750 £41,000
Median annual salary (50th Percentile) £58,000 £57,500 £51,500
Median % change year-on-year +0.87% +11.65% +3.00%
75th Percentile £72,500 £74,225 £67,500
90th Percentile £87,500 £90,000 £82,500
UK median annual salary £57,500 £55,000 £50,000
% change year-on-year +4.55% +10.00% -

All Database and Business Intelligence Skills
England

SQL Server is in the Databases and Business Intelligence category. The following table is for comparison with the above and provides summary statistics for all permanent job vacancies advertised in England with a requirement for database or business intelligence skills.

Permanent vacancies with a requirement for database or business intelligence skills 9,955 25,160 30,302
As % of all permanent jobs advertised in England 21.19% 23.11% 27.14%
Number of salaries quoted 7,635 15,933 20,222
10th Percentile £37,500 £37,171 £35,750
25th Percentile £47,500 £47,447 £43,000
Median annual salary (50th Percentile) £61,000 £62,500 £60,000
Median % change year-on-year -2.40% +4.17% +9.09%
75th Percentile £80,000 £83,750 £77,500
90th Percentile £96,539 £100,000 £95,000
UK median annual salary £60,000 £62,500 £58,500
% change year-on-year -4.00% +6.84% +6.36%

SQL Server
Job Vacancy Trend in England

Job postings citing SQL Server as a proportion of all IT jobs advertised in England.
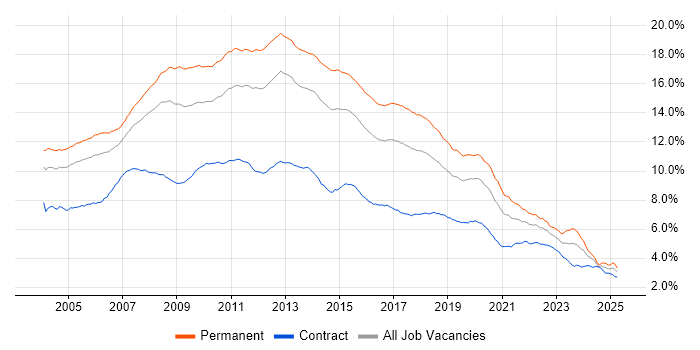
Job vacancy trend for SQL Server in England

SQL Server
Salary Trend in England

3-month moving average salary quoted in jobs citing SQL Server in England.

Salary trend for SQL Server in England

SQL Server
Salary Histogram in England

Salary distribution for jobs citing SQL Server in England over the 6 months to 6 December 2023.

Salary histogram for SQL Server in England

SQL Server
Job Locations in England

The table below looks at the demand and provides a guide to the median salaries quoted in IT jobs citing SQL Server within the England region over the 6 months to 6 December 2023. The 'Rank Change' column provides an indication of the change in demand within each location based on the same 6 month period last year.

Location Rank Change
on Same Period
Last Year
Matching
Permanent
IT Job Ads
Median Salary
Past 6 Months
Median Salary
% Change
on Same Period
Last Year
Live
Jobs
London +8 1,136 £67,500 -3.57% 440
South East +8 514 £55,000 +3.29% 289
North of England -9 493 £50,000 - 324
Midlands +6 392 £52,500 +5.00% 206
North West -22 243 £50,000 - 181
South West -17 242 £52,500 +5.00% 101
West Midlands -1 222 £53,500 +10.88% 134
Yorkshire +1 217 £55,000 +4.76% 104
East Midlands +12 172 £47,500 -5.00% 72
East of England +12 97 £48,000 -12.73% 100
North East +8 33 £45,000 +9.76% 47
SQL Server
UK

SQL Server
Co-occurring Skills and Capabilities in England by Category

The follow tables expand on the table above by listing co-occurrences grouped by category. The same employment type, locality and period is covered with up to 20 co-occurrences shown in each of the following categories:

Application Platforms
1 225 (7.69%) SharePoint
2 170 (5.81%) IIS
3 59 (2.02%) Confluence
4 47 (1.61%) MS Exchange
5 29 (0.99%) Umbraco
6 26 (0.89%) CMS
7 23 (0.79%) Apache
8 19 (0.65%) WebSphere
9 15 (0.51%) NServiceBus
10 13 (0.44%) Apache Airflow
11 12 (0.41%) Apache Spark
11 12 (0.41%) Tomcat
12 8 (0.27%) SAS
12 8 (0.27%) WebSphere Application Server
13 6 (0.20%) SharePoint 2010
13 6 (0.20%) SharePoint 2013
13 6 (0.20%) Sitecore CMS
13 6 (0.20%) Skype for Business
14 5 (0.17%) Headless CMS
14 5 (0.17%) nginx
Applications
1 112 (3.83%) Microsoft Office
2 109 (3.72%) Microsoft Excel
3 11 (0.38%) MS Visio
4 9 (0.31%) AutoCAD
4 9 (0.31%) Microsoft PowerPoint
4 9 (0.31%) Photoshop
4 9 (0.31%) PTC Creo
4 9 (0.31%) SOLIDWORKS
5 8 (0.27%) InDesign
6 5 (0.17%) Chatbot
7 4 (0.14%) LibreOffice
8 3 (0.10%) Spreadsheet
9 1 (0.034%) Adobe Illustrator
9 1 (0.034%) SPSS
Business Applications
1 101 (3.45%) Dynamics CRM
2 68 (2.32%) Endur
3 19 (0.65%) Elite 3E
3 19 (0.65%) Remedy ITSM
4 17 (0.58%) Maximo
5 15 (0.51%) PlanetPress Connect
6 13 (0.44%) BusinessWorks
6 13 (0.44%) Fidessa
6 13 (0.44%) Unit4 Business World
7 12 (0.41%) iTrent
8 11 (0.38%) Dynamics NAV
9 7 (0.24%) NetSuite
9 7 (0.24%) Sage X3
10 6 (0.20%) Sparx Enterprise Architect
11 5 (0.17%) Epicor Tropos
11 5 (0.17%) JDE EnterpriseOne
11 5 (0.17%) JDE OneWorld
11 5 (0.17%) OpenLink RightAngle
11 5 (0.17%) SAP ERP
12 4 (0.14%) Cerner Millennium
Cloud Services
1 1,364 (46.60%) Azure
2 513 (17.53%) Power Platform
3 350 (11.96%) Azure DevOps
4 299 (10.22%) Microsoft 365
5 286 (9.77%) AWS
6 246 (8.40%) SaaS
7 136 (4.65%) Azure Data Factory
8 133 (4.54%) PaaS
9 125 (4.27%) Dynamics 365
10 119 (4.07%) PowerApps
11 109 (3.72%) Entra ID
12 98 (3.35%) Serverless
13 95 (3.25%) IaaS
14 92 (3.14%) Azure Cosmos DB
15 81 (2.77%) Azure Service Bus
16 75 (2.56%) Power Automate
17 72 (2.46%) Azure Logic Apps
18 68 (2.32%) GCP
19 62 (2.12%) Azure Synapse Analytics
20 52 (1.78%) Snowflake
Communications & Networking
1 197 (6.73%) Firewall
2 157 (5.36%) DNS
3 107 (3.66%) DHCP
4 105 (3.59%) SAN
5 94 (3.21%) WAN
6 92 (3.14%) VPN
7 76 (2.60%) LAN
8 67 (2.29%) TCP/IP
9 46 (1.57%) VLAN
10 42 (1.43%) Internet
10 42 (1.43%) VoIP
10 42 (1.43%) Wi-Fi
11 26 (0.89%) HTTP
11 26 (0.89%) Network Security
12 25 (0.85%) NAS
13 22 (0.75%) Wireless
14 17 (0.58%) Remote Desktop
15 15 (0.51%) AMQP
16 14 (0.48%) SMTP
17 13 (0.44%) SSL
Database & Business Intelligence
1 426 (14.55%) Power BI
2 387 (13.22%) SQL Server Integration Services
3 313 (10.69%) Relational Database
4 285 (9.74%) SQL Server Reporting Services
5 279 (9.53%) Data Warehouse
6 226 (7.72%) MySQL
7 192 (6.56%) Azure SQL Database
8 140 (4.78%) RDBMS
9 138 (4.71%) PostgreSQL
10 125 (4.27%) SQL Server Analysis Services
11 94 (3.21%) NoSQL
12 81 (2.77%) Oracle Database
13 80 (2.73%) Data Lake
14 69 (2.36%) Tableau
15 68 (2.32%) MongoDB
16 52 (1.78%) Microsoft Analysis Services
17 44 (1.50%) Amazon RDS
18 33 (1.13%) Oracle Database 10g
19 32 (1.09%) Big Data
20 31 (1.06%) Oracle Database 11g
Development Applications
1 304 (10.39%) Git
2 148 (5.06%) JIRA
3 137 (4.68%) Visual Studio
4 73 (2.49%) SQL Server Management Studio (SSMS)
5 72 (2.46%) Jenkins
6 67 (2.29%) Team Foundation Server
7 47 (1.61%) Postman
8 38 (1.30%) Subversion
9 31 (1.06%) Selenium
10 28 (0.96%) TeamCity
11 26 (0.89%) SoapUI
12 24 (0.82%) GitLab
13 23 (0.79%) Cucumber
14 22 (0.75%) JMeter
14 22 (0.75%) LoadRunner
15 20 (0.68%) eggPlant
15 20 (0.68%) REST Assured
15 20 (0.68%) The Grinder
16 18 (0.61%) Maven
16 18 (0.61%) SpecFlow
General
1 688 (23.51%) Social Skills
2 599 (20.46%) Finance
3 261 (8.92%) Analytical Skills
4 121 (4.13%) Law
5 120 (4.10%) Banking
6 110 (3.76%) Legal
6 110 (3.76%) Retail
7 103 (3.52%) Marketing
8 78 (2.66%) Games
8 78 (2.66%) Public Sector
9 59 (2.02%) Inclusion and Diversity
10 44 (1.50%) Manufacturing
11 38 (1.30%) Back Office
12 36 (1.23%) Documentation Skills
13 35 (1.20%) Presentation Skills
14 30 (1.02%) Financial Institution
15 29 (0.99%) Telecoms
16 28 (0.96%) Automotive
17 27 (0.92%) Advertising
18 26 (0.89%) Organisational Skills
Job Titles
1 1,175 (40.14%) Developer
2 512 (17.49%) Senior
3 378 (12.91%) .NET Developer
4 298 (10.18%) Analyst
5 266 (9.09%) C# Developer
6 253 (8.64%) Lead
7 247 (8.44%) Software Developer
8 216 (7.38%) Senior Developer
9 168 (5.74%) Full Stack Developer
10 166 (5.67%) Infrastructure Engineer
11 165 (5.64%) Architect
11 165 (5.64%) SQL Developer
12 159 (5.43%) DBA
13 148 (5.06%) Applications Support
13 148 (5.06%) Data Engineer
14 138 (4.71%) Software Engineer
15 132 (4.51%) Support Analyst
16 126 (4.30%) C# .NET Developer
17 121 (4.13%) Administrator
18 104 (3.55%) Lead Developer
Libraries, Frameworks & Software Standards
1 1,126 (38.47%) .NET
2 493 (16.84%) HTML
3 455 (15.54%) ASP.NET
4 419 (14.31%) CSS
5 379 (12.95%) .NET Core
6 346 (11.82%) .NET Framework
7 305 (10.42%) AngularJS
8 286 (9.77%) React
9 276 (9.43%) REST
10 224 (7.65%) ASP.NET MVC
11 205 (7.00%) XML
12 196 (6.70%) Web Services
13 174 (5.94%) JSON
14 170 (5.81%) Entity Framework
15 153 (5.23%) ASP.NET Web API
15 153 (5.23%) jQuery
16 133 (4.54%) SOAP
17 130 (4.44%) HTML5
18 128 (4.37%) RESTful
19 91 (3.11%) Node.js
Miscellaneous
1 113 (3.86%) Enterprise Software
2 105 (3.59%) Virtual Team
3 102 (3.48%) Management Information System
4 91 (3.11%) Legacy Systems
5 80 (2.73%) Product Ownership
6 78 (2.66%) Replication
7 72 (2.46%) Self-Motivation
8 70 (2.39%) Data Structures
9 67 (2.29%) Swaptions
10 61 (2.08%) Public Cloud
11 59 (2.02%) Clustering
12 52 (1.78%) Greenfield Project
13 49 (1.67%) Data Centre
14 48 (1.64%) Low-Code
15 40 (1.37%) Mobile App
16 32 (1.09%) Reinsurance
17 31 (1.06%) Cloud Native
18 24 (0.82%) Hedge funds
19 23 (0.79%) IoT
20 22 (0.75%) Housing Association
Operating Systems
1 574 (19.61%) Windows
2 305 (10.42%) Windows Server
3 168 (5.74%) Linux
4 69 (2.36%) Windows Server 2012
5 67 (2.29%) Windows 10
6 65 (2.22%) Unix
7 58 (1.98%) Windows Server 2019
8 43 (1.47%) Windows Server 2016
9 23 (0.79%) CentOS
10 22 (0.75%) Android
11 19 (0.65%) Ubuntu
12 17 (0.58%) Red Hat Enterprise Linux
13 15 (0.51%) Mac OS
14 14 (0.48%) Solaris
15 10 (0.34%) Windows Server 2008
16 9 (0.31%) Apple iOS
16 9 (0.31%) VMS
17 8 (0.27%) Debian
18 5 (0.17%) Data ONTAP
19 3 (0.10%) Mac OS X
Processes & Methodologies
1 856 (29.24%) Agile
2 669 (22.86%) DevOps
3 578 (19.75%) Problem-Solving
4 503 (17.18%) Business Intelligence
5 377 (12.88%) MVC
6 342 (11.68%) CI/CD
7 339 (11.58%) Full Stack Development
8 317 (10.83%) Software Engineering
9 261 (8.92%) ETL
10 256 (8.75%) Mentoring
11 241 (8.23%) SDLC
12 232 (7.93%) Data Modelling
13 226 (7.72%) TDD
14 223 (7.62%) Scrum
15 210 (7.17%) Migration
16 205 (7.00%) ITIL
16 205 (7.00%) Unit Testing
17 204 (6.97%) Analytics
18 188 (6.42%) Infrastructure Engineering
19 182 (6.22%) Microservices
Programming Languages
1 1,597 (54.56%) SQL
2 1,149 (39.26%) C#
3 733 (25.04%) JavaScript
4 519 (17.73%) T-SQL
5 328 (11.21%) PowerShell
6 306 (10.45%) Python
7 238 (8.13%) Java
8 157 (5.36%) TypeScript
9 125 (4.27%) VB
10 102 (3.48%) VB.NET
11 85 (2.90%) PHP
12 82 (2.80%) PL/SQL
13 60 (2.05%) Bash
14 51 (1.74%) Data Analysis Expressions
15 49 (1.67%) Perl
16 39 (1.33%) R
17 37 (1.26%) C
18 23 (0.79%) JSX
18 23 (0.79%) VBA
19 21 (0.72%) Scala
Qualifications
1 417 (14.25%) Degree
2 217 (7.41%) Security Cleared
3 165 (5.64%) SC Cleared
4 133 (4.54%) Microsoft Certification
5 87 (2.97%) Computer Science Degree
6 86 (2.94%) Azure Certification
7 36 (1.23%) DV Cleared
8 26 (0.89%) MCSA
8 26 (0.89%) MCSE
9 20 (0.68%) ITIL Certification
9 20 (0.68%) Master's Degree
10 18 (0.61%) AWS Certification
10 18 (0.61%) BPSS Clearance
11 14 (0.48%) DBS Check
12 12 (0.41%) Cisco Certification
13 10 (0.34%) MCP
13 10 (0.34%) VMware Certified Professional (VCP)
14 9 (0.31%) CCNA
15 8 (0.27%) AWS Certified Solutions Architect
15 8 (0.27%) ISTQB
Quality Assurance & Compliance
1 108 (3.69%) QA
2 81 (2.77%) Data Quality
3 60 (2.05%) SLA
4 44 (1.50%) ISO/IEC 27001
5 31 (1.06%) Accessibility
6 24 (0.82%) Cyber Essentials
7 23 (0.79%) PCI DSS
8 12 (0.41%) GDPR
8 12 (0.41%) PMO
9 9 (0.31%) Cyber Essentials PLUS
10 8 (0.27%) HL7
11 6 (0.20%) ISO 9000
11 6 (0.20%) WCAG
12 4 (0.14%) GxP
13 3 (0.10%) DICOM
14 2 (0.068%) NCSC
14 2 (0.068%) NIST
15 1 (0.034%) IFRS
15 1 (0.034%) IFRS 17
15 1 (0.034%) ISO 20022
System Software
1 373 (12.74%) Active Directory
2 180 (6.15%) VMware Infrastructure
3 112 (3.83%) Docker
4 60 (2.05%) Hyper-V
5 39 (1.33%) vSphere
6 24 (0.82%) Virtual Servers
7 22 (0.75%) VMware ESXi
8 14 (0.48%) Virtual Machines
9 9 (0.31%) Virtual Desktop
10 7 (0.24%) XenApp
11 6 (0.20%) Firmware
12 5 (0.17%) VMware NSX
13 4 (0.14%) XenDesktop
14 3 (0.10%) Ceph
14 3 (0.10%) KVM
14 3 (0.10%) NFS
15 2 (0.068%) ACF2
15 2 (0.068%) Microsoft App-V
15 2 (0.068%) pfSense
15 2 (0.068%) RACF
Systems Management
1 131 (4.48%) Kubernetes
2 72 (2.46%) Terraform
3 70 (2.39%) Microsoft Intune
4 48 (1.64%) Ansible
5 41 (1.40%) SCCM
6 18 (0.61%) HP Quality Center
6 18 (0.61%) Single Sign-On
7 16 (0.55%) Active Directory Federation Services
8 13 (0.44%) Microsoft Clustering
8 13 (0.44%) Nessus
8 13 (0.44%) vCenter Server
9 12 (0.41%) Failover Clustering
9 12 (0.41%) SCOM
10 11 (0.38%) Grafana
11 10 (0.34%) WSUS
12 9 (0.31%) Puppet
13 8 (0.27%) Control-M
13 8 (0.27%) McAfee ePO
13 8 (0.27%) Nagios
13 8 (0.27%) Oracle RMAN
Vendors
1 1,261 (43.08%) Microsoft
2 396 (13.53%) Oracle
3 281 (9.60%) VMware
4 80 (2.73%) Databricks
4 80 (2.73%) TIBCO
5 72 (2.46%) Sybase
6 68 (2.32%) OpenLink
7 63 (2.15%) Cisco
8 62 (2.12%) Citrix
9 61 (2.08%) SAP
10 57 (1.95%) HP
11 55 (1.88%) Xamarin
12 48 (1.64%) ServiceNow
13 43 (1.47%) IBM
14 38 (1.30%) Veeam
15 35 (1.20%) Red Hat
16 34 (1.16%) Dynatrace
17 29 (0.99%) AppDynamics
18 28 (0.96%) Alteryx
19 27 (0.92%) Remedy