PowerShell Jobs in the Thames Valley

Windows PowerShell
South East > Thames Valley

The table below provides summary statistics for permanent job vacancies advertised in the Thames Valley requiring PowerShell skills. It includes a benchmarking guide to the annual salaries offered in vacancies that cited PowerShell over the 6 months leading up to 22 March 2025, comparing them to the same period in the previous two years.

6 months to
22 Mar 2025
Same period 2024 Same period 2023
Rank 90 103 60
Rank change year-on-year +13 -43 +54
Permanent jobs citing PowerShell 70 155 293
As % of all permanent jobs advertised in the Thames Valley 2.54% 2.42% 4.80%
As % of the Programming Languages category 8.19% 7.76% 12.02%
Number of salaries quoted 50 114 138
10th Percentile £31,925 £34,500 £27,500
25th Percentile £38,750 £42,200 £34,324
Median annual salary (50th Percentile) £47,500 £54,000 £46,500
Median % change year-on-year -12.04% +16.13% +3.33%
75th Percentile £60,000 £59,000 £60,000
90th Percentile £68,000 £66,375 £105,000
South East median annual salary £60,000 £52,500 £52,500
% change year-on-year +14.29% - -4.55%

All Programming Languages
Thames Valley

PowerShell falls under the Programming Languages category. For comparison with the information above, the following table provides summary statistics for all permanent job vacancies requiring coding skills in the Thames Valley.

Permanent vacancies with a requirement for coding skills 855 1,998 2,437
As % of all permanent jobs advertised in the Thames Valley 30.98% 31.14% 39.89%
Number of salaries quoted 580 1,569 1,379
10th Percentile £36,250 £36,250 £34,324
25th Percentile £47,000 £42,500 £42,500
Median annual salary (50th Percentile) £60,000 £55,000 £57,500
Median % change year-on-year +9.09% -4.35% -
75th Percentile £76,000 £71,250 £77,500
90th Percentile £87,500 £85,000 £92,500
South East median annual salary £57,000 £55,000 £57,500
% change year-on-year +3.64% -4.35% +4.55%

PowerShell
Job Vacancy Trend in the Thames Valley

Job postings citing PowerShell as a proportion of all IT jobs advertised in the Thames Valley.
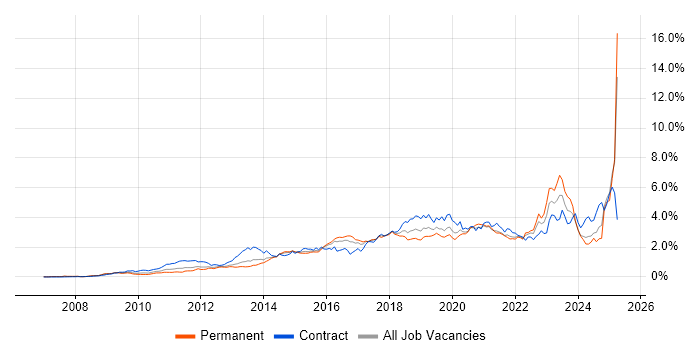
Job vacancy trend for PowerShell in the Thames Valley

PowerShell
Salary Trend in the Thames Valley

3-month moving average salary quoted in jobs citing PowerShell in the Thames Valley.

Salary trend for PowerShell in the Thames Valley

PowerShell
Salary Histogram in the Thames Valley

Salary distribution for jobs citing PowerShell in the Thames Valley over the 6 months to 22 March 2025.

Salary histogram for PowerShell in the Thames Valley

PowerShell
Job Locations in the Thames Valley

The table below looks at the demand and provides a guide to the median salaries quoted in IT jobs citing PowerShell within the Thames Valley region over the 6 months to 22 March 2025. The 'Rank Change' column provides an indication of the change in demand within each location based on the same 6 month period last year.

Location Rank Change
on Same Period
Last Year
Matching
Permanent
IT Job Ads
Median Salary
Past 6 Months
Median Salary
% Change
on Same Period
Last Year
Live
Jobs
Buckinghamshire +54 37 £47,500 +11.76% 7
Berkshire -17 28 £55,000 - 21
Oxfordshire +35 5 £42,500 +44.19% 8
PowerShell
South East

PowerShell
Co-occurring Skills and Capabilities in the Thames Valley by Category

The follow tables expand on the table above by listing co-occurrences grouped by category. The same employment type, locality and period is covered with up to 20 co-occurrences shown in each of the following categories:

Application Platforms
1 19 (27.14%) SharePoint
2 8 (11.43%) IIS
3 6 (8.57%) Microsoft Exchange
4 4 (5.71%) Apache
5 1 (1.43%) OpenStack
5 1 (1.43%) SharePoint Server
Applications
1 12 (17.14%) Microsoft Office
2 2 (2.86%) Microsoft Excel
2 2 (2.86%) Microsoft PowerPoint
2 2 (2.86%) MS Visio
Cloud Services
1 45 (64.29%) Azure
2 24 (34.29%) Microsoft 365
3 19 (27.14%) Azure DevOps
4 14 (20.00%) Power Platform
5 13 (18.57%) Power Automate
5 13 (18.57%) PowerApps
6 12 (17.14%) Entra ID
7 11 (15.71%) AWS
8 7 (10.00%) SaaS
9 6 (8.57%) Azure Sentinel
9 6 (8.57%) PaaS
10 5 (7.14%) Azure Cosmos DB
10 5 (7.14%) Cloudflare
10 5 (7.14%) IaaS
11 4 (5.71%) GitHub
11 4 (5.71%) GitHub Actions
11 4 (5.71%) OneDrive
12 3 (4.29%) Azure Logic Apps
12 3 (4.29%) GCP
13 2 (2.86%) Azure Storage
Communications & Networking
1 18 (25.71%) DNS
2 11 (15.71%) TCP/IP
3 10 (14.29%) Firewall
4 9 (12.86%) 5G
4 9 (12.86%) Bluetooth
4 9 (12.86%) LTE
4 9 (12.86%) Wi-Fi
5 8 (11.43%) Internet
6 6 (8.57%) DHCP
6 6 (8.57%) VPN
7 5 (7.14%) SSL
8 3 (4.29%) Network Security
9 2 (2.86%) VLAN
9 2 (2.86%) VoIP
9 2 (2.86%) Wireless
10 1 (1.43%) Broadband
10 1 (1.43%) iSCSI
10 1 (1.43%) Unified Communications
10 1 (1.43%) VSAN
Database & Business Intelligence
1 24 (34.29%) SQL Server
2 6 (8.57%) Azure SQL Database
3 5 (7.14%) Power BI
4 4 (5.71%) Data Warehouse
4 4 (5.71%) Relational Database
5 3 (4.29%) SQL Server Integration Services
5 3 (4.29%) SQL Server Reporting Services
6 1 (1.43%) Azure SQL Data Warehouse
6 1 (1.43%) Data Lake
6 1 (1.43%) NoSQL
6 1 (1.43%) PostgreSQL
6 1 (1.43%) Power Query
Development Applications
1 3 (4.29%) SQL Server Management Studio (SSMS)
2 2 (2.86%) Git
2 2 (2.86%) Jenkins
2 2 (2.86%) Visual Studio
3 1 (1.43%) gulp
3 1 (1.43%) JIRA
3 1 (1.43%) Yeoman
General
1 30 (42.86%) Social Skills
2 9 (12.86%) Electronics
2 9 (12.86%) Inclusion and Diversity
3 7 (10.00%) Analytical Skills
4 6 (8.57%) Public Sector
5 4 (5.71%) Back Office
5 4 (5.71%) Local Government
5 4 (5.71%) Telecoms
6 2 (2.86%) Retail
7 1 (1.43%) Billing
7 1 (1.43%) Finance
7 1 (1.43%) Legal
7 1 (1.43%) Organisational Skills
Job Titles
1 17 (24.29%) Developer
2 12 (17.14%) Analyst
2 12 (17.14%) Infrastructure Engineer
3 10 (14.29%) Lead
4 9 (12.86%) Lead Infrastructure Engineer
4 9 (12.86%) SharePoint Developer
5 6 (8.57%) SOC Analyst
6 5 (7.14%) Azure Engineer
7 4 (5.71%) Applications Developer
7 4 (5.71%) Infrastructure Manager
7 4 (5.71%) Site Engineer
7 4 (5.71%) Site Reliability Engineer
8 3 (4.29%) Data Manager
8 3 (4.29%) Data Warehouse Manager
8 3 (4.29%) Senior
9 2 (2.86%) IT Analyst
9 2 (2.86%) IT Support
9 2 (2.86%) Platform Engineer
9 2 (2.86%) Senior Applications Developer
9 2 (2.86%) Support Engineer
Libraries, Frameworks & Software Standards
1 15 (21.43%) .NET
2 13 (18.57%) React
3 12 (17.14%) ASP.NET
3 12 (17.14%) CSS
3 12 (17.14%) HTML
3 12 (17.14%) HTML5
4 11 (15.71%) XML
5 10 (14.29%) SPFx
6 4 (5.71%) AngularJS
6 4 (5.71%) jQuery
7 3 (4.29%) .NET Framework
7 3 (4.29%) CSS3
7 3 (4.29%) Vue
7 3 (4.29%) YAML
8 2 (2.86%) ASP.NET Core
8 2 (2.86%) Entity Framework
8 2 (2.86%) JWT
8 2 (2.86%) Middleware
8 2 (2.86%) Razor View Engine
8 2 (2.86%) Redux
Miscellaneous
1 9 (12.86%) Client/Server
1 9 (12.86%) IoT
1 9 (12.86%) NB-IoT
2 8 (11.43%) Data Centre
3 7 (10.00%) Management Information System
4 5 (7.14%) Cyber Threat
4 5 (7.14%) Replication
5 4 (5.71%) Clustering
5 4 (5.71%) Onboarding
6 2 (2.86%) Greenfield Project
6 2 (2.86%) Legacy Systems
6 2 (2.86%) Low-Code
7 1 (1.43%) Cloud Native
7 1 (1.43%) Data Structures
7 1 (1.43%) Driving Licence
7 1 (1.43%) IVR
7 1 (1.43%) Life Science
7 1 (1.43%) Self-Motivation
7 1 (1.43%) Video Conferencing
Operating Systems
1 45 (64.29%) Windows
2 29 (41.43%) Windows Server
3 18 (25.71%) Linux
4 5 (7.14%) Mac OS
5 4 (5.71%) Windows 10
6 1 (1.43%) Ubuntu
6 1 (1.43%) Unix
6 1 (1.43%) Windows Server 2012
Processes & Methodologies
1 22 (31.43%) DevOps
2 18 (25.71%) Problem-Solving
3 15 (21.43%) Cybersecurity
3 15 (21.43%) Project Management
4 14 (20.00%) Customer Service
4 14 (20.00%) Infrastructure as Code
4 14 (20.00%) Infrastructure Engineering
5 13 (18.57%) ITIL
5 13 (18.57%) Strategic Thinking
6 10 (14.29%) Analytics
6 10 (14.29%) Penetration Testing
7 9 (12.86%) Asset Management
7 9 (12.86%) Project Planning
7 9 (12.86%) Software Testing
7 9 (12.86%) Stakeholder Management
8 7 (10.00%) Business Intelligence
8 7 (10.00%) SIEM
9 6 (8.57%) Decision-Making
9 6 (8.57%) ITSM
9 6 (8.57%) Security Operations
Programming Languages
1 33 (47.14%) Python
2 23 (32.86%) C#
3 21 (30.00%) JavaScript
3 21 (30.00%) SQL
4 15 (21.43%) Bash
5 12 (17.14%) TypeScript
6 6 (8.57%) VBScript
7 5 (7.14%) Go
8 3 (4.29%) Bicep
9 2 (2.86%) VB
10 1 (1.43%) Perl
10 1 (1.43%) T-SQL
Qualifications
1 15 (21.43%) CompTIA Security+
2 12 (17.14%) Security Cleared
3 11 (15.71%) Degree
4 9 (12.86%) Network+ Certification
5 8 (11.43%) SC Cleared
6 3 (4.29%) Microsoft Certification
7 2 (2.86%) MCSE
7 2 (2.86%) VMware Certified Professional (VCP)
8 1 (1.43%) A+ Certification
8 1 (1.43%) CompTIA CySA+
8 1 (1.43%) DV Cleared
8 1 (1.43%) MCSA
8 1 (1.43%) VCAP
Quality Assurance & Compliance
1 5 (7.14%) SLA
2 2 (2.86%) QA
3 1 (1.43%) GDPR
3 1 (1.43%) HIPAA
System Software
1 23 (32.86%) Active Directory
2 18 (25.71%) VMware Infrastructure
3 11 (15.71%) vSphere
4 8 (11.43%) Hyper-V
5 4 (5.71%) Docker
6 3 (4.29%) Virtual Desktop
7 2 (2.86%) Virtual Machines
8 1 (1.43%) NFS
8 1 (1.43%) vCloud
8 1 (1.43%) VMware ESXi
8 1 (1.43%) VMware NSX
Systems Management
1 14 (20.00%) Terraform
2 11 (15.71%) Ansible
3 9 (12.86%) Puppet
4 5 (7.14%) Failover Clustering
4 5 (7.14%) Graylog
5 4 (5.71%) Kubernetes
5 4 (5.71%) ZABBIX
6 3 (4.29%) SCCM
7 2 (2.86%) PowerCLI
7 2 (2.86%) vRealize
8 1 (1.43%) FortiGate
8 1 (1.43%) Grafana
8 1 (1.43%) Microsoft Intune
8 1 (1.43%) Prometheus
8 1 (1.43%) Single Sign-On
8 1 (1.43%) vCenter Server
8 1 (1.43%) VxRail
Vendors
1 54 (77.14%) Microsoft
2 18 (25.71%) VMware
3 9 (12.86%) Cisco
4 6 (8.57%) Apple
5 4 (5.71%) Oracle
6 3 (4.29%) Fortinet
7 2 (2.86%) Citrix
7 2 (2.86%) Freshdesk
7 2 (2.86%) Meraki
7 2 (2.86%) SolarWinds
7 2 (2.86%) Sophos
8 1 (1.43%) AlienVault
8 1 (1.43%) Databricks
8 1 (1.43%) Datto
8 1 (1.43%) Intapp
8 1 (1.43%) LogRhythm
8 1 (1.43%) Okta
8 1 (1.43%) Palo Alto
8 1 (1.43%) Veeam
8 1 (1.43%) Xerox