Project Management Jobs in the West Midlands

Project Management
England > West Midlands

The following table provides summary statistics for permanent job vacancies advertised in the West Midlands with a requirement for Project Management skills. Included is a benchmarking guide to the salaries offered in vacancies that have cited Project Management over the 6 months to 5 May 2024 with a comparison to the same period in the previous 2 years.

6 months to
5 May 2024
Same period 2023 Same period 2022
Rank 15 16 18
Rank change year-on-year +1 +2 +10
Permanent jobs citing Project Management 633 775 742
As % of all permanent jobs advertised in the West Midlands 8.72% 11.80% 10.18%
As % of the Processes & Methodologies category 10.49% 12.19% 10.65%
Number of salaries quoted 472 333 514
10th Percentile £36,025 £38,125 £35,125
25th Percentile £42,500 £45,000 £42,275
Median annual salary (50th Percentile) £55,000 £55,000 £50,000
Median % change year-on-year - +10.00% +3.63%
75th Percentile £65,000 £65,000 £62,500
90th Percentile £80,000 £73,750 £73,750
England median annual salary £52,500 £59,500 £57,000
% change year-on-year -11.76% +4.39% +3.64%

All Process and Methodology Skills
West Midlands

Project Management is in the Processes and Methodologies category. The following table is for comparison with the above and provides summary statistics for all permanent job vacancies advertised in the West Midlands with a requirement for process or methodology skills.

Permanent vacancies with a requirement for process or methodology skills 6,033 6,360 6,967
As % of all permanent jobs advertised in the West Midlands 83.12% 96.80% 95.54%
Number of salaries quoted 4,542 3,272 4,767
10th Percentile £26,250 £31,000 £31,250
25th Percentile £35,713 £40,000 £38,750
Median annual salary (50th Percentile) £50,000 £53,125 £50,000
Median % change year-on-year -5.88% +6.25% +5.26%
75th Percentile £63,750 £67,500 £65,000
90th Percentile £77,500 £80,000 £80,000
England median annual salary £55,000 £62,500 £60,000
% change year-on-year -12.00% +4.17% +9.09%

Project Management
Job Vacancy Trend in the West Midlands

Job postings citing Project Management as a proportion of all IT jobs advertised in the West Midlands.
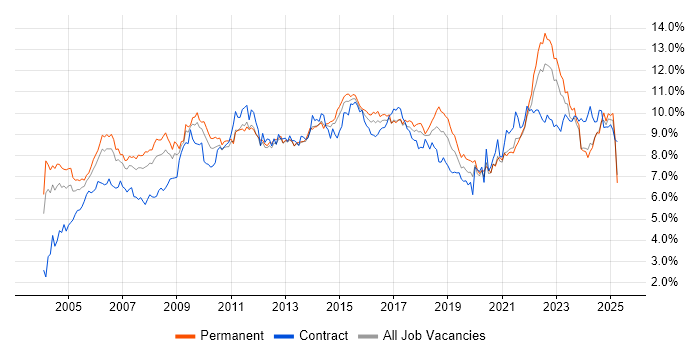
Job vacancy trend for Project Management in the West Midlands

Project Management
Salary Trend in the West Midlands

3-month moving average salary quoted in jobs citing Project Management in the West Midlands.

Salary trend for Project Management in the West Midlands

Project Management
Salary Histogram in the West Midlands

Salary distribution for jobs citing Project Management in the West Midlands over the 6 months to 5 May 2024.

Salary histogram for Project Management in the West Midlands

Project Management
Job Locations in the West Midlands

The table below looks at the demand and provides a guide to the median salaries quoted in IT jobs citing Project Management within the West Midlands region over the 6 months to 5 May 2024. The 'Rank Change' column provides an indication of the change in demand within each location based on the same 6 month period last year.

Location Rank Change
on Same Period
Last Year
Matching
Permanent
IT Job Ads
Median Salary
Past 6 Months
Median Salary
% Change
on Same Period
Last Year
Live
Jobs
Birmingham +10 247 £55,000 -4.35% 107
Warwickshire -9 90 £50,000 -4.76% 48
Staffordshire -10 73 £52,500 -5.33% 26
Shropshire +12 38 £50,000 -13.04% 13
Wolverhampton +21 29 £53,500 -2.73% 8
Solihull +3 23 £47,500 -2.56% 4
Worcestershire -20 19 £45,000 -0.71% 21
Herefordshire +2 16 £35,000 -24.32% 2
Coventry +17 7 £45,000 -18.18% 35
Walsall +22 5 £47,500 -9.52% 4
Dudley - 4 £53,500 - 3
Halesowen - 4 £35,000 - 1
Wednesbury -4 2 £83,250 +166.40%
Brierley Hill - 1 - -
Project Management
England

Project Management
Co-occurring Skills and Capabilities in the West Midlands by Category

The follow tables expand on the table above by listing co-occurrences grouped by category. The same employment type, locality and period is covered with up to 20 co-occurrences shown in each of the following categories:

Application Platforms
1 37 (5.85%) SharePoint
2 13 (2.05%) Confluence
3 11 (1.74%) Microsoft Exchange
4 9 (1.42%) WordPress
5 7 (1.11%) CMS
6 4 (0.63%) Office Communications Server
7 2 (0.32%) Alfresco
7 2 (0.32%) Captiva
7 2 (0.32%) Documentum
8 1 (0.16%) Adobe Experience Manager
Applications
1 46 (7.27%) Microsoft Excel
2 31 (4.90%) Microsoft Office
3 23 (3.63%) Microsoft Project
4 17 (2.69%) Microsoft PowerPoint
5 13 (2.05%) AutoCAD
6 10 (1.58%) Spreadsheet
7 9 (1.42%) MS Visio
8 6 (0.95%) Trello
9 4 (0.63%) Adobe Creative Suite
9 4 (0.63%) Adobe Illustrator
9 4 (0.63%) InDesign
9 4 (0.63%) Simulink
10 2 (0.32%) 3ds Max
10 2 (0.32%) Adobe XD
10 2 (0.32%) Chatbot
10 2 (0.32%) Sketch
Business Applications
1 8 (1.26%) SAP S/4HANA
2 5 (0.79%) Dynamics CRM
3 3 (0.47%) Dynamics NAV
3 3 (0.47%) ProductWriter
3 3 (0.47%) Sage 200
3 3 (0.47%) Sage 300 ERP
4 2 (0.32%) Oracle EBS
4 2 (0.32%) Shopify
5 1 (0.16%) CA PPM
5 1 (0.16%) Epicor Vantage
5 1 (0.16%) Magento
5 1 (0.16%) SAP BPC
5 1 (0.16%) SAP Business ByDesign
5 1 (0.16%) SAP FSCM
5 1 (0.16%) SAP MDG
5 1 (0.16%) SAP Oil and Gas
5 1 (0.16%) SAP PP
Cloud Services
1 59 (9.32%) Azure
2 50 (7.90%) Power Platform
3 46 (7.27%) Microsoft 365
4 27 (4.27%) SaaS
5 25 (3.95%) Azure DevOps
6 20 (3.16%) AWS
7 19 (3.00%) Dynamics 365
8 18 (2.84%) Power Automate
9 13 (2.05%) Smartsheet
10 12 (1.90%) PowerApps
11 10 (1.58%) IaaS
11 10 (1.58%) PaaS
12 9 (1.42%) GitHub
12 9 (1.42%) Google Drive
13 8 (1.26%) GitHub Actions
14 7 (1.11%) Mavenlink
15 5 (0.79%) Amazon EC2
15 5 (0.79%) Amazon S3
15 5 (0.79%) OneDrive
16 4 (0.63%) Entra ID
Communications & Networking
1 9 (1.42%) Firewall
2 8 (1.26%) Intranet
2 8 (1.26%) WAN
3 6 (0.95%) SD-WAN
4 4 (0.63%) DHCP
4 4 (0.63%) DNS
4 4 (0.63%) Fibre Channel
4 4 (0.63%) iSCSI
4 4 (0.63%) LAN
4 4 (0.63%) SNMP
5 3 (0.47%) Extranet
5 3 (0.47%) Internet
5 3 (0.47%) Network Security
5 3 (0.47%) WebEx
6 2 (0.32%) 4G
6 2 (0.32%) 5G
6 2 (0.32%) FlexRay
6 2 (0.32%) SAN
6 2 (0.32%) TCP/IP
6 2 (0.32%) VPN
Database & Business Intelligence
1 44 (6.95%) Power BI
2 15 (2.37%) MySQL
3 11 (1.74%) SQL Server
4 8 (1.26%) Data Lake
4 8 (1.26%) SQL Server Reporting Services
5 7 (1.11%) Data Warehouse
6 6 (0.95%) Data Mining
6 6 (0.95%) Relational Database
7 5 (0.79%) Metadata
8 4 (0.63%) Amazon RDS
8 4 (0.63%) Amazon Redshift
8 4 (0.63%) RDBMS
9 3 (0.47%) Tableau
10 2 (0.32%) EDMS
10 2 (0.32%) SQL Server Analysis Services
10 2 (0.32%) SQL Server Integration Services
Development Applications
1 34 (5.37%) JIRA
2 15 (2.37%) Git
3 8 (1.26%) SonarQube
4 5 (0.79%) Postman
4 5 (0.79%) Visual Studio
5 2 (0.32%) Android Studio
5 2 (0.32%) Axure RP
5 2 (0.32%) gulp
6 1 (0.16%) GitLab
6 1 (0.16%) LSMW
6 1 (0.16%) Visual Studio Team System
General
1 293 (46.29%) Social Skills
2 202 (31.91%) Finance
3 109 (17.22%) Analytical Skills
4 67 (10.58%) Manufacturing
5 63 (9.95%) Organisational Skills
6 46 (7.27%) Marketing
7 45 (7.11%) Inclusion and Diversity
7 45 (7.11%) Influencing Skills
8 40 (6.32%) Retail
9 30 (4.74%) Legal
10 29 (4.58%) Automotive
11 23 (3.63%) Telecoms
12 22 (3.48%) Presentation Skills
13 21 (3.32%) Public Sector
14 16 (2.53%) Games
15 15 (2.37%) Environmental Health
16 14 (2.21%) Documentation Skills
17 10 (1.58%) Local Government
18 9 (1.42%) Electronics
18 9 (1.42%) Law
Job Titles
1 224 (35.39%) Project Manager
2 60 (9.48%) Lead
2 60 (9.48%) Senior
3 42 (6.64%) IT Manager
4 35 (5.53%) Consultant
5 34 (5.37%) Senior Manager
6 24 (3.79%) Delivery Manager
7 23 (3.63%) Coordinator
8 22 (3.48%) Developer
9 21 (3.32%) Analyst
9 21 (3.32%) Infrastructure Manager
10 20 (3.16%) Senior Project Manager
10 20 (3.16%) Technical Manager
11 19 (3.00%) IT Project Manager
12 18 (2.84%) Head of IT
13 15 (2.37%) Applications Manager
13 15 (2.37%) Business Manager
13 15 (2.37%) Software Manager
13 15 (2.37%) Technical Project Manager
14 13 (2.05%) Systems Engineer
Libraries, Frameworks & Software Standards
1 13 (2.05%) .NET
2 11 (1.74%) HTML
2 11 (1.74%) RESTful
3 10 (1.58%) CSS
4 9 (1.42%) SOAP
5 8 (1.26%) ARM Templates
5 8 (1.26%) Azure Blueprints
5 8 (1.26%) JSON
6 6 (0.95%) Laravel
7 5 (0.79%) Node.js
7 5 (0.79%) Web Services
7 5 (0.79%) XML
8 4 (0.63%) Spring
8 4 (0.63%) Spring Boot
9 3 (0.47%) Jest
10 2 (0.32%) ASP.NET Web Forms
10 2 (0.32%) Next.js
10 2 (0.32%) React
10 2 (0.32%) Sass
10 2 (0.32%) Twig
Miscellaneous
1 77 (12.16%) Management Information System
2 29 (4.58%) PMI
2 29 (4.58%) Product Ownership
3 26 (4.11%) Onboarding
4 23 (3.63%) Self-Motivation
5 17 (2.69%) Enterprise Software
5 17 (2.69%) NHS
6 15 (2.37%) Driving Licence
7 13 (2.05%) Data Centre
8 12 (1.90%) Virtual Team
9 10 (1.58%) Analytical Mindset
10 9 (1.42%) Algorithms
10 9 (1.42%) Photography
10 9 (1.42%) SCADA
11 8 (1.26%) Data Structures
12 7 (1.11%) CCTV
13 6 (0.95%) Augmented Reality
13 6 (0.95%) Industrial Internet of Things
13 6 (0.95%) Industry 4.0
13 6 (0.95%) IoT
Operating Systems
1 32 (5.06%) Windows
2 13 (2.05%) Windows 10
3 9 (1.42%) Windows Server
4 5 (0.79%) Android
4 5 (0.79%) Linux
5 4 (0.63%) VMS
6 3 (0.47%) Apple iOS
7 1 (0.16%) CentOS
7 1 (0.16%) Debian
7 1 (0.16%) Mac OS
7 1 (0.16%) Red Hat Enterprise Linux
7 1 (0.16%) Scientific Linux
7 1 (0.16%) Ubuntu
7 1 (0.16%) Windows Server 2019
Processes & Methodologies
1 167 (26.38%) Agile
2 133 (21.01%) Problem-Solving
3 122 (19.27%) Project Delivery
4 109 (17.22%) PRINCE2
5 107 (16.90%) Continuous Improvement
6 87 (13.74%) Risk Management
7 85 (13.43%) Mentoring
8 84 (13.27%) Change Management
9 81 (12.80%) Stakeholder Management
10 64 (10.11%) Customer Service
11 60 (9.48%) Cybersecurity
12 53 (8.37%) Decision-Making
13 50 (7.90%) Waterfall
14 47 (7.42%) Coaching
15 46 (7.27%) Analytics
15 46 (7.27%) ERP
16 45 (7.11%) Business Intelligence
17 43 (6.79%) Roadmaps
18 42 (6.64%) DevOps
18 42 (6.64%) Software Engineering
Programming Languages
1 29 (4.58%) SQL
2 27 (4.27%) JavaScript
3 13 (2.05%) PHP
4 7 (1.11%) C
5 5 (0.79%) C#
5 5 (0.79%) Java
5 5 (0.79%) MATLAB
6 4 (0.63%) TypeScript
7 3 (0.47%) PowerShell
7 3 (0.47%) Python
7 3 (0.47%) VB
8 1 (0.16%) ABAP
8 1 (0.16%) Apex Code
8 1 (0.16%) Embedded C
8 1 (0.16%) SAPscript
8 1 (0.16%) SOQL
8 1 (0.16%) Tcl
8 1 (0.16%) VBScript
Qualifications
1 172 (27.17%) Degree
2 62 (9.79%) Security Cleared
3 54 (8.53%) PMI Certification
4 40 (6.32%) PMP
5 27 (4.27%) PRINCE2 Certification
6 24 (3.79%) SC Cleared
7 19 (3.00%) APMP
8 15 (2.37%) PRINCE2 Practitioner
9 12 (1.90%) HND
10 10 (1.58%) CAPM
10 10 (1.58%) Master's Degree
11 9 (1.42%) APMG
11 9 (1.42%) Computer Science Degree
12 8 (1.26%) BPSS Clearance
13 6 (0.95%) MBA
14 5 (0.79%) CISA
14 5 (0.79%) CISSP
14 5 (0.79%) CRISC
14 5 (0.79%) Microsoft Certification
14 5 (0.79%) PgMP
Quality Assurance & Compliance
1 48 (7.58%) PMO
2 29 (4.58%) GDPR
3 28 (4.42%) QA
4 21 (3.32%) ISO/IEC 27001
5 8 (1.26%) Accessibility
5 8 (1.26%) NCSC
6 4 (0.63%) Data Quality
6 4 (0.63%) HMG Security Policy Framework
6 4 (0.63%) ISO 26262
6 4 (0.63%) SLA
7 3 (0.47%) GMP
7 3 (0.47%) Sarbanes-Oxley
8 2 (0.32%) Automotive SPICE
8 2 (0.32%) ISO 22301
8 2 (0.32%) MISRA
8 2 (0.32%) NIST
8 2 (0.32%) PCI DSS
8 2 (0.32%) SOX 404
9 1 (0.16%) AUTOSAR
9 1 (0.16%) California Consumer Privacy Act
System Software
1 8 (1.26%) Active Directory
1 8 (1.26%) Docker
1 8 (1.26%) VMware Infrastructure
2 6 (0.95%) Hyper-V
3 4 (0.63%) pfSense
4 2 (0.32%) Virtual Desktop
Systems Management
1 12 (1.90%) Terraform
2 8 (1.26%) Ansible
2 8 (1.26%) Kubernetes
3 5 (0.79%) Microsoft Intune
4 2 (0.32%) Functional Safety
Vendors
1 99 (15.64%) Microsoft
2 21 (3.32%) IFS
3 19 (3.00%) SAP
4 16 (2.53%) Workday
5 14 (2.21%) Google
5 14 (2.21%) Salesforce
6 12 (1.90%) Adobe
6 12 (1.90%) ServiceNow
7 10 (1.58%) CheckPoint
8 9 (1.42%) Xero
9 8 (1.26%) VMware
10 7 (1.11%) Cisco
10 7 (1.11%) Siemens
11 6 (0.95%) Dell
12 5 (0.79%) Fortinet
13 4 (0.63%) BroadSoft
13 4 (0.63%) Brocade
13 4 (0.63%) Dell Compellent
13 4 (0.63%) Veeam
13 4 (0.63%) Zerto