Roadmaps Jobs in the West Midlands

Roadmaps
England > West Midlands

The following table provides summary statistics for permanent job vacancies advertised in the West Midlands with a requirement for Roadmaps skills. Included is a benchmarking guide to the salaries offered in vacancies that have cited Roadmaps over the 6 months to 2 December 2023 with a comparison to the same period in the previous 2 years.

6 months to
2 Dec 2023
Same period 2022 Same period 2021
Rank 41 25 42
Rank change year-on-year -16 +17 -8
Permanent jobs citing Roadmaps 192 730 425
As % of all permanent jobs advertised in the West Midlands 5.88% 8.85% 5.85%
As % of the Processes & Methodologies category 6.35% 9.14% 6.17%
Number of salaries quoted 120 351 367
10th Percentile £45,600 £44,500 £42,300
25th Percentile £56,250 £47,500 £50,979
Median annual salary (50th Percentile) £68,750 £60,000 £62,500
Median % change year-on-year +14.58% -4.00% +8.70%
75th Percentile £84,063 £76,875 £77,500
90th Percentile £89,725 £87,500 £93,500
England median annual salary £75,000 £72,500 £70,000
% change year-on-year +3.45% +3.57% +7.69%

All Process and Methodology Skills
West Midlands

Roadmaps is in the Processes and Methodologies category. The following table is for comparison with the above and provides summary statistics for all permanent job vacancies advertised in the West Midlands with a requirement for process or methodology skills.

Permanent vacancies with a requirement for process or methodology skills 3,026 7,984 6,883
As % of all permanent jobs advertised in the West Midlands 92.62% 96.85% 94.81%
Number of salaries quoted 2,432 4,391 5,185
10th Percentile £26,500 £31,250 £30,475
25th Percentile £36,250 £40,625 £37,500
Median annual salary (50th Percentile) £50,000 £52,170 £50,000
Median % change year-on-year -4.16% +4.34% +5.26%
75th Percentile £63,750 £67,125 £66,250
90th Percentile £77,500 £81,250 £82,500
England median annual salary £60,000 £62,500 £60,000
% change year-on-year -4.00% +4.17% +9.09%

Roadmaps
Job Vacancy Trend in the West Midlands

Job postings citing Roadmaps as a proportion of all IT jobs advertised in the West Midlands.
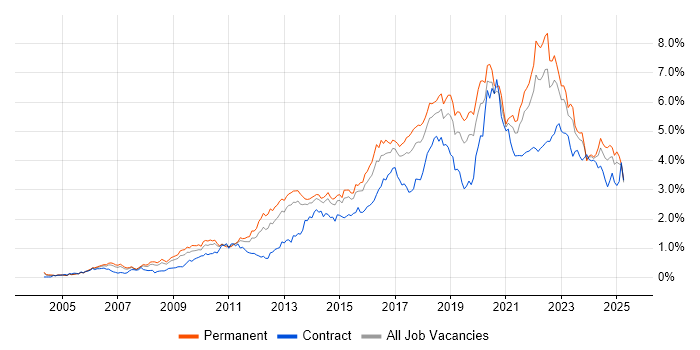
Job vacancy trend for Roadmaps in the West Midlands

Roadmaps
Salary Trend in the West Midlands

3-month moving average salary quoted in jobs citing Roadmaps in the West Midlands.

Salary trend for Roadmaps in the West Midlands

Roadmaps
Salary Histogram in the West Midlands

Salary distribution for jobs citing Roadmaps in the West Midlands over the 6 months to 2 December 2023.

Salary histogram for Roadmaps in the West Midlands

Roadmaps
Job Locations in the West Midlands

The table below looks at the demand and provides a guide to the median salaries quoted in IT jobs citing Roadmaps within the West Midlands region over the 6 months to 2 December 2023. The 'Rank Change' column provides an indication of the change in demand within each location based on the same 6 month period last year.

Location Rank Change
on Same Period
Last Year
Matching
Permanent
IT Job Ads
Median Salary
Past 6 Months
Median Salary
% Change
on Same Period
Last Year
Live
Jobs
Birmingham -9 83 £62,500 - 37
Warwickshire -7 29 £60,000 -8.33% 30
Coventry +3 22 £77,500 +12.73% 30
Staffordshire -19 15 £60,500 +10.00% 13
Wolverhampton +16 6 £86,000 +72.00% 1
Worcestershire +9 4 £60,000 +33.33% 4
Walsall +14 2 £96,250 +250.00%
Solihull +6 2 £57,500 +4.55% 6
Herefordshire -4 2 £47,500 +5.56%
Halesowen - 2 £57,500 -
Shropshire +14 1 - -
Roadmaps
England

Roadmaps
Co-occurring Skills and Capabilities in the West Midlands by Category

The follow tables expand on the table above by listing co-occurrences grouped by category. The same employment type, locality and period is covered with up to 20 co-occurrences shown in each of the following categories:

Application Platforms
1 8 (4.17%) Confluence
2 6 (3.13%) SharePoint
3 3 (1.56%) CMS
4 1 (0.52%) WordPress
Applications
1 9 (4.69%) Simulink
2 5 (2.60%) Microsoft Excel
3 4 (2.08%) Microsoft PowerPoint
4 2 (1.04%) Microsoft Office
5 1 (0.52%) CANalyzer
5 1 (0.52%) Chatbot
5 1 (0.52%) Microsoft Project
Business Applications
1 4 (2.08%) SAP MM
1 4 (2.08%) SAP S/4HANA
2 2 (1.04%) Dynamics CRM
2 2 (1.04%) SAP MDM
2 2 (1.04%) SAP WM
2 2 (1.04%) Scribe Insight
2 2 (1.04%) Unit4 Business World
3 1 (0.52%) Remedy ITSM
Cloud Services
1 65 (33.85%) Azure
2 31 (16.15%) Power Automate
3 30 (15.63%) ChatGPT
4 21 (10.94%) AWS
5 16 (8.33%) Power Platform
6 13 (6.77%) GCP
6 13 (6.77%) Microsoft 365
7 9 (4.69%) SaaS
8 8 (4.17%) Entra ID
9 6 (3.13%) Amazon S3
10 4 (2.08%) PaaS
11 3 (1.56%) Azure DevOps
11 3 (1.56%) Dynamics 365
12 2 (1.04%) Azure Data Factory
12 2 (1.04%) Azure Functions
12 2 (1.04%) Azure Logic Apps
12 2 (1.04%) GitHub
12 2 (1.04%) IaaS
12 2 (1.04%) Scribe Online
12 2 (1.04%) Serverless
Communications & Networking
1 9 (4.69%) Network Security
2 7 (3.65%) SAN
3 5 (2.60%) DNS
4 4 (2.08%) WAN
5 3 (1.56%) DHCP
5 3 (1.56%) MPLS
5 3 (1.56%) SD-WAN
5 3 (1.56%) WAAS
6 2 (1.04%) Ethernet VPN
6 2 (1.04%) VXLAN
7 1 (0.52%) BGP
7 1 (0.52%) Ethernet
7 1 (0.52%) Firewall
7 1 (0.52%) HSRP
7 1 (0.52%) Multicast
7 1 (0.52%) OSPF
7 1 (0.52%) Spanning Tree
7 1 (0.52%) TCP/IP
7 1 (0.52%) VLAN
7 1 (0.52%) Wi-Fi
Database & Business Intelligence
1 15 (7.81%) Power BI
2 6 (3.13%) Amazon Athena
2 6 (3.13%) Amazon QuickSight
2 6 (3.13%) Amazon RDS
2 6 (3.13%) Amazon Redshift
2 6 (3.13%) BusinessObjects
2 6 (3.13%) DynamoDB
3 5 (2.60%) Relational Database
4 4 (2.08%) MySQL
4 4 (2.08%) Tableau
5 3 (1.56%) Data Warehouse
5 3 (1.56%) SQL Server
5 3 (1.56%) SQL Server Integration Services
6 2 (1.04%) Crystal Reports
6 2 (1.04%) Data Lake
6 2 (1.04%) NoSQL
7 1 (0.52%) Looker
7 1 (0.52%) Metadata
7 1 (0.52%) Oracle Reports
7 1 (0.52%) QlikView
Development Applications
1 12 (6.25%) JIRA
2 2 (1.04%) Visual Studio
3 1 (0.52%) Apache Continuum
3 1 (0.52%) CANoe
3 1 (0.52%) ERwin
3 1 (0.52%) Git
3 1 (0.52%) TestRail
General
1 55 (28.65%) Social Skills
2 32 (16.67%) Finance
3 23 (11.98%) Analytical Skills
4 15 (7.81%) Automotive
5 12 (6.25%) Manufacturing
6 8 (4.17%) Local Government
7 6 (3.13%) Retail
8 5 (2.60%) Influencing Skills
8 5 (2.60%) Law
8 5 (2.60%) Presentation Skills
9 4 (2.08%) Marketing
10 3 (1.56%) Inclusion and Diversity
10 3 (1.56%) Public Sector
11 2 (1.04%) Electronics
11 2 (1.04%) Organisational Skills
12 1 (0.52%) Back Office
12 1 (0.52%) Banking
12 1 (0.52%) Games
12 1 (0.52%) Legal
12 1 (0.52%) Telecoms
Job Titles
1 46 (23.96%) Architect
2 25 (13.02%) Lead
3 18 (9.38%) Enterprise Architect
4 16 (8.33%) Solutions Architect
5 11 (5.73%) Senior
6 10 (5.21%) Analyst
6 10 (5.21%) Product Manager
7 9 (4.69%) Chief Technology Officer
7 9 (4.69%) Technical Leader
8 8 (4.17%) Developer
8 8 (4.17%) Product Owner
9 7 (3.65%) Consultant
9 7 (3.65%) IT Manager
10 6 (3.13%) Data Architect
11 5 (2.60%) Transformation Manager
12 4 (2.08%) Business Analyst
12 4 (2.08%) Designer
12 4 (2.08%) Lead Architect
12 4 (2.08%) Project Manager
12 4 (2.08%) Technical Architect
Libraries, Frameworks & Software Standards
1 7 (3.65%) .NET
2 4 (2.08%) HTML
2 4 (2.08%) RESTful
3 2 (1.04%) AngularJS
3 2 (1.04%) CSS
3 2 (1.04%) HTML5
3 2 (1.04%) React
3 2 (1.04%) React Native
3 2 (1.04%) Spring
3 2 (1.04%) Spring Boot
3 2 (1.04%) Web Services
4 1 (0.52%) EDI
4 1 (0.52%) jQuery
4 1 (0.52%) JSON
4 1 (0.52%) LAMP
4 1 (0.52%) REST
4 1 (0.52%) SOAP
4 1 (0.52%) Symfony
4 1 (0.52%) Velocity
4 1 (0.52%) XML
Miscellaneous
1 18 (9.38%) Product Ownership
2 12 (6.25%) Management Information System
3 9 (4.69%) Educational Technology
3 9 (4.69%) EPoS
4 8 (4.17%) Public Cloud
4 8 (4.17%) Renewable Energy
5 7 (3.65%) Enterprise Software
6 5 (2.60%) Client/Server
7 4 (2.08%) Data Centre
7 4 (2.08%) Mobile App
7 4 (2.08%) Private Cloud
7 4 (2.08%) Self-Motivation
7 4 (2.08%) Virtual Team
8 3 (1.56%) CMDB
8 3 (1.56%) Onboarding
9 2 (1.04%) Cyber Security Posture
9 2 (1.04%) Legacy Systems
9 2 (1.04%) Security Posture
10 1 (0.52%) Greenfield Project
10 1 (0.52%) PropTech
Operating Systems
1 11 (5.73%) Windows
2 3 (1.56%) Windows Server
3 2 (1.04%) Android
3 2 (1.04%) Linux
4 1 (0.52%) Apple iOS
4 1 (0.52%) Unix
4 1 (0.52%) Windows 10
4 1 (0.52%) Windows Server 2016
Processes & Methodologies
1 66 (34.38%) Agile
2 42 (21.88%) Technical Architecture
3 37 (19.27%) Business Analysis
3 37 (19.27%) Product Backlog
4 36 (18.75%) Backlog Prioritisation
5 32 (16.67%) Enterprise Architecture
5 32 (16.67%) Technology Roadmap
6 31 (16.15%) Artificial Intelligence
7 29 (15.10%) Product Roadmap
8 22 (11.46%) Business Strategy
9 21 (10.94%) Problem-Solving
10 20 (10.42%) ITIL
11 19 (9.90%) Architecture Roadmap
11 19 (9.90%) DevOps
12 17 (8.85%) Data Integration
12 17 (8.85%) IT Strategy
13 16 (8.33%) Project Management
14 15 (7.81%) Architectural Design
14 15 (7.81%) Continuous Improvement
14 15 (7.81%) Scrum
Programming Languages
1 40 (20.83%) SQL
2 15 (7.81%) Python
3 11 (5.73%) PowerShell
4 7 (3.65%) JavaScript
4 7 (3.65%) MATLAB
5 6 (3.13%) C#
6 5 (2.60%) Java
7 2 (1.04%) Bash
7 2 (1.04%) C
8 1 (0.52%) C++
8 1 (0.52%) Embedded C
8 1 (0.52%) Perl
8 1 (0.52%) PHP
8 1 (0.52%) PL/SQL
Qualifications
1 23 (11.98%) Degree
2 7 (3.65%) SC Cleared
2 7 (3.65%) Security Cleared
3 5 (2.60%) CSPO
3 5 (2.60%) MCSE
3 5 (2.60%) Microsoft Certification
3 5 (2.60%) SAFe Agilist
3 5 (2.60%) TOGAF Certification
4 4 (2.08%) CISM
4 4 (2.08%) CISSP
4 4 (2.08%) Computer Science Degree
5 2 (1.04%) Azure Certification
5 2 (1.04%) CCIE
5 2 (1.04%) CISA
5 2 (1.04%) Cisco Certification
5 2 (1.04%) CRISC
5 2 (1.04%) JNCIE
5 2 (1.04%) Master's Degree
5 2 (1.04%) PhD
6 1 (0.52%) ITIL Certification
Quality Assurance & Compliance
1 6 (3.13%) PMO
2 5 (2.60%) ISO/IEC 27001
2 5 (2.60%) NIST
3 4 (2.08%) Cyber Essentials
4 2 (1.04%) Data Quality
4 2 (1.04%) GDPR
4 2 (1.04%) GRC
4 2 (1.04%) QA
5 1 (0.52%) Actionable Recommendations
5 1 (0.52%) Cyber Essentials PLUS
5 1 (0.52%) ISO 26262
5 1 (0.52%) ISO 9000
5 1 (0.52%) NCSC
5 1 (0.52%) NIST 800
5 1 (0.52%) SLA
System Software
1 13 (6.77%) VMware Infrastructure
2 11 (5.73%) Active Directory
3 5 (2.60%) Virtual Desktop
4 3 (1.56%) BitLocker
4 3 (1.56%) VMware ESXi
5 2 (1.04%) Docker
5 2 (1.04%) vSphere
6 1 (0.52%) Firmware
6 1 (0.52%) Virtual Servers
Systems Management
1 7 (3.65%) Nessus
2 6 (3.13%) Kubernetes
3 5 (2.60%) Microsoft Intune
3 5 (2.60%) SCCM
4 3 (1.56%) vCenter Server
5 2 (1.04%) Terraform
6 1 (0.52%) ZABBIX
Vendors
1 72 (37.50%) Microsoft
2 18 (9.38%) SAP
3 13 (6.77%) VMware
4 12 (6.25%) ServiceNow
5 8 (4.17%) Remedy
6 7 (3.65%) Darktrace
6 7 (3.65%) Google
6 7 (3.65%) OneTrust
6 7 (3.65%) SolarWinds
7 5 (2.60%) Atlassian
8 4 (2.08%) Cisco
8 4 (2.08%) Citrix
9 3 (1.56%) CheckPoint
9 3 (1.56%) Oracle
10 2 (1.04%) CyberArk
10 2 (1.04%) HP
10 2 (1.04%) IFS
10 2 (1.04%) Informatica
10 2 (1.04%) Juniper
10 2 (1.04%) Veeam