Security Cleared Jobs in the West Midlands

Security Clearance
England > West Midlands

The table below provides summary statistics for permanent job vacancies advertised in the West Midlands with a requirement for Security Cleared qualifications. It includes a benchmarking guide to the salaries offered over the 6 months leading up to 28 May 2025, comparing them to the same period in the previous two years.

6 months to
28 May 2025
Same period 2024 Same period 2023
Rank 44 30 42
Rank change year-on-year -14 +12 +20
Permanent jobs citing Security Cleared 209 458 407
As % of all permanent jobs advertised in the West Midlands 5.09% 5.89% 6.64%
As % of the Qualifications category 8.86% 22.44% 16.23%
Number of salaries quoted 144 339 276
10th Percentile £47,423 £26,700 £31,250
25th Percentile £56,250 £40,000 £41,000
Median annual salary (50th Percentile) £65,000 £55,000 £57,500
Median % change year-on-year +18.18% -4.35% +8.26%
75th Percentile £74,075 £65,000 £68,750
90th Percentile £77,500 £74,200 £77,500
England median annual salary £60,000 £57,500 £60,000
% change year-on-year +4.35% -4.17% +9.09%

All Academic and Professional Certifications
West Midlands

Security Cleared falls under the Academic Qualifications and Professional Certifications category. For comparison with the information above, the following table provides summary statistics for all permanent job vacancies requiring academic qualifications or professional certifications in the West Midlands.

Permanent vacancies requiring academic qualifications or professional certifications 2,360 2,041 2,507
As % of all permanent jobs advertised in the West Midlands 57.42% 26.26% 40.90%
Number of salaries quoted 540 1,297 969
10th Percentile £27,750 £25,750 £28,700
25th Percentile £36,925 £32,500 £37,500
Median annual salary (50th Percentile) £51,500 £50,000 £52,500
Median % change year-on-year +3.00% -4.76% +11.70%
75th Percentile £67,500 £63,750 £65,250
90th Percentile £75,000 £77,500 £77,500
England median annual salary £54,793 £54,500 £60,000
% change year-on-year +0.54% -9.17% +9.09%

Security Cleared
Job Vacancy Trend in the West Midlands

Job postings citing Security Cleared as a proportion of all IT jobs advertised in the West Midlands.
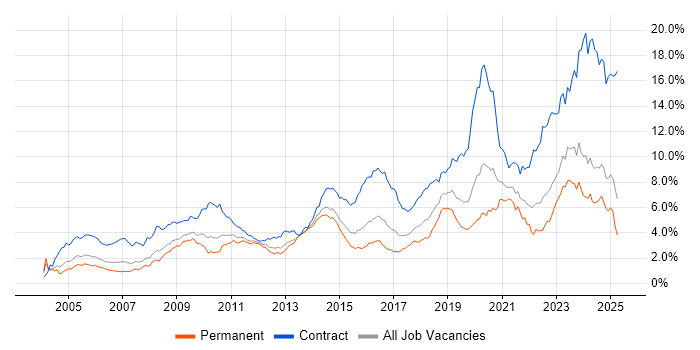
Job vacancy trend for Security Cleared in the West Midlands

Security Cleared
Salary Trend in the West Midlands

3-month moving average salary quoted in jobs citing Security Cleared in the West Midlands.

Salary trend for Security Cleared in the West Midlands

Security Cleared
Salary Histogram in the West Midlands

Salary distribution for jobs citing Security Cleared in the West Midlands over the 6 months to 28 May 2025.

Salary histogram for Security Cleared in the West Midlands

Security Cleared
Job Locations in the West Midlands

The table below looks at the demand and provides a guide to the median salaries quoted in IT jobs citing Security Cleared within the West Midlands region over the 6 months to 28 May 2025. The 'Rank Change' column provides an indication of the change in demand within each location based on the same 6 month period last year.

Location Rank Change
on Same Period
Last Year
Matching
Permanent
IT Job Ads
Median Salary
Past 6 Months
Median Salary
% Change
on Same Period
Last Year
Live
Jobs
Birmingham +11 120 £65,000 +10.54% 167
Warwickshire -32 29 £56,500 +2.73% 14
Solihull +5 25 £60,000 +20.00% 15
Herefordshire +6 9 - - 12
Shropshire +16 7 £70,000 +16.67% 152
Worcestershire +3 5 £65,000 +18.18% 77
Staffordshire -48 3 £44,474 -11.05% 121
Coventry -7 1 £58,250 +40.24% 72
Security Cleared
England

Security Cleared
Co-occurring Skills and Capabilities in the West Midlands by Category

The follow tables expand on the table above by listing co-occurrences grouped by category. The same employment type, locality and period is covered with up to 20 co-occurrences shown in each of the following categories:

Application Platforms
1 19 (9.09%) Confluence
2 7 (3.35%) SharePoint
3 6 (2.87%) Microsoft Exchange
4 2 (0.96%) CMS
4 2 (0.96%) Headless CMS
4 2 (0.96%) Jupyter
4 2 (0.96%) nginx
4 2 (0.96%) Skype for Business
Applications
1 3 (1.44%) Microsoft Excel
1 3 (1.44%) Microsoft Project
1 3 (1.44%) Mozilla Thunderbird
Business Applications
1 4 (1.91%) SAP HR
2 2 (0.96%) Oracle EBS
2 2 (0.96%) Oracle ERP
2 2 (0.96%) PeopleSoft HCM
2 2 (0.96%) SAP S/4HANA
3 1 (0.48%) Oracle Payroll
3 1 (0.48%) SAP CO
3 1 (0.48%) SAP ERP
3 1 (0.48%) SAP FI
3 1 (0.48%) SAP HCM
3 1 (0.48%) SAP Payroll
3 1 (0.48%) SAP PS
Cloud Services
1 47 (22.49%) Azure
2 43 (20.57%) AWS
3 20 (9.57%) Amazon S3
4 19 (9.09%) Amazon EC2
5 18 (8.61%) AWS KMS
6 17 (8.13%) Amazon CloudWatch
7 13 (6.22%) Virtual Private Cloud
8 12 (5.74%) Amazon ELB
9 11 (5.26%) Microsoft 365
10 10 (4.78%) Amazon Glacier
11 9 (4.31%) Azure DevOps
11 9 (4.31%) GCP
11 9 (4.31%) GitHub
11 9 (4.31%) GitHub Actions
11 9 (4.31%) Serverless
12 8 (3.83%) Azure Sentinel
13 7 (3.35%) Entra ID
13 7 (3.35%) IaaS
13 7 (3.35%) Route 53
13 7 (3.35%) SaaS
Communications & Networking
1 52 (24.88%) WAN
2 28 (13.40%) Firewall
3 17 (8.13%) LAN
4 16 (7.66%) MPLS
5 15 (7.18%) BGP
5 15 (7.18%) IPsec
5 15 (7.18%) Network Security
6 14 (6.70%) DNS
7 13 (6.22%) Junos
8 12 (5.74%) Cisco IOS
8 12 (5.74%) VLAN
9 11 (5.26%) SD-WAN
10 10 (4.78%) Cisco ISE
11 8 (3.83%) HTTP
12 7 (3.35%) Frame Relay
12 7 (3.35%) FTP
12 7 (3.35%) SDH
12 7 (3.35%) SMTP
12 7 (3.35%) SSH
12 7 (3.35%) VPN
Database & Business Intelligence
1 20 (9.57%) Amazon RDS
2 15 (7.18%) PostgreSQL
3 9 (4.31%) Amazon Aurora
4 6 (2.87%) DynamoDB
5 5 (2.39%) DB2
5 5 (2.39%) Power BI
6 4 (1.91%) Big Data
6 4 (1.91%) Elasticsearch
6 4 (1.91%) MaxDB
6 4 (1.91%) MongoDB
6 4 (1.91%) NoSQL
6 4 (1.91%) Oracle Reports
6 4 (1.91%) Redis
6 4 (1.91%) SAP HANA
6 4 (1.91%) SQL Server
7 3 (1.44%) Azure SQL Database
7 3 (1.44%) Data Lake
8 2 (0.96%) Oracle Database
9 1 (0.48%) Pentaho
9 1 (0.48%) SQL Server Integration Services
Development Applications
1 25 (11.96%) Git
2 24 (11.48%) Jenkins
3 22 (10.53%) JIRA
4 15 (7.18%) SonarQube
5 12 (5.74%) Vagrant
6 8 (3.83%) Maven
7 6 (2.87%) Bitbucket Server
7 6 (2.87%) JUnit
7 6 (2.87%) Mockito
8 5 (2.39%) DbUnit
8 5 (2.39%) jMock
8 5 (2.39%) Sonatype Nexus
9 2 (0.96%) Selenium
9 2 (0.96%) Storybook
10 1 (0.48%) Atlassian Bamboo
10 1 (0.48%) GDB
10 1 (0.48%) GitLab
10 1 (0.48%) IDA Disassembler
10 1 (0.48%) WinDbg
General
1 59 (28.23%) Social Skills
2 28 (13.40%) Public Sector
3 23 (11.00%) Finance
4 22 (10.53%) Analytical Skills
5 13 (6.22%) Inclusion and Diversity
5 13 (6.22%) Law
6 9 (4.31%) Documentation Skills
7 7 (3.35%) Influencing Skills
7 7 (3.35%) Legal
8 6 (2.87%) Police
9 5 (2.39%) Presentation Skills
10 4 (1.91%) Advertising
11 2 (0.96%) Electronics
11 2 (0.96%) Retail
12 1 (0.48%) Aerospace
12 1 (0.48%) Billing
12 1 (0.48%) General Ledger
12 1 (0.48%) Local Government
12 1 (0.48%) Telecoms
Job Titles
1 59 (28.23%) Architect
2 45 (21.53%) Network Architect
3 21 (10.05%) Consultant
3 21 (10.05%) Senior
4 19 (9.09%) Developer
5 16 (7.66%) DevOps Engineer
5 16 (7.66%) SAP Consultant
6 14 (6.70%) Lead
7 13 (6.22%) Analyst
7 13 (6.22%) Java Developer
7 13 (6.22%) Network Engineer
8 12 (5.74%) Designer
9 11 (5.26%) Network Designer
10 10 (4.78%) Change Analyst
10 10 (4.78%) Infrastructure Engineer
11 7 (3.35%) Security Engineer
11 7 (3.35%) Senior Network Engineer
12 6 (2.87%) Cloud Architect
12 6 (2.87%) Cybersecurity Engineer
12 6 (2.87%) Platform Engineer
Libraries, Frameworks & Software Standards
1 12 (5.74%) JPA
2 9 (4.31%) RESTful
3 8 (3.83%) AngularJS
3 8 (3.83%) Spring
3 8 (3.83%) Spring Boot
4 7 (3.35%) ActiveMQ
4 7 (3.35%) SOAP
5 6 (2.87%) ARM Templates
5 6 (2.87%) Azure Blueprints
5 6 (2.87%) Bootstrap
5 6 (2.87%) Middleware
5 6 (2.87%) REST
5 6 (2.87%) Web Services
6 5 (2.39%) GraphQL
6 5 (2.39%) GWT
6 5 (2.39%) Hibernate
6 5 (2.39%) PowerMock
6 5 (2.39%) Spring Batch
6 5 (2.39%) Spring Integration
6 5 (2.39%) Vaadin
Miscellaneous
1 18 (8.61%) Onboarding
2 10 (4.78%) Management Information System
3 9 (4.31%) Replication
4 7 (3.35%) Mobile App
4 7 (3.35%) Self-Motivation
5 6 (2.87%) Cyberattack
6 4 (1.91%) Algorithms
6 4 (1.91%) Distributed Systems
6 4 (1.91%) Driving Licence
7 3 (1.44%) Cloud Native
7 3 (1.44%) Distributed Architecture
7 3 (1.44%) Operational Technology
7 3 (1.44%) SCADA
8 2 (0.96%) Enterprise Software
8 2 (0.96%) Hybrid Cloud
8 2 (0.96%) Linux Command Line
9 1 (0.48%) Cyber Threat
9 1 (0.48%) Data Centre
9 1 (0.48%) Greenfield Project
9 1 (0.48%) Public Cloud
Operating Systems
1 36 (17.22%) Linux
2 26 (12.44%) Windows
3 12 (5.74%) VMS
4 8 (3.83%) Amazon Linux
5 5 (2.39%) Rocky
5 5 (2.39%) Ubuntu
5 5 (2.39%) Unix
5 5 (2.39%) Windows Server
6 4 (1.91%) AIX
6 4 (1.91%) Red Hat Enterprise Linux
7 2 (0.96%) Windows Server 2003
7 2 (0.96%) Windows Server 2019
8 1 (0.48%) Android
8 1 (0.48%) CentOS
8 1 (0.48%) Debian
8 1 (0.48%) Oracle Linux
8 1 (0.48%) Windows 10
Processes & Methodologies
1 41 (19.62%) Project Management
2 36 (17.22%) DevOps
3 35 (16.75%) Problem-Solving
4 33 (15.79%) Change Management
4 33 (15.79%) Network Management
4 33 (15.79%) Project Delivery
5 31 (14.83%) Collaborative Working
6 30 (14.35%) Data Privacy
7 28 (13.40%) Cybersecurity
8 26 (12.44%) Mentoring
9 25 (11.96%) Agile
10 20 (9.57%) Network Design
11 19 (9.09%) ITIL
12 18 (8.61%) Technical Leadership
13 17 (8.13%) Containerisation
14 16 (7.66%) Software Engineering
15 15 (7.18%) Configuration Management
16 13 (6.22%) Analytics
16 13 (6.22%) Cloud Security
17 12 (5.74%) Line Management
Programming Languages
1 33 (15.79%) Python
2 28 (13.40%) Java
3 27 (12.92%) SQL
4 25 (11.96%) PowerShell
5 12 (5.74%) Groovy
6 9 (4.31%) Perl
7 7 (3.35%) JavaScript
8 5 (2.39%) ABAP
9 4 (1.91%) Bash
10 3 (1.44%) C++
11 2 (0.96%) C
11 2 (0.96%) C#
11 2 (0.96%) Shell Script
11 2 (0.96%) TypeScript
12 1 (0.48%) CodeQL
12 1 (0.48%) Go
12 1 (0.48%) PHP
12 1 (0.48%) R
12 1 (0.48%) Rust
12 1 (0.48%) VB
Qualifications
1 130 (62.20%) SC Cleared
2 28 (13.40%) Degree
3 22 (10.53%) DV Cleared
4 19 (9.09%) CCNA
4 19 (9.09%) Cisco Certification
5 16 (7.66%) CCNP
6 14 (6.70%) JNCIS
7 13 (6.22%) BPSS Clearance
8 8 (3.83%) AWS Certification
8 8 (3.83%) CISM
9 7 (3.35%) CISA
9 7 (3.35%) CISSP
9 7 (3.35%) GIAC
9 7 (3.35%) ISACA
9 7 (3.35%) SANS
10 6 (2.87%) Azure Certification
11 4 (1.91%) Microsoft Certification
12 2 (0.96%) ISTQB
12 2 (0.96%) Network+ Certification
12 2 (0.96%) Numerate Degree
Quality Assurance & Compliance
1 15 (7.18%) NCSC
2 13 (6.22%) SLA
3 8 (3.83%) GRC
3 8 (3.83%) QA
4 7 (3.35%) ISO/IEC 27001
5 6 (2.87%) JSP 440
6 5 (2.39%) PMO
7 4 (1.91%) NIST
8 2 (0.96%) Cyber Essentials
9 1 (0.48%) COBIT
9 1 (0.48%) GDPR
9 1 (0.48%) ISO 9000
9 1 (0.48%) ISO/IEC 20000
9 1 (0.48%) PMBOK
System Software
1 36 (17.22%) Docker
2 24 (11.48%) Active Directory
3 9 (4.31%) DFS Replication
4 6 (2.87%) VMware Infrastructure
5 4 (1.91%) Postfix
5 4 (1.91%) Virtual Machines
6 3 (1.44%) Hyper-V
7 2 (0.96%) Dovecot
7 2 (0.96%) Squid
8 1 (0.48%) Virtual Desktop
8 1 (0.48%) Xen
Systems Management
1 28 (13.40%) Terraform
2 18 (8.61%) Grafana
2 18 (8.61%) Prometheus
3 16 (7.66%) Ansible
3 16 (7.66%) Kubernetes
4 7 (3.35%) Nessus
5 4 (1.91%) SCOM
6 3 (1.44%) Proxmox
6 3 (1.44%) Puppet
6 3 (1.44%) SCCM
7 2 (0.96%) FortiGate
7 2 (0.96%) Progress Chef
7 2 (0.96%) SCOrch
7 2 (0.96%) SCSM
8 1 (0.48%) Argo
8 1 (0.48%) AWS Copilot
8 1 (0.48%) Kibana
8 1 (0.48%) Microsoft Intune
8 1 (0.48%) Single Sign-On
8 1 (0.48%) WSUS
Vendors
1 66 (31.58%) Cisco
2 55 (26.32%) Juniper
3 30 (14.35%) SAP
4 22 (10.53%) ServiceNow
5 18 (8.61%) Microsoft
6 16 (7.66%) VMware
7 10 (4.78%) SevOne
8 9 (4.31%) Google
9 8 (3.83%) Oracle
9 8 (3.83%) Red Hat
9 8 (3.83%) SolarWinds
10 5 (2.39%) Atlassian
11 4 (1.91%) Dell
11 4 (1.91%) Jaspersoft
11 4 (1.91%) Splunk
11 4 (1.91%) Tenable
12 3 (1.44%) Databricks
13 2 (0.96%) Avaya
13 2 (0.96%) JD Edwards
13 2 (0.96%) PeopleSoft