Microsoft PowerPoint Contracts in the City of London

Microsoft PowerPoint
Central London > City of London

The table below provides summary statistics for contract job vacancies advertised in the City of London requiring Microsoft PowerPoint skills. It includes a benchmarking guide to the contractor rates offered in vacancies that cited Microsoft PowerPoint over the 6 months leading up to 17 August 2025, comparing them to the same period in the previous two years.

6 months to
17 Aug 2025
Same period 2024 Same period 2023
Rank 89 94 105
Rank change year-on-year +5 +11 +36
Contract jobs citing Microsoft PowerPoint 40 30 60
As % of all contract jobs advertised in the City of London 2.14% 1.46% 1.86%
As % of the Applications category 19.70% 22.90% 22.14%
Number of daily rates quoted 22 22 41
10th Percentile £220 £222 £225
25th Percentile £326 £319 £325
Median daily rate (50th Percentile) £473 £469 £550
Median % change year-on-year +0.80% -14.77% -8.33%
75th Percentile £611 £550 £675
90th Percentile £619 £573 £800
Central London median daily rate £450 £413 £550
% change year-on-year +9.09% -25.00% -5.17%

All Software Application Skills
City of London

Microsoft PowerPoint falls under the Software Applications category. For comparison with the information above, the following table provides summary statistics for all contract job vacancies requiring software application skills in the City of London.

Contract vacancies with a requirement for software application skills 203 131 271
As % of all contract IT jobs advertised in the City of London 10.85% 6.36% 8.42%
Number of daily rates quoted 132 82 199
10th Percentile £263 £195 £185
25th Percentile £328 £275 £300
Median daily rate (50th Percentile) £444 £500 £475
Median % change year-on-year -11.25% +5.26% -5.09%
75th Percentile £619 £613 £600
90th Percentile £738 £700 £700
Central London median daily rate £435 £481 £475
% change year-on-year -9.47% +1.16% -
Number of hourly rates quoted 7 2 5
10th Percentile £15.10 - £13.02
25th Percentile £21.13 - £14.18
Median hourly rate £28.15 £27.00 £16.50
Median % change year-on-year +4.26% +63.64% -36.54%
75th Percentile £35.34 - £17.89
90th Percentile £44.30 - £29.96
Central London median hourly rate £28.61 £27.00 £16.50
% change year-on-year +5.96% +63.64% -36.54%

Microsoft PowerPoint
Job Vacancy Trend in the City of London

Job postings citing Microsoft PowerPoint as a proportion of all IT jobs advertised in the City of London.
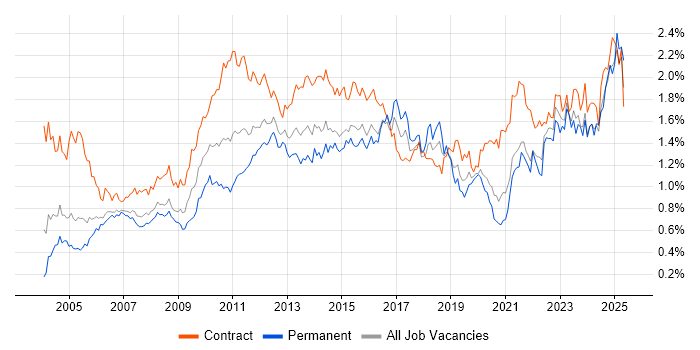
Job vacancy trend for Microsoft PowerPoint in the City of London

Microsoft PowerPoint
Contractor Daily Rate Trend in the City of London

3-month moving average daily rate quoted in jobs citing Microsoft PowerPoint in the City of London.

Daily rate trend for Microsoft PowerPoint in the City of London

Microsoft PowerPoint
Daily Rate Histogram in the City of London

Daily rate distribution for jobs citing Microsoft PowerPoint in the City of London over the 6 months to 17 August 2025.

Daily rate histogram for Microsoft PowerPoint in the City of London

Microsoft PowerPoint
Contractor Hourly Rate Trend in the City of London

3-month moving average hourly rates quoted in jobs citing Microsoft PowerPoint in the City of London.

Hourly rate trend for Microsoft PowerPoint in the City of London

Microsoft PowerPoint
Co-occurring Skills and Capabilities in the City of London by Category

The follow tables expand on the table above by listing co-occurrences grouped by category. The same employment type, locality and period is covered with up to 20 co-occurrences shown in each of the following categories:

Application Platforms
1 6 (15.00%) SharePoint
2 3 (7.50%) Confluence
3 2 (5.00%) Skype for Business
4 1 (2.50%) Apache Spark
4 1 (2.50%) CMS
4 1 (2.50%) Microsoft Exchange
Applications
1 31 (77.50%) Microsoft Excel
2 17 (42.50%) Microsoft Office
3 10 (25.00%) Microsoft Project
4 5 (12.50%) MS Visio
5 1 (2.50%) Trello
Business Applications
1 1 (2.50%) Orchestrade
Cloud Services
1 11 (27.50%) Power Platform
2 4 (10.00%) Snowflake
3 3 (7.50%) Azure
4 2 (5.00%) Dynamics 365
4 2 (5.00%) Microsoft 365
5 1 (2.50%) AWS
5 1 (2.50%) Azure DevOps
5 1 (2.50%) Collibra
5 1 (2.50%) GCP
5 1 (2.50%) Google Docs
5 1 (2.50%) Power Automate
5 1 (2.50%) PowerApps
Communications & Networking
1 2 (5.00%) Skype
1 2 (5.00%) WebEx
Database & Business Intelligence
1 11 (27.50%) Power BI
2 2 (5.00%) Tableau
3 1 (2.50%) BigQuery
3 1 (2.50%) Data Warehouse
3 1 (2.50%) Hadoop
3 1 (2.50%) Looker
3 1 (2.50%) Metadata
3 1 (2.50%) MS Access
Development Applications
1 7 (17.50%) JIRA
General
1 28 (70.00%) Finance
2 19 (47.50%) Social Skills
3 14 (35.00%) Analytical Skills
4 7 (17.50%) Banking
5 6 (15.00%) Presentation Skills
6 5 (12.50%) Organisational Skills
7 4 (10.00%) Legal
8 3 (7.50%) Back Office
8 3 (7.50%) Financial Institution
8 3 (7.50%) Law
9 2 (5.00%) Public Sector
10 1 (2.50%) Billing
10 1 (2.50%) Front Office
10 1 (2.50%) Influencing Skills
Job Titles
1 9 (22.50%) Analyst
2 6 (15.00%) Lead
2 6 (15.00%) Project Manager
3 3 (7.50%) Programme Manager
4 2 (5.00%) Audio Visual Engineer
4 2 (5.00%) Audio Visual Support
4 2 (5.00%) Business Analyst
4 2 (5.00%) Change Manager
4 2 (5.00%) Data Analyst
4 2 (5.00%) Support Assistant
4 2 (5.00%) Support Engineer
4 2 (5.00%) Support Specialist
4 2 (5.00%) Tester
5 1 (2.50%) Automation Engineer
5 1 (2.50%) FX Business Analyst
5 1 (2.50%) IT Analyst
5 1 (2.50%) Junior PMO
5 1 (2.50%) Project Change Manager
5 1 (2.50%) Transformation Analyst
5 1 (2.50%) Transformation Consultant
Libraries, Frameworks & Software Standards
1 2 (5.00%) ADO
Miscellaneous
1 3 (7.50%) PMI
1 3 (7.50%) Product Ownership
1 3 (7.50%) Reference Data
2 2 (5.00%) CMDB
2 2 (5.00%) Self-Motivation
2 2 (5.00%) Video Conferencing
3 1 (2.50%) Analytical Mindset
3 1 (2.50%) Foreign Exchange (FX)
3 1 (2.50%) Mobile App
3 1 (2.50%) Onboarding
3 1 (2.50%) Virtual Team
Operating Systems
1 3 (7.50%) Windows
2 1 (2.50%) Windows 10
Processes & Methodologies
1 17 (42.50%) Problem-Solving
2 15 (37.50%) Agile
3 11 (27.50%) Business Intelligence
3 11 (27.50%) Project Management
4 9 (22.50%) Stakeholder Management
5 7 (17.50%) Stakeholder Engagement
6 5 (12.50%) Budgeting
6 5 (12.50%) Continuous Improvement
6 5 (12.50%) Data Analysis
6 5 (12.50%) Data Management
6 5 (12.50%) Process Improvement
6 5 (12.50%) Project Delivery
6 5 (12.50%) Resource Allocation
6 5 (12.50%) Visualisation
7 4 (10.00%) Actionable Insight
7 4 (10.00%) Analytics
7 4 (10.00%) Artificial Intelligence
7 4 (10.00%) Storytelling
7 4 (10.00%) Systems Thinking
7 4 (10.00%) User Acceptance Testing
Programming Languages
1 2 (5.00%) Python
2 1 (2.50%) Korn
2 1 (2.50%) PowerShell
2 1 (2.50%) R
2 1 (2.50%) SQL
2 1 (2.50%) VBA
Qualifications
1 11 (27.50%) Degree
2 5 (12.50%) PMI Certification
3 2 (5.00%) CISA
3 2 (5.00%) PMP
3 2 (5.00%) Security Cleared
4 1 (2.50%) ACCA
4 1 (2.50%) CFA
4 1 (2.50%) Computer Science Degree
4 1 (2.50%) ITIL Certification
4 1 (2.50%) Master's Degree
4 1 (2.50%) SC Cleared
Quality Assurance & Compliance
1 12 (30.00%) PMO
2 3 (7.50%) Data Quality
2 3 (7.50%) QA
3 2 (5.00%) COBIT
3 2 (5.00%) ISO/IEC 27001
3 2 (5.00%) NIST
4 1 (2.50%) Accessibility
4 1 (2.50%) SLA
System Software
1 1 (2.50%) Active Directory
Systems Management
1 1 (2.50%) AirWatch
1 1 (2.50%) Microsoft Intune
1 1 (2.50%) Symantec Enterprise Vault
1 1 (2.50%) Terraform
Vendors
1 16 (40.00%) Microsoft
2 4 (10.00%) ServiceNow
3 2 (5.00%) Google
3 2 (5.00%) Polycom
4 1 (2.50%) Automation Anywhere
4 1 (2.50%) iManage
4 1 (2.50%) Intapp
4 1 (2.50%) Marketo
4 1 (2.50%) Murex
4 1 (2.50%) Planview
4 1 (2.50%) Progress
4 1 (2.50%) Salesforce
4 1 (2.50%) Symantec