Power Automate Contracts in the City of London

Microsoft Power Automate (Formerly Microsoft Flow)
Central London > City of London

The table below provides summary statistics for contract job vacancies advertised in the City of London requiring Power Automate skills. It includes a benchmarking guide to the contractor rates offered in vacancies that cited Power Automate over the 6 months leading up to 4 July 2025, comparing them to the same period in the previous two years.

6 months to
4 Jul 2025
Same period 2024 Same period 2023
Rank 109 92 162
Rank change year-on-year -17 +70 +20
Contract jobs citing Power Automate 15 33 11
As % of all contract jobs advertised in the City of London 0.83% 1.54% 0.32%
As % of the Cloud Services category 1.95% 3.74% 0.77%
Number of daily rates quoted 8 20 6
10th Percentile £413 £468 £338
25th Percentile £431 £484 £399
Median daily rate (50th Percentile) £488 £625 £438
Median % change year-on-year -22.00% +42.86% -7.89%
75th Percentile £550 £700 £506
90th Percentile £613 £775 £556
Central London median daily rate £488 £588 £400
% change year-on-year -17.02% +46.88% -17.95%
Number of hourly rates quoted 1 0 0
10th Percentile - - -
25th Percentile £32.00 - -
Median hourly rate £34.00 - -
75th Percentile £36.00 - -
90th Percentile - - -
Central London median hourly rate £34.00 - -

All Cloud Skills
City of London

Power Automate falls under the Cloud Services category. For comparison with the information above, the following table provides summary statistics for all contract job vacancies requiring cloud computing skills in the City of London.

Contract vacancies with a requirement for cloud computing skills 770 882 1,420
As % of all contract IT jobs advertised in the City of London 42.49% 41.29% 40.66%
Number of daily rates quoted 497 617 922
10th Percentile £363 £363 £282
25th Percentile £463 £450 £461
Median daily rate (50th Percentile) £550 £550 £588
Median % change year-on-year - -6.38% +2.17%
75th Percentile £669 £675 £700
90th Percentile £751 £765 £800
Central London median daily rate £550 £550 £575
% change year-on-year - -4.35% -
Number of hourly rates quoted 14 6 10
10th Percentile £24.02 £12.75 £20.35
25th Percentile £25.18 £14.88 £38.13
Median hourly rate £38.58 £24.75 £67.50
Median % change year-on-year +55.86% -63.33% +35.00%
75th Percentile £63.37 £27.00 £88.30
90th Percentile £96.63 £38.63 -
Central London median hourly rate £34.65 £24.75 £52.50
% change year-on-year +40.00% -52.86% +26.51%

Power Automate
Job Vacancy Trend in the City of London

Job postings citing Power Automate as a proportion of all IT jobs advertised in the City of London.
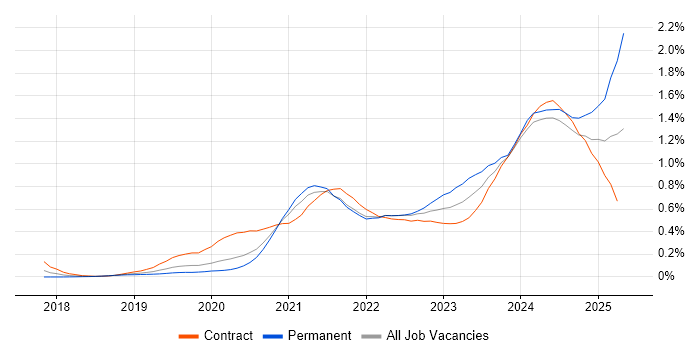
Job vacancy trend for Power Automate in the City of London

Power Automate
Contractor Daily Rate Trend in the City of London

3-month moving average daily rate quoted in jobs citing Power Automate in the City of London.

Daily rate trend for Power Automate in the City of London

Power Automate
Daily Rate Histogram in the City of London

Daily rate distribution for jobs citing Power Automate in the City of London over the 6 months to 4 July 2025.

Daily rate histogram for Power Automate in the City of London

Power Automate
Co-occurring Skills and Capabilities in the City of London by Category

The follow tables expand on the table above by listing co-occurrences grouped by category. The same employment type, locality and period is covered with up to 20 co-occurrences shown in each of the following categories:

Application Platforms
1 6 (40.00%) SharePoint
2 1 (6.67%) Microsoft Exchange
Applications
1 1 (6.67%) Microsoft Excel
1 1 (6.67%) Spreadsheet
Business Applications
1 2 (13.33%) Dynamics CRM
Cloud Services
1 13 (86.67%) Power Platform
2 11 (73.33%) PowerApps
3 9 (60.00%) Azure
4 7 (46.67%) Azure DevOps
4 7 (46.67%) Microsoft 365
5 4 (26.67%) Dynamics 365
6 2 (13.33%) Azure Logic Apps
6 2 (13.33%) Entra ID
6 2 (13.33%) GitHub
6 2 (13.33%) GitHub Actions
7 1 (6.67%) Azure AKS
7 1 (6.67%) Azure Monitor
7 1 (6.67%) Azure Service Bus
7 1 (6.67%) Azure Storage
7 1 (6.67%) Azure Table
7 1 (6.67%) GCP
7 1 (6.67%) IaaS
7 1 (6.67%) Microsoft Copilot
7 1 (6.67%) ShareGate
7 1 (6.67%) Snowflake
Communications & Networking
1 1 (6.67%) Firewall
Database & Business Intelligence
1 4 (26.67%) Power BI
2 1 (6.67%) Azure SQL Database
2 1 (6.67%) BigQuery
2 1 (6.67%) Data Warehouse
2 1 (6.67%) Power Query
2 1 (6.67%) SQL Server
Development Applications
1 3 (20.00%) JIRA
2 1 (6.67%) Jenkins
2 1 (6.67%) JMeter
2 1 (6.67%) LoadRunner
2 1 (6.67%) Postman
2 1 (6.67%) REST Assured
2 1 (6.67%) Selenium
General
1 5 (33.33%) Finance
1 5 (33.33%) Social Skills
2 2 (13.33%) Banking
2 2 (13.33%) Public Sector
3 1 (6.67%) Analytical Skills
3 1 (6.67%) Inclusion and Diversity
3 1 (6.67%) Marketing
Job Titles
1 7 (46.67%) Developer
2 4 (26.67%) Power Platform Developer
3 3 (20.00%) Power Apps Developer
4 2 (13.33%) Analyst
4 2 (13.33%) Applications Developer
4 2 (13.33%) Azure Engineer
4 2 (13.33%) Desktop Manager
4 2 (13.33%) Dynamics 365 Developer
4 2 (13.33%) Lead
4 2 (13.33%) Microsoft 365 Manager
4 2 (13.33%) Senior
4 2 (13.33%) Test Manager
4 2 (13.33%) Transformation Manager
5 1 (6.67%) Business Analyst
5 1 (6.67%) Data Analyst
5 1 (6.67%) Integration Developer
5 1 (6.67%) QA Engineer
5 1 (6.67%) Senior Analyst
5 1 (6.67%) Senior Business Analyst
5 1 (6.67%) SharePoint Developer
Libraries, Frameworks & Software Standards
1 4 (26.67%) REST
2 3 (20.00%) .NET
3 2 (13.33%) CSS
3 2 (13.33%) HTML
3 2 (13.33%) HTML5 Canvas
4 1 (6.67%) .NET Core
4 1 (6.67%) ADO
4 1 (6.67%) ARM Templates
4 1 (6.67%) Microsoft Graph
4 1 (6.67%) Middleware
4 1 (6.67%) SOAP
Miscellaneous
1 2 (13.33%) Low-Code
2 1 (6.67%) Data Structures
2 1 (6.67%) Enterprise Software
2 1 (6.67%) Legacy Systems
2 1 (6.67%) Onboarding
Operating Systems
1 2 (13.33%) Windows
Processes & Methodologies
1 8 (53.33%) DevOps
2 5 (33.33%) Agile
2 5 (33.33%) Stakeholder Management
3 4 (26.67%) Business Intelligence
3 4 (26.67%) Migration
4 3 (20.00%) CI/CD
4 3 (20.00%) Disaster Recovery
4 3 (20.00%) Problem-Solving
4 3 (20.00%) Test Automation
4 3 (20.00%) Test Strategy
4 3 (20.00%) User Acceptance Testing
5 2 (13.33%) Business Continuity
5 2 (13.33%) Customer Service
5 2 (13.33%) Data Encryption
5 2 (13.33%) Defect Management
5 2 (13.33%) High Availability
5 2 (13.33%) Infrastructure as Code
5 2 (13.33%) ITSM
5 2 (13.33%) Test Management
5 2 (13.33%) Test Planning
Programming Languages
1 4 (26.67%) C#
1 4 (26.67%) JavaScript
1 4 (26.67%) Python
2 3 (20.00%) PowerShell
2 3 (20.00%) SQL
3 1 (6.67%) Bash
3 1 (6.67%) Bicep
Qualifications
1 3 (20.00%) Azure Certification
2 2 (13.33%) BPSS Clearance
2 2 (13.33%) Microsoft Certification
2 2 (13.33%) Security Cleared
3 1 (6.67%) Computer Science Degree
3 1 (6.67%) Degree
Quality Assurance & Compliance
1 1 (6.67%) Accessibility
1 1 (6.67%) QA
System Software
1 2 (13.33%) Active Directory
Systems Management
1 2 (13.33%) HP ALM
1 2 (13.33%) Terraform
2 1 (6.67%) Grafana
2 1 (6.67%) Istio
2 1 (6.67%) Kubernetes
2 1 (6.67%) Microsoft Intune
2 1 (6.67%) Prometheus
2 1 (6.67%) Single Sign-On
Vendors
1 10 (66.67%) Microsoft
2 2 (13.33%) HP
3 1 (6.67%) Google