Low-Code Contracts with Hybrid/Remote/WFH Options

Low-Code
UK > Work from Home

The table below looks at the prevalence of the term Low-Code in remote or hybrid contract work. Included is a benchmarking guide to the contractor rates offered in vacancies that cited Low-Code over the 6 months leading up to 1 May 2025, comparing them to the same period in the previous two years.

6 months to
1 May 2025
Same period 2024 Same period 2023
Rank 274 312 449
Rank change year-on-year +38 +137 +147
Contract jobs citing Low-Code 30 33 28
As % of all contract jobs with a WFH option 0.30% 0.22% 0.11%
As % of the Miscellaneous category 0.92% 0.75% 0.34%
Number of daily rates quoted 15 25 22
10th Percentile £374 - £379
25th Percentile £488 £400 £450
Median daily rate (50th Percentile) £525 £500 £600
Median % change year-on-year +5.00% -16.67% +24.03%
75th Percentile £610 £544 £625
90th Percentile £670 - £796
UK median daily rate £550 £525 £575
% change year-on-year +4.76% -8.70% +15.00%

All Generic Skills
Work from Home

Low-Code falls under the General and Transferable Skills category. For comparison with the information above, the following table provides summary statistics for all contract job vacancies with remote or hybrid options requiring generic IT skills.

Contract vacancies with a requirement for generic IT skills 3,272 4,408 8,138
As % of all contract jobs with a WFH option 33.03% 28.73% 31.47%
Number of daily rates quoted 2,222 2,974 5,725
10th Percentile £350 £325 £363
25th Percentile £425 £431 £454
Median daily rate (50th Percentile) £545 £550 £550
Median % change year-on-year -0.91% - +2.33%
75th Percentile £680 £675 £688
90th Percentile £825 £800 £800
UK median daily rate £525 £538 £550
% change year-on-year -2.33% -2.27% -
Number of hourly rates quoted 76 199 151
10th Percentile £18.75 £15.48 £19.00
25th Percentile £26.25 £25.50 £31.38
Median hourly rate £41.75 £51.00 £57.50
Median % change year-on-year -18.14% -11.30% +29.21%
75th Percentile £64.57 £65.02 £70.00
90th Percentile £78.13 £72.50 £85.00
UK median hourly rate £32.05 £30.00 £22.49
% change year-on-year +6.83% +33.42% -18.24%

Low-Code
Trend for Jobs with a WFH Option

Job vacancies with remote working options citing Low-Code as a proportion of all IT jobs advertised.
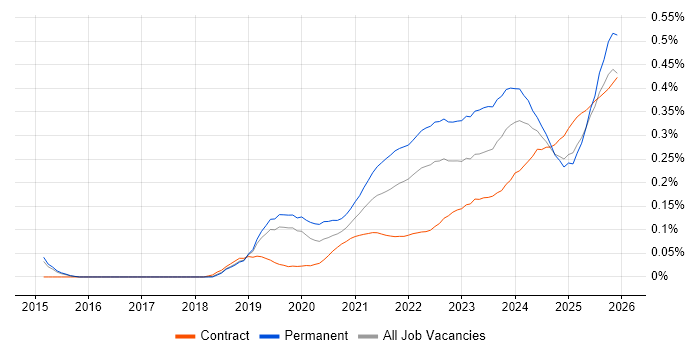
Low-Code trend for jobs with Hybrid/Remote/WFH options

Low-Code
Daily Rate Trend for Jobs with a WFH Option

3-month moving average daily rate quoted in job vacancies with remote working options citing Low-Code.

Low-Code daily rate for jobs with a WFH option

Low-Code
Daily Rate Histogram for Jobs with a WFH Option

Daily rate distribution for jobs with remote working options citing Low-Code over the 6 months to 1 May 2025.

Low-Code daily rate histogram for jobs with a WFH option

Low-Code
Co-occurring Skills and Capabilities with WFH Options by Category

The follow tables expand on the table above by listing co-occurrences grouped by category. The same employment type, locality and period is covered with up to 20 co-occurrences shown in each of the following categories:

Application Platforms
1 2 (6.67%) Mendix
2 1 (3.33%) SharePoint
Applications
1 1 (3.33%) Microsoft Excel
Business Applications
1 2 (6.67%) Dynamics CRM
Cloud Services
1 16 (53.33%) Power Platform
2 14 (46.67%) Azure
3 10 (33.33%) SaaS
4 9 (30.00%) PaaS
5 8 (26.67%) Dynamics 365
6 7 (23.33%) AWS
7 5 (16.67%) Power Automate
8 4 (13.33%) PowerApps
9 3 (10.00%) Azure DevOps
9 3 (10.00%) IaaS
9 3 (10.00%) Microsoft 365
10 2 (6.67%) Azure Logic Apps
10 2 (6.67%) Azure Monitor
10 2 (6.67%) Entra ID
10 2 (6.67%) GCP
11 1 (3.33%) Azure AKS
11 1 (3.33%) Azure Cosmos DB
11 1 (3.33%) Copilot Studio
11 1 (3.33%) GitHub Actions
11 1 (3.33%) Microsoft Copilot
Database & Business Intelligence
1 4 (13.33%) Power BI
2 2 (6.67%) Azure SQL Database
3 1 (3.33%) BigQuery
3 1 (3.33%) MariaDB
3 1 (3.33%) MongoDB
3 1 (3.33%) MySQL
3 1 (3.33%) PostgreSQL
3 1 (3.33%) Power Query
3 1 (3.33%) Redis
3 1 (3.33%) Tableau
Development Applications
1 1 (3.33%) RStudio
General
1 6 (20.00%) Public Sector
2 3 (10.00%) Finance
3 2 (6.67%) Banking
3 2 (6.67%) Social Skills
4 1 (3.33%) Analytical Skills
4 1 (3.33%) Financial Institution
4 1 (3.33%) Military
Job Titles
1 18 (60.00%) Developer
2 4 (13.33%) Architect
3 3 (10.00%) Power Platform Developer
4 2 (6.67%) Consultant
4 2 (6.67%) Low-Code Developer
4 2 (6.67%) SAP Consultant
4 2 (6.67%) Software Engineer
4 2 (6.67%) Solutions Architect
5 1 (3.33%) Cloud Architect
5 1 (3.33%) Cloud Solutions Architect
5 1 (3.33%) Data Analytics Architect
5 1 (3.33%) Data Architect
5 1 (3.33%) Development Specialist
5 1 (3.33%) DevOps Engineer
5 1 (3.33%) HTML Developer
5 1 (3.33%) JavaScript Developer
5 1 (3.33%) Lead Developer
5 1 (3.33%) Platform Manager
5 1 (3.33%) Product Manager
5 1 (3.33%) Senior Developer
Libraries, Frameworks & Software Standards
1 11 (36.67%) CSS
1 11 (36.67%) HTML
2 2 (6.67%) .NET
2 2 (6.67%) HTML5
2 2 (6.67%) HTML5 Canvas
3 1 (3.33%) ARM Templates
3 1 (3.33%) JSON
3 1 (3.33%) YAML
Miscellaneous
1 6 (20.00%) Public Cloud
2 2 (6.67%) Enterprise Software
3 1 (3.33%) Hybrid Cloud
3 1 (3.33%) Linux Command Line
3 1 (3.33%) Replication
Processes & Methodologies
1 7 (23.33%) Agile
2 4 (13.33%) DevOps
2 4 (13.33%) Roadmaps
3 3 (10.00%) Artificial Intelligence
3 3 (10.00%) Business Intelligence
3 3 (10.00%) Continuous Improvement
3 3 (10.00%) Machine Learning
3 3 (10.00%) Problem-Solving
3 3 (10.00%) User Experience
3 3 (10.00%) UX Design
4 2 (6.67%) CRM
4 2 (6.67%) Data Visualisation
4 2 (6.67%) Migration
4 2 (6.67%) Process Management
4 2 (6.67%) Software Engineering
4 2 (6.67%) Stakeholder Engagement
4 2 (6.67%) Stakeholder Management
4 2 (6.67%) Use Case
4 2 (6.67%) Validation
4 2 (6.67%) Visualisation
Programming Languages
1 13 (43.33%) JavaScript
2 6 (20.00%) SQL
3 2 (6.67%) C#
3 2 (6.67%) Python
4 1 (3.33%) Bash
4 1 (3.33%) Bicep
4 1 (3.33%) Data Analysis Expressions
4 1 (3.33%) Java
4 1 (3.33%) PowerShell
4 1 (3.33%) VBA
Qualifications
1 7 (23.33%) SC Cleared
1 7 (23.33%) Security Cleared
2 1 (3.33%) BPSS Clearance
Quality Assurance & Compliance
1 1 (3.33%) Actionable Recommendations
1 1 (3.33%) QA
System Software
1 2 (6.67%) Virtual Desktop
2 1 (3.33%) Active Directory
2 1 (3.33%) Docker
2 1 (3.33%) Virtual Machines
Systems Management
1 1 (3.33%) Ansible
1 1 (3.33%) Grafana
1 1 (3.33%) Kubernetes
1 1 (3.33%) Progress Chef
1 1 (3.33%) Prometheus
1 1 (3.33%) Terraform
Vendors
1 12 (40.00%) Microsoft
1 12 (40.00%) OutSystems
2 2 (6.67%) SAP
3 1 (3.33%) Alteryx
3 1 (3.33%) Databricks
3 1 (3.33%) Google