Use Case Contracts with Work from Home Options

Use Cases
UK > Work from Home

The table below provides summary statistics for contract job vacancies with an option to work from home (WFH) and a requirement for Use Case skills. Included is a benchmarking guide to the contractor rates offered in vacancies that have cited Use Case over the 6 months to 30 April 2024 with a comparison to the same period in the previous 2 years.

6 months to
30 Apr 2024
Same period 2023 Same period 2022
Rank 139 207 196
Rank change year-on-year +68 -11 -7
Contract jobs citing Use Case 237 312 627
As % of all contract jobs with a WFH option 1.54% 1.21% 1.41%
As % of the Processes & Methodologies category 1.76% 1.34% 1.54%
Number of daily rates quoted 176 210 403
10th Percentile £425 £400 £400
25th Percentile £488 £450 £459
Median daily rate (50th Percentile) £569 £550 £530
Median % change year-on-year +3.41% +3.77% +2.91%
75th Percentile £663 £688 £650
90th Percentile £755 £813 £752
UK median daily rate £550 £550 £550
% change year-on-year - - +10.00%
Number of hourly rates quoted 3 8 12
10th Percentile £44.00 £46.68 £21.15
25th Percentile £50.00 £57.81 £54.00
Median hourly rate £60.00 £70.00 £58.25
Median % change year-on-year -14.29% +20.17% +94.43%
75th Percentile £71.50 - £65.94
90th Percentile £78.40 £76.00 £68.75
UK median hourly rate £55.00 £70.00 £56.50
% change year-on-year -21.43% +23.89% +7.77%

All Process and Methodology Skills
Work from Home

Use Case is in the Processes and Methodologies category. The following table is for comparison with the above and provides summary statistics for all contract job vacancies with a WFH option and a requirement for process or methodology skills.

Contract vacancies with a requirement for process or methodology skills 13,483 23,229 40,650
As % of all contract jobs with a WFH option 87.87% 89.84% 91.14%
Number of daily rates quoted 8,996 16,418 29,502
10th Percentile £325 £363 £360
25th Percentile £425 £450 £431
Median daily rate (50th Percentile) £525 £540 £525
Median % change year-on-year -2.78% +2.86% +8.81%
75th Percentile £638 £650 £625
90th Percentile £750 £750 £719
UK median daily rate £525 £550 £525
% change year-on-year -4.55% +4.76% +7.69%
Number of hourly rates quoted 579 532 548
10th Percentile £15.17 £19.00 £13.50
25th Percentile £25.25 £30.54 £19.98
Median hourly rate £43.00 £55.00 £35.00
Median % change year-on-year -21.82% +57.14% +34.62%
75th Percentile £60.00 £68.75 £55.00
90th Percentile £75.25 £80.23 £67.50
UK median hourly rate £35.65 £37.30 £25.00
% change year-on-year -4.42% +49.20% -

Use Case
Trend for Jobs with a WFH Option

Job vacancies with a work from home option citing Use Case as a proportion of all IT jobs advertised.
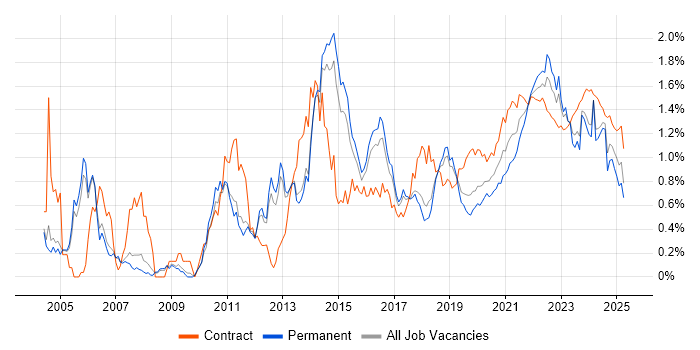
Use Case trend for jobs with a WFH option

Use Case
Daily Rate Trend for Jobs with a WFH Option

3-month moving average daily rate quoted in job vacancies with a work from home option citing Use Case.

Use Case daily rate for jobs with a WFH option

Use Case
Daily Rate Histogram for Jobs with a WFH Option

Daily rate distribution for jobs with a work from home option citing Use Case over the 6 months to 30 April 2024.

Use Case daily rate histogram for jobs with a WFH option

Use Case
Hourly Rate Trend for Jobs with a WFH Option

3-month moving average hourly rate quoted in job vacancies with a work from home option citing Use Case.

Use Case hourly rate for jobs with a WFH option

Use Case
Hourly Rate Histogram for Jobs with a WFH Option

Hourly rate distribution for jobs with a work from home option citing Use Case over the 6 months to 30 April 2024.

Use Case hourly rate histogram for jobs with a WFH option

Use Case
Co-occurring Skills and Capabilities with WFH Options by Category

The follow tables expand on the table above by listing co-occurrences grouped by category. The same employment type, locality and period is covered with up to 20 co-occurrences shown in each of the following categories:

Application Platforms
1 13 (5.49%) Confluence
2 3 (1.27%) Apache
2 3 (1.27%) CMS
2 3 (1.27%) IIS
2 3 (1.27%) WebLogic
2 3 (1.27%) WebSphere
3 2 (0.84%) Oracle Self-Service HR
3 2 (0.84%) SharePoint
4 1 (0.42%) ArcGIS
4 1 (0.42%) Microsoft Exchange
4 1 (0.42%) SharePoint 2013
4 1 (0.42%) Sitecore CMS
Applications
1 17 (7.17%) MS Visio
2 9 (3.80%) Microsoft Excel
2 9 (3.80%) Microsoft Office
2 9 (3.80%) Microsoft PowerPoint
3 3 (1.27%) Spreadsheet
4 1 (0.42%) Adobe Illustrator
4 1 (0.42%) Photoshop
Business Applications
1 9 (3.80%) Dynamics GP
2 7 (2.95%) Dynamics CRM
3 6 (2.53%) Endur
4 2 (0.84%) Dynamics AX
4 2 (0.84%) Dynamics NAV
4 2 (0.84%) NetSuite
4 2 (0.84%) Oracle EBS
4 2 (0.84%) Oracle Procure-to-Pay
4 2 (0.84%) SAP BPC
4 2 (0.84%) SAP S/4HANA
5 1 (0.42%) Oracle ERP
Cloud Services
1 46 (19.41%) Azure
2 35 (14.77%) AWS
3 16 (6.75%) Power Platform
4 11 (4.64%) GCP
5 9 (3.80%) Amazon EKS
6 8 (3.38%) SaaS
6 8 (3.38%) Serverless
7 7 (2.95%) Azure DevOps
7 7 (2.95%) dbt
7 7 (2.95%) PowerApps
8 6 (2.53%) Power Automate
9 5 (2.11%) Amazon CloudWatch
9 5 (2.11%) Amazon ECS
9 5 (2.11%) Amazon Kinesis
9 5 (2.11%) AWS Lambda
9 5 (2.11%) AWS Step Functions
9 5 (2.11%) IaaS
9 5 (2.11%) Microsoft 365
9 5 (2.11%) OpenShift
9 5 (2.11%) PaaS
Communications & Networking
1 13 (5.49%) Firewall
2 6 (2.53%) TCP/IP
3 5 (2.11%) Cisco ISE
3 5 (2.11%) HTTP
3 5 (2.11%) Network Security
4 4 (1.69%) Intrusion Detection
4 4 (1.69%) tcpdump
4 4 (1.69%) Wireshark
5 2 (0.84%) DNS
5 2 (0.84%) Reverse Proxy
5 2 (0.84%) SSH
5 2 (0.84%) VPN
6 1 (0.42%) DMZ
Database & Business Intelligence
1 13 (5.49%) Power BI
2 8 (3.38%) SQL Server
3 6 (2.53%) PostgreSQL
4 5 (2.11%) Amazon Redshift
4 5 (2.11%) Metadata
5 4 (1.69%) Apache Hive
5 4 (1.69%) Big Data
5 4 (1.69%) Hadoop
5 4 (1.69%) Tableau
6 3 (1.27%) Data Warehouse
6 3 (1.27%) DB2
7 2 (0.84%) Data Lake
7 2 (0.84%) Elasticsearch
7 2 (0.84%) MySQL
8 1 (0.42%) Data Vault
8 1 (0.42%) Geospatial Data
8 1 (0.42%) GIS
8 1 (0.42%) OLAP
8 1 (0.42%) OLTP
8 1 (0.42%) Pinecone
Development Applications
1 34 (14.35%) JIRA
2 14 (5.91%) Git
3 10 (4.22%) Jenkins
4 7 (2.95%) Atlassian Bamboo
4 7 (2.95%) GitLab
5 4 (1.69%) IDA Disassembler
6 2 (0.84%) CircleCI
6 2 (0.84%) Travis CI
7 1 (0.42%) Balsamiq
7 1 (0.42%) Bitbucket
7 1 (0.42%) IntelliJ
7 1 (0.42%) Mercurial
7 1 (0.42%) SonarQube
7 1 (0.42%) Subversion
General
1 68 (28.69%) Social Skills
2 57 (24.05%) Finance
3 44 (18.57%) Analytical Skills
4 30 (12.66%) Public Sector
5 14 (5.91%) Banking
5 14 (5.91%) Manufacturing
6 12 (5.06%) Presentation Skills
7 7 (2.95%) Marketing
8 6 (2.53%) Financial Institution
8 6 (2.53%) Legal
9 5 (2.11%) Telecoms
10 4 (1.69%) Back Office
10 4 (1.69%) Front Office
11 3 (1.27%) Automotive
11 3 (1.27%) German Language
11 3 (1.27%) Influencing Skills
12 2 (0.84%) Documentation Skills
12 2 (0.84%) Law
13 1 (0.42%) Military
13 1 (0.42%) Publishing
Job Titles
1 68 (28.69%) Analyst
2 47 (19.83%) Business Analyst
3 42 (17.72%) Architect
4 40 (16.88%) Consultant
5 29 (12.24%) Senior
6 20 (8.44%) Senior Analyst
7 14 (5.91%) Lead
7 14 (5.91%) Solutions Architect
8 13 (5.49%) Senior Business Analyst
9 11 (4.64%) Technical Analyst
10 9 (3.80%) Developer
10 9 (3.80%) DevOps Engineer
10 9 (3.80%) Great Plains Consultant
10 9 (3.80%) Microsoft Consultant
10 9 (3.80%) Technical Architect
11 7 (2.95%) Data Consultant
11 7 (2.95%) Data Engineer
11 7 (2.95%) Security Architect
12 6 (2.53%) SIEM Architect
13 5 (2.11%) AWS Data Engineer
Libraries, Frameworks & Software Standards
1 9 (3.80%) OpenID
2 8 (3.38%) PySpark
3 7 (2.95%) SAML
4 6 (2.53%) .NET
4 6 (2.53%) CSS
4 6 (2.53%) HTML
4 6 (2.53%) Node.js
5 5 (2.11%) LDAP
5 5 (2.11%) OAuth
5 5 (2.11%) React
5 5 (2.11%) XML
6 4 (1.69%) OLE
6 4 (1.69%) Oracle Fusion
6 4 (1.69%) Web Services
7 3 (1.27%) EJB
7 3 (1.27%) J2EE
7 3 (1.27%) JSP
7 3 (1.27%) Servlets
7 3 (1.27%) XACML
8 2 (0.84%) DOM
Miscellaneous
1 14 (5.91%) Product Ownership
2 12 (5.06%) Management Information System
3 9 (3.80%) Cloud Native
3 9 (3.80%) Cyber Kill Chain
4 6 (2.53%) Data Structures
4 6 (2.53%) Hybrid Cloud
4 6 (2.53%) Self-Motivation
5 5 (2.11%) Cyber Threat
5 5 (2.11%) Onboarding
5 5 (2.11%) Reference Data
6 4 (1.69%) CMDB
6 4 (1.69%) YARA
7 3 (1.27%) Cyber Defence
7 3 (1.27%) Digital Media
7 3 (1.27%) Infotainment
7 3 (1.27%) Renewable Energy
7 3 (1.27%) Security Posture
8 2 (0.84%) Algorithms
8 2 (0.84%) NHS
8 2 (0.84%) Security Operations Centre
Operating Systems
1 8 (3.38%) Windows
2 7 (2.95%) Linux
Processes & Methodologies
1 71 (29.96%) Agile
2 36 (15.19%) Analytics
2 36 (15.19%) Problem-Solving
3 35 (14.77%) Roadmaps
3 35 (14.77%) SIEM
4 34 (14.35%) Stakeholder Management
5 32 (13.50%) User Stories
6 30 (12.66%) DevOps
7 27 (11.39%) Business Analysis
8 26 (10.97%) Cybersecurity
9 25 (10.55%) Data Modelling
10 23 (9.70%) Change Management
10 23 (9.70%) Migration
10 23 (9.70%) User Acceptance Testing
11 21 (8.86%) Business Intelligence
11 21 (8.86%) Decision-Making
12 18 (7.59%) CI/CD
13 17 (7.17%) Data Governance
14 16 (6.75%) Information Security
14 16 (6.75%) Mentoring
Programming Languages
1 29 (12.24%) Python
2 24 (10.13%) SQL
3 13 (5.49%) Java
4 10 (4.22%) JavaScript
5 8 (3.38%) Bash
6 6 (2.53%) PowerShell
7 5 (2.11%) Go
7 5 (2.11%) Perl
8 4 (1.69%) Search Processing Language
9 3 (1.27%) C#
10 2 (0.84%) Kusto Query Language
10 2 (0.84%) R
10 2 (0.84%) Scala
10 2 (0.84%) T-SQL
10 2 (0.84%) TypeScript
11 1 (0.42%) Clojure
11 1 (0.42%) Haskell
11 1 (0.42%) Kotlin
11 1 (0.42%) Ruby
11 1 (0.42%) Rust
Qualifications
1 35 (14.77%) Degree
2 30 (12.66%) Security Cleared
3 18 (7.59%) SC Cleared
4 14 (5.91%) DV Cleared
5 10 (4.22%) Computer Science Degree
6 6 (2.53%) Master's Degree
7 4 (1.69%) MBA
7 4 (1.69%) Numerate Degree
7 4 (1.69%) SANS
8 3 (1.27%) (ISC)2 CCSP
8 3 (1.27%) Cisco Certification
8 3 (1.27%) CISSP
8 3 (1.27%) PhD
9 2 (0.84%) ITIL Certification
10 1 (0.42%) Azure Certification
10 1 (0.42%) CBAP
10 1 (0.42%) CSPO
10 1 (0.42%) IIBA
10 1 (0.42%) ISEB
Quality Assurance & Compliance
1 20 (8.44%) NIST
2 19 (8.02%) Data Quality
3 16 (6.75%) QA
4 9 (3.80%) Sarbanes-Oxley
5 6 (2.53%) GDPR
6 5 (2.11%) GRC
6 5 (2.11%) HMG Security Policy Framework
6 5 (2.11%) ISO/IEC 27001
7 3 (1.27%) Disclosure Scotland
7 3 (1.27%) NIST 800
8 2 (0.84%) PCI DSS
8 2 (0.84%) PSD2
9 1 (0.42%) Accessibility
9 1 (0.42%) SNOMED CT
System Software
1 4 (1.69%) Docker
1 4 (1.69%) Snort
2 1 (0.42%) Active Directory
Systems Management
1 14 (5.91%) Kubernetes
2 9 (3.80%) Terraform
3 6 (2.53%) Kibana
4 5 (2.11%) Single Sign-On
5 3 (1.27%) Ansible
5 3 (1.27%) Puppet
6 2 (0.84%) Docker Swarm
6 2 (0.84%) Grafana
6 2 (0.84%) logstash
6 2 (0.84%) Progress Chef
6 2 (0.84%) Prometheus
7 1 (0.42%) Argo
7 1 (0.42%) PingFederate
7 1 (0.42%) SCOM
Vendors
1 45 (18.99%) Microsoft
2 20 (8.44%) Splunk
3 14 (5.91%) Oracle
4 13 (5.49%) Google
5 10 (4.22%) LogRhythm
6 9 (3.80%) CyberArk
6 9 (3.80%) Informatica
6 9 (3.80%) SAP
7 7 (2.95%) ServiceNow
8 6 (2.53%) Databricks
8 6 (2.53%) Facebook
8 6 (2.53%) Instagram
9 5 (2.11%) Cisco
9 5 (2.11%) Pega
10 3 (1.27%) Atlassian
10 3 (1.27%) Centrify
10 3 (1.27%) Okta
10 3 (1.27%) OpenLink
11 2 (0.84%) BeyondTrust
11 2 (0.84%) UiPath