SaaS Contracts with Hybrid/Remote/WFH Options

Software as a Service (SaaS)
UK > Work from Home

The table below provides summary statistics for remote or hybrid contract work requiring SaaS skills. It includes a benchmarking guide to the contractor rates offered in vacancies that cited SaaS over the 6 months leading up to 1 May 2025, comparing them to the same period in the previous two years.

6 months to
1 May 2025
Same period 2024 Same period 2023
Rank 102 101 100
Rank change year-on-year -1 -1 +6
Contract jobs citing SaaS 247 337 613
As % of all contract jobs with a WFH option 2.49% 2.20% 2.37%
As % of the Cloud Services category 6.27% 6.06% 5.99%
Number of daily rates quoted 186 203 432
10th Percentile £357 £401 £401
25th Percentile £425 £445 £458
Median daily rate (50th Percentile) £537 £550 £550
Median % change year-on-year -2.36% - -4.35%
75th Percentile £738 £640 £661
90th Percentile £838 £735 £774
UK median daily rate £550 £550 £550
% change year-on-year - - -4.35%
Number of hourly rates quoted 1 16 2
10th Percentile - - £30.93
25th Percentile £89.68 £25.50 £38.69
Median hourly rate £93.08 £26.00 £54.25
Median % change year-on-year +258.00% -52.07% +35.63%
75th Percentile £96.49 £29.41 £69.69
90th Percentile - £45.94 £77.38
UK median hourly rate £77.19 £26.00 £76.71
% change year-on-year +196.88% -66.10% +91.76%

All Cloud Skills
Work from Home

SaaS falls under the Cloud Services category. For comparison with the information above, the following table provides summary statistics for all contract job vacancies with remote or hybrid options requiring cloud computing skills.

Contract vacancies with a requirement for cloud computing skills 3,940 5,557 10,236
As % of all contract jobs with a WFH option 39.78% 36.21% 39.59%
Number of daily rates quoted 2,887 3,982 7,514
10th Percentile £351 £350 £373
25th Percentile £425 £430 £450
Median daily rate (50th Percentile) £523 £525 £550
Median % change year-on-year -0.38% -4.55% -
75th Percentile £630 £638 £650
90th Percentile £750 £738 £743
UK median daily rate £520 £525 £550
% change year-on-year -0.95% -4.55% -
Number of hourly rates quoted 42 89 125
10th Percentile £16.00 £15.50 £16.43
25th Percentile £25.25 £17.00 £21.31
Median hourly rate £35.00 £26.00 £55.00
Median % change year-on-year +34.62% -52.73% +83.33%
75th Percentile £70.63 £50.25 £70.00
90th Percentile £92.50 £64.37 £78.40
UK median hourly rate £27.35 £21.00 £35.00
% change year-on-year +30.24% -40.00% +62.79%

SaaS
Trend for Jobs with a WFH Option

Job vacancies with remote working options citing SaaS as a proportion of all IT jobs advertised.
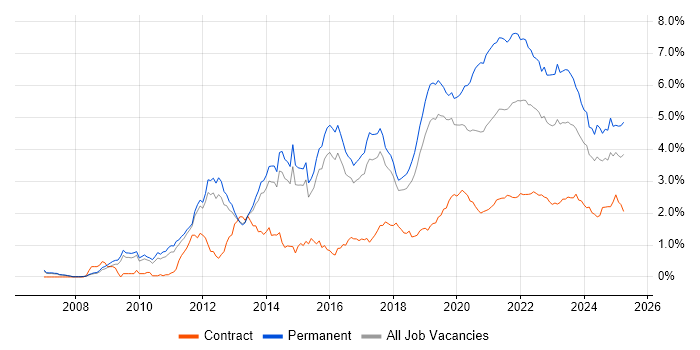
SaaS trend for jobs with Hybrid/Remote/WFH options

SaaS
Daily Rate Trend for Jobs with a WFH Option

3-month moving average daily rate quoted in job vacancies with remote working options citing SaaS.

SaaS daily rate for jobs with a WFH option

SaaS
Daily Rate Histogram for Jobs with a WFH Option

Daily rate distribution for jobs with remote working options citing SaaS over the 6 months to 1 May 2025.

SaaS daily rate histogram for jobs with a WFH option

SaaS
Hourly Rate Trend for Jobs with a WFH Option

3-month moving average hourly rate quoted in job vacancies with remote working options citing SaaS.

SaaS hourly rate for jobs with a WFH option

SaaS
Co-occurring Skills and Capabilities with WFH Options by Category

The follow tables expand on the table above by listing co-occurrences grouped by category. The same employment type, locality and period is covered with up to 20 co-occurrences shown in each of the following categories:

Application Platforms
1 19 (7.69%) SharePoint
2 18 (7.29%) Microsoft Exchange
3 8 (3.24%) Confluence
4 2 (0.81%) Apache Spark
4 2 (0.81%) Camunda
4 2 (0.81%) SAS
5 1 (0.40%) BizTalk Server
5 1 (0.40%) CMS
5 1 (0.40%) IIS
Applications
1 5 (2.02%) Microsoft Excel
2 4 (1.62%) Microsoft Project
3 1 (0.40%) Chatbot
3 1 (0.40%) Microsoft Office
3 1 (0.40%) Notion
3 1 (0.40%) Oracle Smart View
3 1 (0.40%) Spreadsheet
3 1 (0.40%) Trello
Business Applications
1 5 (2.02%) Aladdin
1 5 (2.02%) NetSuite
2 4 (1.62%) Dynamics CRM
2 4 (1.62%) Primavera
2 4 (1.62%) Unit4 Business World
3 2 (0.81%) Oracle Assets
3 2 (0.81%) Oracle Cash Management
3 2 (0.81%) Oracle General Ledger
3 2 (0.81%) Oracle Payables
3 2 (0.81%) Oracle Receivables
4 1 (0.40%) Oracle ERP
4 1 (0.40%) Oracle Financials
4 1 (0.40%) SAP Oil and Gas
4 1 (0.40%) SAP S/4HANA
4 1 (0.40%) Visualfiles
Cloud Services
1 112 (45.34%) Azure
2 86 (34.82%) PaaS
3 71 (28.74%) AWS
4 70 (28.34%) IaaS
5 33 (13.36%) Microsoft 365
6 32 (12.96%) GCP
7 29 (11.74%) Entra ID
8 25 (10.12%) AWS CloudFormation
9 19 (7.69%) Serverless
10 15 (6.07%) Power Platform
11 13 (5.26%) OCI
12 12 (4.86%) Azure DevOps
13 11 (4.45%) GitHub
14 8 (3.24%) Amazon CloudWatch
14 8 (3.24%) AWS Fargate
14 8 (3.24%) Cloud Computing
15 7 (2.83%) Amazon ECS
15 7 (2.83%) Amazon EKS
15 7 (2.83%) AWS Lambda
15 7 (2.83%) OneDrive
Communications & Networking
1 23 (9.31%) Firewall
2 22 (8.91%) DHCP
2 22 (8.91%) DNS
2 22 (8.91%) HTTP
3 21 (8.50%) TCP/IP
4 19 (7.69%) BGP
4 19 (7.69%) HTTPS
4 19 (7.69%) OSPF
5 6 (2.43%) VSAN
6 5 (2.02%) SSL
7 4 (1.62%) Kerberos
8 3 (1.21%) IPsec
8 3 (1.21%) Skype
8 3 (1.21%) Wi-Fi
9 2 (0.81%) NAS
9 2 (0.81%) Network Security
9 2 (0.81%) VPN
10 1 (0.40%) FTP
10 1 (0.40%) Internet
10 1 (0.40%) VLAN
Database & Business Intelligence
1 11 (4.45%) MongoDB
2 10 (4.05%) SQL Server
3 9 (3.64%) PostgreSQL
4 8 (3.24%) Oracle Reports
5 7 (2.83%) Amazon RDS
5 7 (2.83%) Data Warehouse
6 6 (2.43%) Azure SQL Database
6 6 (2.43%) Power BI
6 6 (2.43%) SQL Server Integration Services
6 6 (2.43%) SQL Server Reporting Services
7 5 (2.02%) Data Mining
7 5 (2.02%) NoSQL
8 4 (1.62%) Oracle BI Publisher
8 4 (1.62%) Oracle ODI
9 3 (1.21%) Amazon Redshift
10 2 (0.81%) Amazon Athena
10 2 (0.81%) Azure SQL Data Warehouse
10 2 (0.81%) Data Lake
10 2 (0.81%) Data Vault
11 1 (0.40%) Metadata
Development Applications
1 17 (6.88%) JIRA
2 12 (4.86%) Git
2 12 (4.86%) Jenkins
3 11 (4.45%) GitLab
4 4 (1.62%) Postman
5 3 (1.21%) Maven
5 3 (1.21%) TeamCity
6 2 (0.81%) Cucumber
6 2 (0.81%) Cypress.io
6 2 (0.81%) Oracle Forms
6 2 (0.81%) Selenium
6 2 (0.81%) Subversion
6 2 (0.81%) Terragrunt
6 2 (0.81%) WebDriver
7 1 (0.40%) CircleCI
7 1 (0.40%) Hudson
7 1 (0.40%) MLflow
7 1 (0.40%) Mockito
7 1 (0.40%) Octopus Deploy
7 1 (0.40%) Vagrant
General
1 57 (23.08%) Finance
2 44 (17.81%) Social Skills
3 21 (8.50%) Public Sector
4 13 (5.26%) Analytical Skills
5 9 (3.64%) Banking
6 7 (2.83%) Legal
7 6 (2.43%) Marketing
7 6 (2.43%) Telecoms
8 5 (2.02%) Inclusion and Diversity
8 5 (2.02%) Retail
9 4 (1.62%) Back Office
9 4 (1.62%) Influencing Skills
9 4 (1.62%) Organisational Skills
9 4 (1.62%) Presentation Skills
10 3 (1.21%) Billing
10 3 (1.21%) Military
11 2 (0.81%) Investment Banking
12 1 (0.40%) Electronics
12 1 (0.40%) General Ledger
12 1 (0.40%) Manufacturing
Job Titles
1 75 (30.36%) Architect
2 32 (12.96%) Technical Architect
3 31 (12.55%) Senior
4 25 (10.12%) Cloud Architect
5 24 (9.72%) Developer
6 22 (8.91%) Analyst
7 18 (7.29%) Cloud Native Architect
7 18 (7.29%) Solutions Architect
8 15 (6.07%) AWS Architect
8 15 (6.07%) Security Architect
9 12 (4.86%) Project Manager
10 11 (4.45%) Lead
10 11 (4.45%) Senior Architect
11 10 (4.05%) Applications Support
11 10 (4.05%) Business Analyst
11 10 (4.05%) Consultant
11 10 (4.05%) Microsoft 365 Engineer
12 9 (3.64%) IT Manager
12 9 (3.64%) Network Security Architect
12 9 (3.64%) Security Technical Architect
Libraries, Frameworks & Software Standards
1 19 (7.69%) CSS
2 14 (5.67%) .NET
2 14 (5.67%) HTML
3 13 (5.26%) REST
4 10 (4.05%) React
5 9 (3.64%) AngularJS
5 9 (3.64%) Node.js
5 9 (3.64%) Web Services
6 8 (3.24%) Oracle Fusion
7 7 (2.83%) SAML
7 7 (2.83%) XML
8 6 (2.43%) Spring Boot
9 5 (2.02%) Alpine.js
9 5 (2.02%) Laravel
9 5 (2.02%) OAuth
9 5 (2.02%) OpenID
9 5 (2.02%) Spring
9 5 (2.02%) Tailwind CSS
10 4 (1.62%) Kafka
10 4 (1.62%) OAuth2
Miscellaneous
1 26 (10.53%) Cloud Native
2 19 (7.69%) Hybrid Cloud
3 12 (4.86%) Public Cloud
4 10 (4.05%) Data Centre
4 10 (4.05%) Low-Code
5 9 (3.64%) PKI
6 7 (2.83%) Onboarding
7 6 (2.43%) Data Protection Act
7 6 (2.43%) Product Ownership
8 5 (2.02%) Enterprise Software
8 5 (2.02%) Greenfield Project
8 5 (2.02%) Legacy Systems
8 5 (2.02%) Security Posture
9 4 (1.62%) CMDB
9 4 (1.62%) Linux Command Line
9 4 (1.62%) Mobile App
10 3 (1.21%) Distributed Denial-of-Service
10 3 (1.21%) Management Information System
10 3 (1.21%) Reinsurance
10 3 (1.21%) SWIFT Messaging Network
Operating Systems
1 21 (8.50%) Windows
2 12 (4.86%) Windows Server
3 7 (2.83%) Linux
4 4 (1.62%) Android
4 4 (1.62%) Apple iOS
5 1 (0.40%) CentOS
5 1 (0.40%) Mac OS
5 1 (0.40%) Oracle Linux
5 1 (0.40%) Red Hat Enterprise Linux
5 1 (0.40%) Solaris
5 1 (0.40%) Ubuntu
5 1 (0.40%) Unix
Processes & Methodologies
1 67 (27.13%) Agile
2 39 (15.79%) Problem-Solving
3 37 (14.98%) Infrastructure as Code
4 36 (14.57%) CI/CD
5 30 (12.15%) DevOps
5 30 (12.15%) Migration
6 28 (11.34%) Roadmaps
7 26 (10.53%) Microservices
8 25 (10.12%) Analytics
9 24 (9.72%) Stakeholder Management
9 24 (9.72%) Test Automation
10 21 (8.50%) Project Management
11 20 (8.10%) ITIL
12 19 (7.69%) Sprint Planning
13 17 (6.88%) Continuous Improvement
13 17 (6.88%) Decision-Making
13 17 (6.88%) Scrum
14 16 (6.48%) ERP
14 16 (6.48%) TOGAF
15 15 (6.07%) Data Modelling
Programming Languages
1 47 (19.03%) SQL
2 24 (9.72%) JavaScript
2 24 (9.72%) PowerShell
3 21 (8.50%) Bicep
4 17 (6.88%) Python
5 15 (6.07%) Java
6 8 (3.24%) C#
7 6 (2.43%) PHP
7 6 (2.43%) PL/SQL
8 5 (2.02%) TypeScript
9 3 (1.21%) Bash
9 3 (1.21%) Shell Script
9 3 (1.21%) VBA
10 2 (0.81%) C++
10 2 (0.81%) T-SQL
10 2 (0.81%) VBScript
11 1 (0.40%) Go
11 1 (0.40%) Groovy
11 1 (0.40%) Ruby
Qualifications
1 41 (16.60%) Security Cleared
2 39 (15.79%) SC Cleared
3 12 (4.86%) Degree
4 10 (4.05%) AWS Certification
5 7 (2.83%) AWS Certified Solutions Architect
5 7 (2.83%) MCSE
5 7 (2.83%) Microsoft Certification
6 6 (2.43%) VMware Certified Professional (VCP)
7 5 (2.02%) Azure Certification
8 4 (1.62%) BPSS Clearance
8 4 (1.62%) Computer Science Degree
8 4 (1.62%) DV Cleared
8 4 (1.62%) OCP
8 4 (1.62%) Oracle Certification
9 3 (1.21%) (ISC)2 CCSP
9 3 (1.21%) Cisco Certification
9 3 (1.21%) TOGAF Certification
10 2 (0.81%) AWS Certified Cloud Practitioner
10 2 (0.81%) CREST Certified
10 2 (0.81%) ISTQB Foundation Certification
Quality Assurance & Compliance
1 10 (4.05%) GDPR
2 8 (3.24%) NCSC
3 6 (2.43%) Cyber Essentials
3 6 (2.43%) NIST
3 6 (2.43%) QA
4 5 (2.02%) Data Quality
5 4 (1.62%) SLA
5 4 (1.62%) SOC 2
6 3 (1.21%) Basel II
6 3 (1.21%) PMO
7 2 (0.81%) PCI DSS
8 1 (0.40%) Accessibility
8 1 (0.40%) Basel III
8 1 (0.40%) Disclosure Scotland
8 1 (0.40%) ISO/IEC 27001
8 1 (0.40%) Sarbanes-Oxley
8 1 (0.40%) WCAG
System Software
1 27 (10.93%) Active Directory
2 10 (4.05%) VMware Infrastructure
3 8 (3.24%) Docker
4 6 (2.43%) Virtual Machines
4 6 (2.43%) VMware NSX
5 3 (1.21%) RACF
5 3 (1.21%) Virtual Desktop
6 1 (0.40%) Hyper-V
6 1 (0.40%) VMware ESXi
Systems Management
1 37 (14.98%) Terraform
2 14 (5.67%) Single Sign-On
3 12 (4.86%) Kubernetes
4 10 (4.05%) Ansible
4 10 (4.05%) Microsoft Intune
5 4 (1.62%) Packer
6 2 (0.81%) Grafana
6 2 (0.81%) Prometheus
6 2 (0.81%) SCCM
7 1 (0.40%) Consul
7 1 (0.40%) Data Guard
7 1 (0.40%) EMC NetWorker
7 1 (0.40%) Netcool
7 1 (0.40%) Puppet
7 1 (0.40%) SCOM
7 1 (0.40%) Tivoli
7 1 (0.40%) Tivoli Storage Manager
Vendors
1 59 (23.89%) Microsoft
2 27 (10.93%) Oracle
3 26 (10.53%) Cisco
4 25 (10.12%) Palo Alto
5 19 (7.69%) Fortinet
6 18 (7.29%) CheckPoint
7 11 (4.45%) VMware
8 9 (3.64%) Salesforce
8 9 (3.64%) SAP
8 9 (3.64%) ServiceNow
9 8 (3.24%) Dynatrace
10 6 (2.43%) OutSystems
11 5 (2.02%) Databricks
12 3 (1.21%) Autodesk
12 3 (1.21%) Google
12 3 (1.21%) MuleSoft
13 2 (0.81%) Concur
13 2 (0.81%) CyberArk
13 2 (0.81%) IBM
13 2 (0.81%) Splunk