CRM Contracts with Hybrid/Remote/WFH Options

Customer Relationship Management (CRM)
UK > Work from Home

The table below provides summary statistics for remote or hybrid contract work requiring CRM skills. It includes a benchmarking guide to the contractor rates offered in vacancies that cited CRM over the 6 months leading up to 30 April 2025, comparing them to the same period in the previous two years.

6 months to
30 Apr 2025
Same period 2024 Same period 2023
Rank 98 91 125
Rank change year-on-year -7 +34 -9
Contract jobs citing CRM 252 369 502
As % of all contract jobs with a WFH option 2.54% 2.40% 1.94%
As % of the Processes & Methodologies category 2.79% 2.73% 2.16%
Number of daily rates quoted 163 260 365
10th Percentile £275 £384 £359
25th Percentile £400 £439 £425
Median daily rate (50th Percentile) £500 £500 £500
Median % change year-on-year - - -4.76%
75th Percentile £600 £600 £610
90th Percentile £688 £675 £725
UK median daily rate £500 £500 £525
% change year-on-year - -4.76% -
Number of hourly rates quoted 5 8 7
10th Percentile £16.18 £12.83 £12.50
25th Percentile £18.10 £13.25 £13.88
Median hourly rate £30.00 £18.61 £20.00
Median % change year-on-year +61.23% -6.96% +13.83%
75th Percentile £34.68 £36.09 £24.83
90th Percentile £73.00 £72.90 £42.00
UK median hourly rate £29.13 £13.75 £22.16
% change year-on-year +111.82% -37.95% +34.30%

All Process and Methodology Skills
Work from Home

CRM falls under the Processes and Methodologies category. For comparison with the information above, the following table provides summary statistics for all contract job vacancies with remote or hybrid options requiring process or methodology skills.

Contract vacancies with a requirement for process or methodology skills 9,023 13,505 23,232
As % of all contract jobs with a WFH option 91.03% 87.83% 89.84%
Number of daily rates quoted 6,195 9,015 16,421
10th Percentile £340 £325 £363
25th Percentile £419 £425 £450
Median daily rate (50th Percentile) £525 £525 £540
Median % change year-on-year - -2.78% +2.86%
75th Percentile £638 £638 £650
90th Percentile £763 £750 £750
UK median daily rate £521 £525 £550
% change year-on-year -0.86% -4.55% +4.76%
Number of hourly rates quoted 225 573 532
10th Percentile £14.20 £15.17 £19.00
25th Percentile £19.75 £24.25 £30.54
Median hourly rate £40.00 £42.50 £55.00
Median % change year-on-year -5.88% -22.73% +57.14%
75th Percentile £67.50 £60.00 £68.75
90th Percentile £75.00 £75.25 £80.23
UK median hourly rate £29.00 £35.50 £37.30
% change year-on-year -18.31% -4.83% +49.20%

CRM
Trend for Jobs with a WFH Option

Job vacancies with remote working options citing CRM as a proportion of all IT jobs advertised.
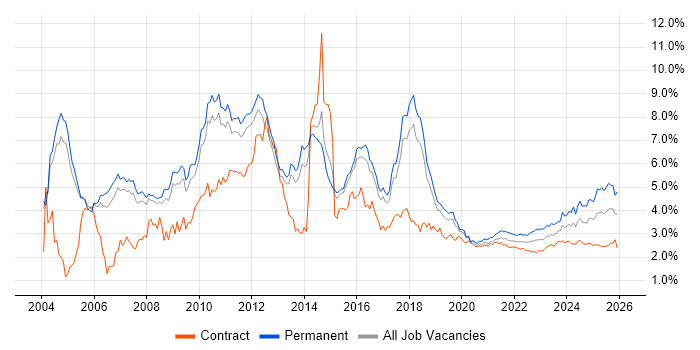
CRM trend for jobs with Hybrid/Remote/WFH options

CRM
Daily Rate Trend for Jobs with a WFH Option

3-month moving average daily rate quoted in job vacancies with remote working options citing CRM.

CRM daily rate for jobs with a WFH option

CRM
Daily Rate Histogram for Jobs with a WFH Option

Daily rate distribution for jobs with remote working options citing CRM over the 6 months to 30 April 2025.

CRM daily rate histogram for jobs with a WFH option

CRM
Hourly Rate Trend for Jobs with a WFH Option

3-month moving average hourly rate quoted in job vacancies with remote working options citing CRM.

CRM hourly rate for jobs with a WFH option

CRM
Hourly Rate Histogram for Jobs with a WFH Option

Hourly rate distribution for jobs with remote working options citing CRM over the 6 months to 30 April 2025.

CRM hourly rate histogram for jobs with a WFH option

CRM
Co-occurring Skills and Capabilities with WFH Options by Category

The follow tables expand on the table above by listing co-occurrences grouped by category. The same employment type, locality and period is covered with up to 20 co-occurrences shown in each of the following categories:

Application Platforms
1 13 (5.16%) CMS
2 5 (1.98%) SharePoint
3 4 (1.59%) Confluence
3 4 (1.59%) Oracle SOA Suite
3 4 (1.59%) WordPress
4 3 (1.19%) Drupal
5 2 (0.79%) IIS
5 2 (0.79%) NetWeaver
5 2 (0.79%) SAP EP
6 1 (0.40%) Camunda
6 1 (0.40%) Microsoft Exchange
6 1 (0.40%) Sitecore CMS
Applications
1 13 (5.16%) Microsoft Excel
2 6 (2.38%) Microsoft Office
3 5 (1.98%) Trello
4 3 (1.19%) Microsoft PowerPoint
4 3 (1.19%) Microsoft Project
5 1 (0.40%) Acrobat
5 1 (0.40%) Adobe After Effects
5 1 (0.40%) Adobe Illustrator
5 1 (0.40%) Chatbot
5 1 (0.40%) InfoPath
5 1 (0.40%) Photoshop
Business Applications
1 78 (30.95%) Dynamics CRM
2 11 (4.37%) Salesforce CRM
3 5 (1.98%) SAP CRM
4 4 (1.59%) SAP S/4HANA
5 3 (1.19%) NetSuite
6 2 (0.79%) CiviCRM
6 2 (0.79%) Oracle Payables
6 2 (0.79%) Payment Gateway
6 2 (0.79%) Siebel CRM
7 1 (0.40%) Eloqua
7 1 (0.40%) Raiser’s Edge
7 1 (0.40%) SAP CX
7 1 (0.40%) SAP FI
7 1 (0.40%) SAP Hybris
Cloud Services
1 60 (23.81%) Dynamics 365
2 41 (16.27%) Power Platform
3 37 (14.68%) Azure
4 25 (9.92%) PowerApps
5 23 (9.13%) Power Automate
6 13 (5.16%) SaaS
7 11 (4.37%) Microsoft 365
8 10 (3.97%) SAP Commerce Cloud
9 9 (3.57%) AWS
10 7 (2.78%) Salesforce Service Cloud
11 6 (2.38%) Azure DevOps
11 6 (2.38%) Figma
12 5 (1.98%) OCI
12 5 (1.98%) Oracle CX
12 5 (1.98%) Salesforce Sales Cloud
12 5 (1.98%) Serverless
13 4 (1.59%) Azure Functions
13 4 (1.59%) Azure Logic Apps
13 4 (1.59%) Entra ID
14 3 (1.19%) Azure Data Factory
Communications & Networking
1 4 (1.59%) 5G
2 3 (1.19%) DNS
3 1 (0.40%) 4G
3 1 (0.40%) Firewall
3 1 (0.40%) VoLTE
3 1 (0.40%) VoWiFi
3 1 (0.40%) VPN
Database & Business Intelligence
1 21 (8.33%) Power BI
2 18 (7.14%) SQL Server
3 12 (4.76%) SQL Server Integration Services
4 11 (4.37%) SQL Server Reporting Services
5 4 (1.59%) SAP HANA
6 3 (1.19%) Data Warehouse
6 3 (1.19%) Relational Database
7 2 (0.79%) MS Access
7 2 (0.79%) Oracle Database
8 1 (0.40%) Amazon Athena
8 1 (0.40%) Amazon Redshift
8 1 (0.40%) DynamoDB
8 1 (0.40%) Power Query
8 1 (0.40%) PowerPivot
8 1 (0.40%) RDBMS
8 1 (0.40%) SAP BW
8 1 (0.40%) SAP Data Services
8 1 (0.40%) Tableau
8 1 (0.40%) UniData
Development Applications
1 18 (7.14%) JIRA
2 3 (1.19%) Visual Studio Code
3 2 (0.79%) Postman
4 1 (0.40%) CircleCI
4 1 (0.40%) Git
4 1 (0.40%) SonarQube
4 1 (0.40%) Zephyr
General
1 83 (32.94%) Social Skills
2 54 (21.43%) Finance
3 43 (17.06%) Marketing
4 22 (8.73%) Analytical Skills
5 16 (6.35%) Banking
5 16 (6.35%) Public Sector
6 14 (5.56%) Billing
7 13 (5.16%) Inclusion and Diversity
8 11 (4.37%) Telecoms
9 6 (2.38%) Manufacturing
9 6 (2.38%) Organisational Skills
9 6 (2.38%) Presentation Skills
10 5 (1.98%) Influencing Skills
10 5 (1.98%) Publishing
10 5 (1.98%) Retail
11 4 (1.59%) Advertising
12 3 (1.19%) Automotive
12 3 (1.19%) Legal
13 2 (0.79%) Back Office
13 2 (0.79%) Documentation Skills
Job Titles
1 38 (15.08%) Developer
2 35 (13.89%) Analyst
3 24 (9.52%) Architect
4 20 (7.94%) Business Analyst
5 19 (7.54%) Consultant
6 18 (7.14%) Lead
7 17 (6.75%) Project Manager
8 14 (5.56%) CRM Analyst
8 14 (5.56%) Dynamics 365 Developer
9 11 (4.37%) CRM Developer
10 10 (3.97%) CRM Manager
10 10 (3.97%) Senior
11 8 (3.17%) CRM Architect
11 8 (3.17%) CRM Business Analyst
11 8 (3.17%) Designer
11 8 (3.17%) Salesforce Developer
11 8 (3.17%) Solutions Architect
12 7 (2.78%) CRM Consultant
12 7 (2.78%) Dynamics 365 Business Analyst
12 7 (2.78%) Programme Manager
Libraries, Frameworks & Software Standards
1 18 (7.14%) REST
2 14 (5.56%) .NET
3 13 (5.16%) Web Services
4 11 (4.37%) SOAP
5 10 (3.97%) CSS
6 9 (3.57%) Lightning Web Components
7 6 (2.38%) HTML
7 6 (2.38%) Middleware
8 5 (1.98%) JSON
9 4 (1.59%) Oracle Fusion
9 4 (1.59%) Visualforce
10 3 (1.19%) .NET Framework
10 3 (1.19%) Alpine.js
10 3 (1.19%) ASP.NET Web API
10 3 (1.19%) Bootstrap
10 3 (1.19%) HTML5 Canvas
10 3 (1.19%) Laravel
10 3 (1.19%) RESTful
10 3 (1.19%) Tailwind CSS
11 2 (0.79%) GraphQL
Miscellaneous
1 13 (5.16%) Onboarding
2 10 (3.97%) Legacy Systems
2 10 (3.97%) Product Ownership
3 8 (3.17%) Enterprise Software
4 6 (2.38%) Management Information System
4 6 (2.38%) Self-Motivation
5 5 (1.98%) Data Centre
5 5 (1.98%) Marketing Technology
5 5 (1.98%) Social Media
6 4 (1.59%) Frameworx
6 4 (1.59%) SWIFT Messaging Network
6 4 (1.59%) TM Forum
7 3 (1.19%) Animation
7 3 (1.19%) Cloud Native
7 3 (1.19%) Data Protection Act
7 3 (1.19%) Data Structures
8 2 (0.79%) FMCG
8 2 (0.79%) Low-Code
9 1 (0.40%) Team-Oriented Environment
9 1 (0.40%) Virtual Team
Operating Systems
1 8 (3.17%) Windows
2 6 (2.38%) Windows Server
3 3 (1.19%) Linux
4 1 (0.40%) Red Hat Enterprise Linux
4 1 (0.40%) Unix
Processes & Methodologies
1 49 (19.44%) Agile
2 40 (15.87%) Stakeholder Management
3 38 (15.08%) Problem-Solving
4 35 (13.89%) Project Management
5 32 (12.70%) Analytics
6 31 (12.30%) Migration
7 30 (11.90%) Business Intelligence
8 29 (11.51%) ERP
9 23 (9.13%) Decision-Making
10 22 (8.73%) Roadmaps
11 20 (7.94%) DevOps
12 19 (7.54%) Data Migration
13 18 (7.14%) Stakeholder Engagement
14 17 (6.75%) Data Analysis
14 17 (6.75%) Data Management
14 17 (6.75%) Digital Marketing
15 16 (6.35%) Customer Service
16 14 (5.56%) Change Management
17 13 (5.16%) E-Commerce
17 13 (5.16%) Risk Management
Programming Languages
1 36 (14.29%) SQL
2 27 (10.71%) C#
3 24 (9.52%) JavaScript
4 14 (5.56%) PowerShell
5 10 (3.97%) Java
6 9 (3.57%) Apex Code
7 7 (2.78%) Python
8 5 (1.98%) ABAP
9 3 (1.19%) PHP
10 2 (0.79%) TypeScript
11 1 (0.40%) Bash
11 1 (0.40%) C
11 1 (0.40%) PL/SQL
11 1 (0.40%) R
11 1 (0.40%) Rust
11 1 (0.40%) T-SQL
11 1 (0.40%) VBA
Qualifications
1 21 (8.33%) Degree
2 19 (7.54%) Security Cleared
3 10 (3.97%) BPSS Clearance
3 10 (3.97%) SC Cleared
4 7 (2.78%) PMP
5 6 (2.38%) Microsoft Certification
6 5 (1.98%) PMI Certification
7 4 (1.59%) Computer Science Degree
8 2 (0.79%) CISA
9 1 (0.40%) APMG
9 1 (0.40%) CSPO
9 1 (0.40%) CTC Cleared
9 1 (0.40%) IIBA
9 1 (0.40%) ISTQB
9 1 (0.40%) ITIL Certification
9 1 (0.40%) MCPD
9 1 (0.40%) MCSD
9 1 (0.40%) PRINCE2 Practitioner
9 1 (0.40%) Siebel Certification
9 1 (0.40%) TOGAF Certification
Quality Assurance & Compliance
1 10 (3.97%) QA
2 6 (2.38%) ISO/IEC 27001
3 5 (1.98%) PMO
3 5 (1.98%) SLA
4 4 (1.59%) GDPR
5 3 (1.19%) Accessibility
6 2 (0.79%) COBIT
6 2 (0.79%) Data Quality
7 1 (0.40%) PCI DSS
7 1 (0.40%) SOC 2
System Software
1 6 (2.38%) Active Directory
2 1 (0.40%) Docker
2 1 (0.40%) LXC
Systems Management
1 3 (1.19%) Amdocs OSS
2 2 (0.79%) Active Directory Federation Services
3 1 (0.40%) HP ALM
3 1 (0.40%) Kubernetes
3 1 (0.40%) Single Sign-On
Vendors
1 65 (25.79%) Microsoft
2 49 (19.44%) Salesforce
3 16 (6.35%) SAP
4 9 (3.57%) Oracle
4 9 (3.57%) ServiceNow
5 6 (2.38%) Google
5 6 (2.38%) HubSpot
6 3 (1.19%) Adobe
6 3 (1.19%) Amdocs
6 3 (1.19%) Ariba
6 3 (1.19%) Ciena
6 3 (1.19%) Ericsson
6 3 (1.19%) NetCracker
6 3 (1.19%) Nokia
6 3 (1.19%) Sage
6 3 (1.19%) Siebel
7 2 (0.79%) Genesys
8 1 (0.40%) Hitachi
8 1 (0.40%) HP
8 1 (0.40%) Red Hat