Virtual Machines Contracts with Hybrid/Remote/WFH Options

Virtual Machine (VM)
UK > Work from Home

The table below provides summary statistics for remote or hybrid contract work requiring Virtual Machines skills. It includes a benchmarking guide to the contractor rates offered in vacancies that cited Virtual Machines over the 6 months leading up to 1 May 2025, comparing them to the same period in the previous two years.

6 months to
1 May 2025
Same period 2024 Same period 2023
Rank 231 242 264
Rank change year-on-year +11 +22 +81
Contract jobs citing Virtual Machines 73 103 224
As % of all contract jobs with a WFH option 0.74% 0.67% 0.87%
As % of the System Software category 6.24% 7.09% 6.98%
Number of daily rates quoted 48 78 145
10th Percentile £394 £289 £400
25th Percentile £456 £365 £500
Median daily rate (50th Percentile) £506 £500 £545
Median % change year-on-year +1.25% -8.26% +3.81%
75th Percentile £638 £608 £587
90th Percentile £750 - £615
UK median daily rate £513 £507 £540
% change year-on-year +1.18% -6.20% +2.86%
Number of hourly rates quoted 5 2 13
10th Percentile £33.98 £84.20 £21.97
25th Percentile £61.50 £85.16 £65.00
Median hourly rate £63.00 £86.78 £66.00
Median % change year-on-year -27.40% +31.48% -21.43%
75th Percentile £66.00 £88.39 £70.25
90th Percentile - £89.36 £74.30
UK median hourly rate £63.00 £14.63 £66.00
% change year-on-year +330.77% -77.84% +38.28%

All System Software Skills
Work from Home

Virtual Machines falls under the System Software category. For comparison with the information above, the following table provides summary statistics for all contract job vacancies with remote or hybrid options requiring system software skills.

Contract vacancies with a requirement for system software skills 1,169 1,452 3,207
As % of all contract jobs with a WFH option 11.80% 9.46% 12.40%
Number of daily rates quoted 868 1,058 2,296
10th Percentile £358 £263 £300
25th Percentile £425 £405 £425
Median daily rate (50th Percentile) £534 £505 £525
Median % change year-on-year +5.68% -3.84% -
75th Percentile £625 £618 £633
90th Percentile £775 £677 £725
UK median daily rate £525 £488 £525
% change year-on-year +7.69% -7.14% -
Number of hourly rates quoted 12 34 101
10th Percentile £25.25 £15.50 £19.00
25th Percentile £52.44 £15.88 £47.50
Median hourly rate £65.50 £43.32 £65.00
Median % change year-on-year +51.20% -33.35% +165.31%
75th Percentile £79.38 £65.00 £70.25
90th Percentile £92.50 £84.57 £78.00
UK median hourly rate £27.50 £22.50 £53.43
% change year-on-year +22.22% -57.88% +167.13%

Virtual Machines
Trend for Jobs with a WFH Option

Job vacancies with remote working options citing Virtual Machines as a proportion of all IT jobs advertised.
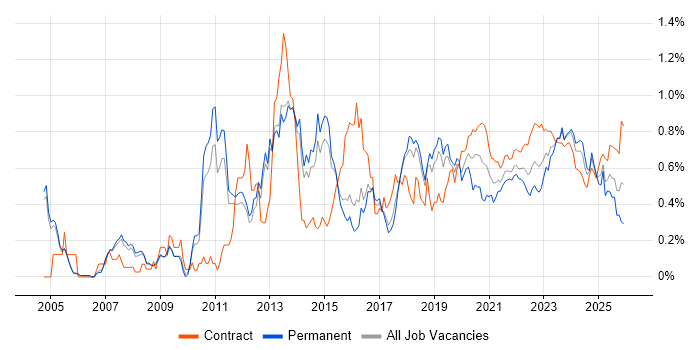
Virtual Machines trend for jobs with Hybrid/Remote/WFH options

Virtual Machines
Daily Rate Trend for Jobs with a WFH Option

3-month moving average daily rate quoted in job vacancies with remote working options citing Virtual Machines.

Virtual Machines daily rate for jobs with a WFH option

Virtual Machines
Daily Rate Histogram for Jobs with a WFH Option

Daily rate distribution for jobs with remote working options citing Virtual Machines over the 6 months to 1 May 2025.

Virtual Machines daily rate histogram for jobs with a WFH option

Virtual Machines
Hourly Rate Trend for Jobs with a WFH Option

3-month moving average hourly rate quoted in job vacancies with remote working options citing Virtual Machines.

Virtual Machines hourly rate for jobs with a WFH option

Virtual Machines
Hourly Rate Histogram for Jobs with a WFH Option

Hourly rate distribution for jobs with remote working options citing Virtual Machines over the 6 months to 1 May 2025.

Virtual Machines hourly rate histogram for jobs with a WFH option

Virtual Machines
Co-occurring Skills and Capabilities with WFH Options by Category

The follow tables expand on the table above by listing co-occurrences grouped by category. The same employment type, locality and period is covered with up to 20 co-occurrences shown in each of the following categories:

Application Platforms
1 6 (8.22%) WebSphere
2 3 (4.11%) Apache Spark
2 3 (4.11%) Microsoft Exchange
3 2 (2.74%) Confluence
3 2 (2.74%) SharePoint
4 1 (1.37%) Apache
4 1 (1.37%) Apache Airflow
4 1 (1.37%) Blackberry Enterprise Server
4 1 (1.37%) Exchange Server 2013
4 1 (1.37%) IIS
4 1 (1.37%) Skype for Business
Applications
1 1 (1.37%) AutoCAD
1 1 (1.37%) Microsoft Office
1 1 (1.37%) Microsoft Project
1 1 (1.37%) Notion
1 1 (1.37%) Trello
Business Applications
1 1 (1.37%) SAP IBP
1 1 (1.37%) SAP S/4HANA
Cloud Services
1 30 (41.10%) Azure
2 12 (16.44%) AWS
3 11 (15.07%) Entra ID
4 10 (13.70%) GCP
5 9 (12.33%) Azure DevOps
5 9 (12.33%) Microsoft 365
6 8 (10.96%) Azure Monitor
7 7 (9.59%) Serverless
8 6 (8.22%) PaaS
8 6 (8.22%) SaaS
9 5 (6.85%) Azure AKS
9 5 (6.85%) Azure Sentinel
9 5 (6.85%) IaaS
10 4 (5.48%) Azure Functions
10 4 (5.48%) Azure Logic Apps
11 3 (4.11%) Amazon S3
11 3 (4.11%) Azure Event Grid
11 3 (4.11%) Azure ExpressRoute
11 3 (4.11%) Azure Storage
11 3 (4.11%) Cloud Computing
Communications & Networking
1 17 (23.29%) Firewall
2 9 (12.33%) Network Security
2 9 (12.33%) VPN
3 5 (6.85%) Intrusion Detection
4 4 (5.48%) DHCP
4 4 (5.48%) DNS
5 2 (2.74%) SNA
5 2 (2.74%) TCP/IP
5 2 (2.74%) WAN
6 1 (1.37%) Cisco IOS
6 1 (1.37%) IMAP
6 1 (1.37%) IPsec
6 1 (1.37%) NGFW
6 1 (1.37%) NX-OS
6 1 (1.37%) SAN
6 1 (1.37%) Skype
6 1 (1.37%) SMTP
6 1 (1.37%) VLAN
6 1 (1.37%) VRRP
6 1 (1.37%) Wi-Fi
Database & Business Intelligence
1 7 (9.59%) Azure SQL Database
2 6 (8.22%) DB2
3 2 (2.74%) Hadoop
3 2 (2.74%) SQL Server
4 1 (1.37%) Amazon RDS
4 1 (1.37%) Big Data
4 1 (1.37%) Data Lake
4 1 (1.37%) InfluxDB
4 1 (1.37%) MongoDB
4 1 (1.37%) Oracle Database
4 1 (1.37%) PostgreSQL
4 1 (1.37%) Power BI
4 1 (1.37%) RDBMS
4 1 (1.37%) Relational Database
4 1 (1.37%) Spatial Data
4 1 (1.37%) Tableau
Development Applications
1 3 (4.11%) JIRA
2 2 (2.74%) GitLab
3 1 (1.37%) Git
3 1 (1.37%) Jenkins
General
1 14 (19.18%) Finance
2 13 (17.81%) Social Skills
3 7 (9.59%) Analytical Skills
4 5 (6.85%) Banking
5 3 (4.11%) Financial Institution
6 2 (2.74%) Documentation Skills
6 2 (2.74%) Law
6 2 (2.74%) Public Sector
7 1 (1.37%) Dutch Language
7 1 (1.37%) French Language
7 1 (1.37%) Retail
7 1 (1.37%) Retail Banking
Job Titles
1 23 (31.51%) Architect
2 14 (19.18%) Solutions Architect
3 9 (12.33%) Technical Architect
4 7 (9.59%) Automation Engineer
4 7 (9.59%) Cloud Architect
4 7 (9.59%) Operations Engineer
4 7 (9.59%) Security Engineer
4 7 (9.59%) Technical Solutions Architect
5 6 (8.22%) Azure Architect
6 5 (6.85%) Azure Engineer
6 5 (6.85%) Senior
7 4 (5.48%) Cloud Infrastructure Architect
7 4 (5.48%) Information Architect
7 4 (5.48%) Information Systems Architect
7 4 (5.48%) Systems Architect
8 3 (4.11%) Analyst
8 3 (4.11%) Consultant
8 3 (4.11%) DevOps Engineer
8 3 (4.11%) Information Analyst
8 3 (4.11%) Senior Architect
Libraries, Frameworks & Software Standards
1 6 (8.22%) ARM Templates
2 3 (4.11%) Azure Blueprints
3 2 (2.74%) Middleware
4 1 (1.37%) Keycloak
4 1 (1.37%) Node.js
4 1 (1.37%) React
4 1 (1.37%) REST
4 1 (1.37%) STL
Miscellaneous
1 7 (9.59%) Data Centre
2 6 (8.22%) Cyber Threat
2 6 (8.22%) Mainframe
2 6 (8.22%) Management Information System
3 5 (6.85%) Private Cloud
3 5 (6.85%) Product Ownership
4 4 (5.48%) Hybrid Cloud
4 4 (5.48%) Linux Command Line
4 4 (5.48%) Replication
5 3 (4.11%) Reinsurance
6 2 (2.74%) Cloud Native
7 1 (1.37%) Algorithms
7 1 (1.37%) Blackberry
7 1 (1.37%) Data Structures
7 1 (1.37%) Driving Licence
7 1 (1.37%) Enterprise Cloud
7 1 (1.37%) Greenfield Project
7 1 (1.37%) Low-Code
7 1 (1.37%) Operational Technology
7 1 (1.37%) Self-Motivation
Operating Systems
1 13 (17.81%) Windows
2 9 (12.33%) Linux
2 9 (12.33%) Windows Server
3 4 (5.48%) Unix
4 3 (4.11%) Red Hat Enterprise Linux
5 2 (2.74%) VMS
5 2 (2.74%) Windows 10
5 2 (2.74%) Windows 7
5 2 (2.74%) Windows Server 2019
5 2 (2.74%) Windows XP
5 2 (2.74%) zOS
6 1 (1.37%) AIX
6 1 (1.37%) Data ONTAP
6 1 (1.37%) Windows Server 2012
6 1 (1.37%) Windows Server 2016
Processes & Methodologies
1 24 (32.88%) DevOps
2 18 (24.66%) Migration
3 14 (19.18%) Problem-Solving
4 13 (17.81%) Agile
4 13 (17.81%) Cloud Security
5 12 (16.44%) CI/CD
5 12 (16.44%) High Availability
6 11 (15.07%) Incident Response
7 10 (13.70%) Infrastructure as Code
8 9 (12.33%) Disaster Recovery
9 8 (10.96%) Project Management
10 7 (9.59%) Data Protection
10 7 (9.59%) Hyperautomation
10 7 (9.59%) Roadmaps
10 7 (9.59%) Security Operations
10 7 (9.59%) SIEM
10 7 (9.59%) SOAR
10 7 (9.59%) Workflow
11 6 (8.22%) Containerisation
11 6 (8.22%) Identity Access Management
Programming Languages
1 15 (20.55%) PowerShell
1 15 (20.55%) SQL
2 7 (9.59%) Bicep
2 7 (9.59%) Python
3 5 (6.85%) Bash
4 2 (2.74%) JCL
5 1 (1.37%) C#
5 1 (1.37%) Java
5 1 (1.37%) Perl
5 1 (1.37%) PL/SQL
5 1 (1.37%) Shell Script
5 1 (1.37%) VB
5 1 (1.37%) VBScript
Qualifications
1 19 (26.03%) Security Cleared
2 13 (17.81%) SC Cleared
3 4 (5.48%) Azure Certification
4 3 (4.11%) Degree
4 3 (4.11%) DV Cleared
5 2 (2.74%) Microsoft Certification
6 1 (1.37%) AWS Certification
6 1 (1.37%) CCIE
6 1 (1.37%) CCNA
6 1 (1.37%) CCNP
6 1 (1.37%) CFA
6 1 (1.37%) Cisco Certification
6 1 (1.37%) Computer Science Degree
6 1 (1.37%) ITIL Foundation Certificate
6 1 (1.37%) Master's Degree
6 1 (1.37%) MCSA
6 1 (1.37%) MCSE
Quality Assurance & Compliance
1 6 (8.22%) GDPR
2 3 (4.11%) SOC 2
3 2 (2.74%) GRC
3 2 (2.74%) ISO/IEC 27001
3 2 (2.74%) NIST
4 1 (1.37%) Basel III
4 1 (1.37%) Cyber Essentials
4 1 (1.37%) Cyber Essentials PLUS
4 1 (1.37%) Data Quality
4 1 (1.37%) Disclosure Scotland
4 1 (1.37%) HIPAA
4 1 (1.37%) PCI DSS
System Software
1 19 (26.03%) Active Directory
2 11 (15.07%) VMware Infrastructure
3 8 (10.96%) Hyper-V
4 5 (6.85%) Docker
5 2 (2.74%) Virtual Desktop
6 1 (1.37%) Firmware
6 1 (1.37%) KVM
6 1 (1.37%) VMware NSX
6 1 (1.37%) vSphere
Systems Management
1 14 (19.18%) Terraform
2 9 (12.33%) Kubernetes
3 6 (8.22%) Microsoft Intune
4 5 (6.85%) Ansible
5 4 (5.48%) SCCM
6 3 (4.11%) SCOM
7 2 (2.74%) Tivoli NetView
7 2 (2.74%) WSUS
8 1 (1.37%) Active Directory Federation Services
8 1 (1.37%) CASB
8 1 (1.37%) Data Guard
8 1 (1.37%) Grafana
8 1 (1.37%) HAProxy
8 1 (1.37%) Nagios
8 1 (1.37%) PowerCLI
8 1 (1.37%) Red Hat Satellite
8 1 (1.37%) vRealize
8 1 (1.37%) vRealize Orchestrator
Vendors
1 27 (36.99%) Microsoft
2 13 (17.81%) VMware
3 10 (13.70%) Palo Alto
4 9 (12.33%) Google
5 6 (8.22%) IBM
6 5 (6.85%) Fortinet
6 5 (6.85%) Oracle
7 4 (5.48%) Veeam
8 2 (2.74%) Dynatrace
8 2 (2.74%) NetApp
8 2 (2.74%) ServiceNow
9 1 (1.37%) Calypso
9 1 (1.37%) Cisco
9 1 (1.37%) Commvault
9 1 (1.37%) CrowdStrike
9 1 (1.37%) Intel
9 1 (1.37%) McAfee
9 1 (1.37%) Murex
9 1 (1.37%) Red Hat
9 1 (1.37%) Symantec