.NET Contracts with Hybrid/Remote/WFH Options

Microsoft .NET (dotNet)
UK > Work from Home

The table below provides summary statistics for remote or hybrid contract work requiring .NET skills. It includes a benchmarking guide to the contractor rates offered in vacancies that cited .NET over the 6 months leading up to 1 May 2025, comparing them to the same period in the previous two years.

6 months to
1 May 2025
Same period 2024 Same period 2023
Rank 68 46 39
Rank change year-on-year -22 -7 -13
Contract jobs citing .NET 343 601 1,410
As % of all contract jobs with a WFH option 3.46% 3.92% 5.45%
As % of the Libraries, Frameworks & Software Standards category 13.38% 16.40% 21.63%
Number of daily rates quoted 279 462 1,106
10th Percentile £356 £313 £375
25th Percentile £431 £406 £425
Median daily rate (50th Percentile) £525 £500 £550
Median % change year-on-year +5.00% -9.09% +10.00%
75th Percentile £775 £625 £695
90th Percentile £850 £700 £788
UK median daily rate £525 £525 £565
% change year-on-year - -7.08% +6.60%
Number of hourly rates quoted 1 6 11
10th Percentile - - £22.50
25th Percentile £55.00 £20.77 £40.50
Median hourly rate £60.00 £41.64 £65.00
Median % change year-on-year +44.11% -35.95% +39.28%
75th Percentile £65.00 £63.75 £85.00
90th Percentile - £64.38 -
UK median hourly rate £27.00 £58.91 £60.00
% change year-on-year -54.16% -1.83% +26.09%

All Software Libraries and Frameworks
Work from Home

.NET falls under the Software Libraries and Frameworks category. For comparison with the information above, the following table provides summary statistics for all contract job vacancies with remote or hybrid options requiring technical specification, industry standards, software libraries and framework skills.

Contract vacancies with a requirement for technical specification, industry standards, software libraries and framework skills 2,564 3,665 6,520
As % of all contract jobs with a WFH option 25.89% 23.88% 25.22%
Number of daily rates quoted 1,870 2,555 4,857
10th Percentile £365 £331 £395
25th Percentile £425 £428 £450
Median daily rate (50th Percentile) £525 £525 £540
Median % change year-on-year - -2.78% -0.46%
75th Percentile £650 £650 £663
90th Percentile £825 £775 £753
UK median daily rate £525 £530 £550
% change year-on-year -0.94% -3.64% -
Number of hourly rates quoted 31 93 80
10th Percentile £52.50 £28.00 £22.50
25th Percentile £61.25 - £42.13
Median hourly rate £65.00 £43.00 £63.25
Median % change year-on-year +51.16% -32.02% +29.08%
75th Percentile £70.25 £62.00 £75.00
90th Percentile £93.75 £72.50 £80.25
UK median hourly rate £65.00 £46.18 £65.00
% change year-on-year +40.75% -28.95% +32.65%

.NET
Trend for Jobs with a WFH Option

Job vacancies with remote working options citing .NET as a proportion of all IT jobs advertised.
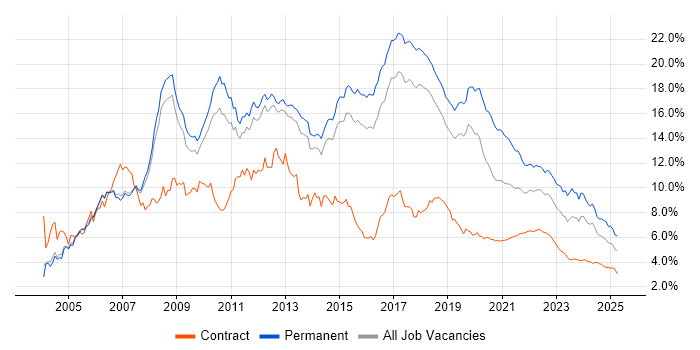
.NET trend for jobs with Hybrid/Remote/WFH options

.NET
Daily Rate Trend for Jobs with a WFH Option

3-month moving average daily rate quoted in job vacancies with remote working options citing .NET.

.NET daily rate for jobs with a WFH option

.NET
Daily Rate Histogram for Jobs with a WFH Option

Daily rate distribution for jobs with remote working options citing .NET over the 6 months to 1 May 2025.

.NET daily rate histogram for jobs with a WFH option

.NET
Hourly Rate Trend for Jobs with a WFH Option

3-month moving average hourly rate quoted in job vacancies with remote working options citing .NET.

.NET hourly rate for jobs with a WFH option

.NET
Co-occurring Skills and Capabilities with WFH Options by Category

The follow tables expand on the table above by listing co-occurrences grouped by category. The same employment type, locality and period is covered with up to 20 co-occurrences shown in each of the following categories:

Application Platforms
1 8 (2.33%) GemFire
1 8 (2.33%) Oracle Coherence
1 8 (2.33%) SharePoint
2 6 (1.75%) Umbraco
3 4 (1.17%) IIS
3 4 (1.17%) Microsoft Exchange
4 3 (0.87%) BizTalk Server
5 2 (0.58%) CMS
6 1 (0.29%) Anypoint
6 1 (0.29%) ArcGIS
6 1 (0.29%) Headless CMS
6 1 (0.29%) Oracle SOA Suite
6 1 (0.29%) Tomcat
Applications
1 4 (1.17%) Microsoft Excel
2 1 (0.29%) InfoPath
2 1 (0.29%) Microsoft Office
2 1 (0.29%) MS Visio
2 1 (0.29%) Trello
Business Applications
1 11 (3.21%) Dynamics CRM
2 2 (0.58%) Aladdin
2 2 (0.58%) Endur
2 2 (0.58%) Workday HCM
3 1 (0.29%) Fidessa
3 1 (0.29%) NEC Housing
3 1 (0.29%) NetSuite
3 1 (0.29%) SAP S/4HANA
Cloud Services
1 166 (48.40%) Azure
2 67 (19.53%) AWS
2 67 (19.53%) Azure DevOps
3 28 (8.16%) Serverless
4 21 (6.12%) Dynamics 365
4 21 (6.12%) Power Platform
5 19 (5.54%) Azure Functions
5 19 (5.54%) GCP
6 17 (4.96%) Azure Service Bus
7 16 (4.66%) Entra ID
8 15 (4.37%) GitHub
9 14 (4.08%) SaaS
10 11 (3.21%) Azure Cosmos DB
10 11 (3.21%) Azure Logic Apps
11 10 (2.92%) PowerApps
12 9 (2.62%) Azure AKS
12 9 (2.62%) Azure API Management
12 9 (2.62%) Azure Monitor
13 8 (2.33%) Azure Event Grid
13 8 (2.33%) Azure Sentinel
Communications & Networking
1 10 (2.92%) HTTP
2 8 (2.33%) Firewall
3 7 (2.04%) DNS
4 6 (1.75%) SSL
5 5 (1.46%) FTP
6 4 (1.17%) Network Security
6 4 (1.17%) SMTP
6 4 (1.17%) TCP/IP
7 3 (0.87%) Kerberos
7 3 (0.87%) Skype
Database & Business Intelligence
1 61 (17.78%) SQL Server
2 25 (7.29%) Relational Database
3 18 (5.25%) MongoDB
4 17 (4.96%) PostgreSQL
5 15 (4.37%) NoSQL
6 11 (3.21%) MySQL
7 10 (2.92%) Azure SQL Database
8 8 (2.33%) SQL Server Reporting Services
9 7 (2.04%) Redis
10 6 (1.75%) Power BI
11 5 (1.46%) SQL Server Integration Services
12 4 (1.17%) DynamoDB
13 3 (0.87%) Data Warehouse
13 3 (0.87%) Geospatial Data
13 3 (0.87%) Oracle Database
14 2 (0.58%) Azure SQL Data Warehouse
14 2 (0.58%) BigQuery
14 2 (0.58%) GIS
14 2 (0.58%) InterSystems Cache
14 2 (0.58%) ObjectStore
Development Applications
1 38 (11.08%) Git
2 32 (9.33%) Jenkins
2 32 (9.33%) JIRA
3 14 (4.08%) Visual Studio
4 11 (3.21%) NUnit
5 10 (2.92%) Selenium
6 9 (2.62%) Cypress.io
6 9 (2.62%) Postman
7 8 (2.33%) Subversion
8 7 (2.04%) Team Foundation Server
8 7 (2.04%) Visual Studio Code
9 5 (1.46%) Ant
9 5 (1.46%) Maven
9 5 (1.46%) TeamCity
10 4 (1.17%) Bitbucket
10 4 (1.17%) HP UFT
10 4 (1.17%) TestComplete
11 3 (0.87%) Cucumber
11 3 (0.87%) GitLab
11 3 (0.87%) MSTest
General
1 106 (30.90%) Social Skills
2 77 (22.45%) Finance
3 70 (20.41%) Analytical Skills
4 44 (12.83%) Banking
5 43 (12.54%) Public Sector
6 33 (9.62%) Front Office
7 25 (7.29%) Investment Banking
8 18 (5.25%) Organisational Skills
9 8 (2.33%) Inclusion and Diversity
10 7 (2.04%) Back Office
11 6 (1.75%) Marketing
11 6 (1.75%) Retail
12 5 (1.46%) Electronics
12 5 (1.46%) Manufacturing
12 5 (1.46%) Telecoms
12 5 (1.46%) Wholesale Banking
13 4 (1.17%) French Language
13 4 (1.17%) Legal
14 3 (0.87%) Law
14 3 (0.87%) Presentation Skills
Job Titles
1 228 (66.47%) Developer
2 96 (27.99%) .NET Developer
3 74 (21.57%) C# Developer
4 42 (12.24%) Senior
5 39 (11.37%) C# .NET Developer
6 29 (8.45%) Python Developer
7 28 (8.16%) Lead
8 27 (7.87%) Senior Developer
9 25 (7.29%) Full-Stack Developer
10 24 (7.00%) Software Engineer
11 20 (5.83%) Artificial Intelligence Developer
11 20 (5.83%) Gen AI Developer
12 18 (5.25%) Architect
12 18 (5.25%) C++ Developer
12 18 (5.25%) C++/C# Developer
13 15 (4.37%) C# Developer - Electronic Trading
13 15 (4.37%) Electronic Trading Developer
13 15 (4.37%) Lead Developer
13 15 (4.37%) Real Time Developer
13 15 (4.37%) Senior .NET Developer
Libraries, Frameworks & Software Standards
1 83 (24.20%) .NET Core
2 71 (20.70%) AngularJS
3 62 (18.08%) React
4 60 (17.49%) ASP.NET
5 50 (14.58%) .NET Framework
6 37 (10.79%) HTML
7 34 (9.91%) CSS
8 32 (9.33%) RESTful
9 31 (9.04%) WCF
9 31 (9.04%) Web Services
10 27 (7.87%) Kafka
11 23 (6.71%) FastAPI
12 21 (6.12%) Django
12 21 (6.12%) REST
13 20 (5.83%) Entity Framework
13 20 (5.83%) Reactive Extensions
14 16 (4.66%) ASP.NET Web API
15 12 (3.50%) Node.js
16 11 (3.21%) OAuth
16 11 (3.21%) Vue
Miscellaneous
1 30 (8.75%) Product Ownership
2 23 (6.71%) Legacy Applications
3 22 (6.41%) Enterprise Software
4 21 (6.12%) Foreign Exchange (FX)
5 16 (4.66%) Cloud Native
6 8 (2.33%) Fixed Income
6 8 (2.33%) Legacy Systems
7 6 (1.75%) Derivative
7 6 (1.75%) Equities
7 6 (1.75%) Mobile App
7 6 (1.75%) Onboarding
8 5 (1.46%) Distributed Systems
8 5 (1.46%) Equity Derivative
9 4 (1.17%) NHS
9 4 (1.17%) Replication
9 4 (1.17%) Self-Motivation
9 4 (1.17%) Wiki
10 3 (0.87%) Data Centre
10 3 (0.87%) Data Protection Act
10 3 (0.87%) Data Structures
Operating Systems
1 25 (7.29%) Windows
2 12 (3.50%) Unix
3 10 (2.92%) Linux
4 7 (2.04%) Windows Server
5 2 (0.58%) AIX
6 1 (0.29%) Android
6 1 (0.29%) Apple iOS
6 1 (0.29%) Red Hat Enterprise Linux
6 1 (0.29%) Solaris
Processes & Methodologies
1 160 (46.65%) Agile
2 154 (44.90%) DevOps
3 99 (28.86%) CI/CD
4 59 (17.20%) Software Engineering
5 55 (16.03%) Full-Stack Development
6 54 (15.74%) Microservices
7 52 (15.16%) Continuous Improvement
8 49 (14.29%) Problem-Solving
9 45 (13.12%) OO
10 40 (11.66%) Design Patterns
10 40 (11.66%) Test Automation
11 36 (10.50%) SDLC
11 36 (10.50%) TDD
12 35 (10.20%) Containerisation
13 27 (7.87%) Artificial Intelligence
13 27 (7.87%) Use Case
14 25 (7.29%) Analytics
14 25 (7.29%) Scrum
15 24 (7.00%) Generative AI
16 23 (6.71%) Machine Learning
Programming Languages
1 248 (72.30%) C#
2 134 (39.07%) SQL
3 93 (27.11%) JavaScript
4 73 (21.28%) Java
5 64 (18.66%) Python
6 61 (17.78%) TypeScript
7 41 (11.95%) PowerShell
8 31 (9.04%) C++
9 12 (3.50%) T-SQL
10 7 (2.04%) Bicep
11 6 (1.75%) F#
12 5 (1.46%) PL/SQL
13 4 (1.17%) PHP
14 3 (0.87%) Kusto Query Language
14 3 (0.87%) Ruby
14 3 (0.87%) VB
14 3 (0.87%) VBScript
15 2 (0.58%) Shell Script
15 2 (0.58%) VBA
15 2 (0.58%) X++
Qualifications
1 34 (9.91%) Security Cleared
2 27 (7.87%) SC Cleared
3 22 (6.41%) Degree
4 8 (2.33%) Numerate Degree
5 5 (1.46%) Azure Certification
6 4 (1.17%) Computer Science Degree
6 4 (1.17%) Microsoft Certification
7 3 (0.87%) AWS Certification
7 3 (0.87%) BPSS Clearance
8 2 (0.58%) ISEB
8 2 (0.58%) ISTQB
8 2 (0.58%) ISTQB Foundation Certification
8 2 (0.58%) TOGAF Certification
9 1 (0.29%) CEH
9 1 (0.29%) Cisco Certification
9 1 (0.29%) CISSP
9 1 (0.29%) ITIL Certification
9 1 (0.29%) MCPD
9 1 (0.29%) OCP
9 1 (0.29%) Oracle Certification
Quality Assurance & Compliance
1 16 (4.66%) Accessibility
2 13 (3.79%) QA
3 5 (1.46%) PCI DSS
4 2 (0.58%) GDPR
4 2 (0.58%) Government Security Classifications
4 2 (0.58%) HL7
5 1 (0.29%) EMIR
5 1 (0.29%) HIPAA
5 1 (0.29%) MiFID
5 1 (0.29%) WCAG
System Software
1 58 (16.91%) Docker
2 15 (4.37%) Active Directory
3 8 (2.33%) GridGain
Systems Management
1 72 (20.99%) Kubernetes
2 28 (8.16%) Terraform
3 24 (7.00%) Ansible
4 3 (0.87%) Grafana
4 3 (0.87%) Microsoft Intune
4 3 (0.87%) Progress Chef
4 3 (0.87%) Puppet
5 1 (0.29%) CA Wily
5 1 (0.29%) MIIS
5 1 (0.29%) Prometheus
5 1 (0.29%) QRadar
5 1 (0.29%) SCOM
Vendors
1 71 (20.70%) Microsoft
2 58 (16.91%) Oracle
3 11 (3.21%) Google
4 7 (2.04%) SAP
5 6 (1.75%) ServiceNow
5 6 (1.75%) Splunk
6 5 (1.46%) Bloomberg
6 5 (1.46%) Reuters
7 4 (1.17%) CyberArk
7 4 (1.17%) IBM
8 3 (0.87%) AppDynamics
8 3 (0.87%) BeyondTrust
8 3 (0.87%) UiPath
9 2 (0.58%) Databricks
9 2 (0.58%) Mapbox
9 2 (0.58%) MuleSoft
9 2 (0.58%) New Relic
9 2 (0.58%) Solace
9 2 (0.58%) Workday
9 2 (0.58%) Zscaler