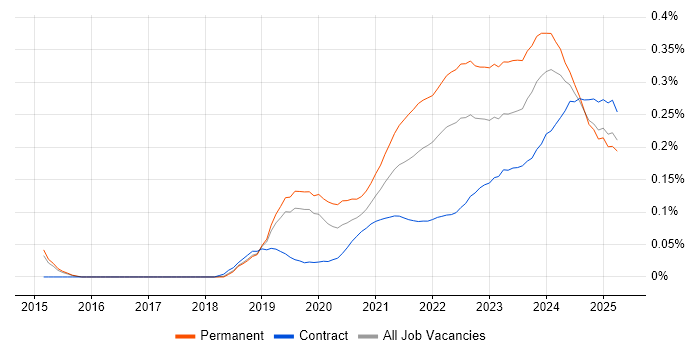
Low-Code Jobs with Work from Home Options

Low-Code
UK > Work from Home

The table below looks at the prevalence of the term Low-Code in remote or hybrid work. Included is a benchmarking guide to the salaries offered in vacancies that cited Low-Code over the 6 months leading up to 26 July 2024, comparing them to the same period in the previous two years.

6 months to
26 Jul 2024
Same period 2023 Same period 2022
Rank 413 477 642
Rank change year-on-year +64 +165 -121
Permanent jobs citing Low-Code 121 102 278
As % of all permanent jobs with a WFH option 0.43% 0.31% 0.35%
As % of the Miscellaneous category 1.26% 0.80% 0.76%
Number of salaries quoted 91 78 166
10th Percentile £34,395 £37,125 £36,144
25th Percentile £42,500 £52,000 £42,500
Median annual salary (50th Percentile) £57,500 £63,089 £55,000
Median % change year-on-year -8.86% +14.71% -10.20%
75th Percentile £68,750 £90,000 £65,569
90th Percentile £101,250 £92,875 £91,875
UK median annual salary £60,000 £70,000 £55,000
% change year-on-year -14.29% +27.27% -8.33%

All Generic Skills
Work from Home

Low-Code falls under the General and Transferable Skills category. For comparison with the information above, the following table provides summary statistics for all permanent job vacancies with remote or hybrid options requiring generic IT skills.

Permanent vacancies with a requirement for generic IT skills 9,605 12,729 36,632
As % of all permanent jobs with a WFH option 34.38% 38.79% 46.65%
Number of salaries quoted 6,855 9,924 18,426
10th Percentile £33,500 £40,000 £37,500
25th Percentile £45,000 £50,000 £47,500
Median annual salary (50th Percentile) £60,000 £65,000 £65,000
Median % change year-on-year -7.69% - +8.33%
75th Percentile £83,750 £85,000 £85,000
90th Percentile £117,500 £107,500 £100,000
UK median annual salary £55,000 £64,000 £62,500
% change year-on-year -14.06% +2.40% +4.17%

Low-Code
Trend for Jobs with a WFH Option

Job vacancies with a work from home option citing Low-Code as a proportion of all IT jobs advertised.

Low-Code trend for jobs with a WFH option

Low-Code
Salary Trend for Jobs with a WFH Option

3-month moving average salary quoted in job vacancies with a work from home option citing Low-Code.

Low-Code salary trend for jobs with a WFH option

Low-Code
Salary Histogram for Jobs with a WFH Option

Salary distribution for jobs with a work from home option citing Low-Code over the 6 months to 26 July 2024.

Low-Code salary histogram for jobs with a WFH option

Low-Code
Co-occurring Skills and Capabilities with WFH Options by Category

The follow tables expand on the table above by listing co-occurrences grouped by category. The same employment type, locality and period is covered with up to 20 co-occurrences shown in each of the following categories:

Application Platforms
1 33 (27.27%) SharePoint
2 12 (9.92%) Appian
3 1 (0.83%) CMS
Applications
1 6 (4.96%) Microsoft Office
2 4 (3.31%) Microsoft Excel
3 3 (2.48%) Spreadsheet
4 1 (0.83%) Solid Edge
Business Applications
1 8 (6.61%) Dynamics NAV
2 7 (5.79%) Dynamics CRM
Cloud Services
1 62 (51.24%) Power Platform
2 58 (47.93%) Azure
3 36 (29.75%) PowerApps
4 34 (28.10%) Power Automate
5 23 (19.01%) Dynamics 365
6 22 (18.18%) Microsoft 365
7 15 (12.40%) Azure Functions
7 15 (12.40%) Serverless
8 10 (8.26%) Azure DevOps
8 10 (8.26%) SaaS
8 10 (8.26%) ShareGate
9 6 (4.96%) Azure Logic Apps
10 5 (4.13%) Azure Service Bus
10 5 (4.13%) Azure Stack
10 5 (4.13%) Azure WebJobs
10 5 (4.13%) Entra ID
11 3 (2.48%) AWS
11 3 (2.48%) WhatsApp
12 2 (1.65%) MailChimp
12 2 (1.65%) PaaS
Communications & Networking
1 5 (4.13%) Remote Desktop
Database & Business Intelligence
1 15 (12.40%) Power BI
2 8 (6.61%) Big Data
3 7 (5.79%) SQL Server
4 5 (4.13%) Data Warehouse
5 4 (3.31%) SQL Server Reporting Services
6 3 (2.48%) MySQL
6 3 (2.48%) SQL Server Integration Services
7 2 (1.65%) Azure SQL Database
7 2 (1.65%) RDBMS
7 2 (1.65%) Relational Database
8 1 (0.83%) PostgreSQL
8 1 (0.83%) Power Query
Development Applications
1 10 (8.26%) Git
1 10 (8.26%) gulp
1 10 (8.26%) Yeoman
2 5 (4.13%) Eclipse
2 5 (4.13%) IntelliJ
2 5 (4.13%) Visual Studio Code
3 3 (2.48%) JIRA
3 3 (2.48%) Visual Studio
4 2 (1.65%) JMeter
4 2 (1.65%) Postman
4 2 (1.65%) SoapUI
5 1 (0.83%) SQL Server Management Studio (SSMS)
General
1 47 (38.84%) Social Skills
2 18 (14.88%) Finance
3 14 (11.57%) Analytical Skills
4 12 (9.92%) Retail
5 8 (6.61%) Local Government
5 8 (6.61%) Presentation Skills
5 8 (6.61%) Public Sector
6 6 (4.96%) Law
7 5 (4.13%) Automotive
7 5 (4.13%) Inclusion and Diversity
8 4 (3.31%) Influencing Skills
8 4 (3.31%) Marketing
9 3 (2.48%) Legal
9 3 (2.48%) Telecoms
10 2 (1.65%) Tech for Good
11 1 (0.83%) Banking
11 1 (0.83%) Financial Institution
11 1 (0.83%) Fire and Rescue
11 1 (0.83%) Investment Banking
11 1 (0.83%) Manufacturing
Job Titles
1 49 (40.50%) Developer
2 19 (15.70%) Senior
3 16 (13.22%) Analyst
3 16 (13.22%) Consultant
3 16 (13.22%) Power Platform Developer
4 15 (12.40%) Lead
5 13 (10.74%) Applications Developer
6 12 (9.92%) Appian Developer
6 12 (9.92%) Low-Code Developer
7 10 (8.26%) SharePoint Developer
8 9 (7.44%) Dynamics 365 Developer
8 9 (7.44%) Lead Developer
9 7 (5.79%) Power Platform Consultant
9 7 (5.79%) Senior Developer
10 6 (4.96%) Platform Manager
11 5 (4.13%) IT Support
11 5 (4.13%) Java Engineer
11 5 (4.13%) Senior Java Engineer
11 5 (4.13%) Technical Support
11 5 (4.13%) Technical Support Officer
Libraries, Frameworks & Software Standards
1 26 (21.49%) .NET
2 20 (16.53%) HTML
3 19 (15.70%) CSS
4 16 (13.22%) RESTful
5 15 (12.40%) React
6 14 (11.57%) HTML5 Canvas
7 10 (8.26%) Microsoft Graph
7 10 (8.26%) Node.js
7 10 (8.26%) SPFx
8 8 (6.61%) ASP.NET Web API
9 5 (4.13%) REST
9 5 (4.13%) Servlets
9 5 (4.13%) SOAP
9 5 (4.13%) Spring
10 3 (2.48%) JSON
11 2 (1.65%) ASP.NET
11 2 (1.65%) GraphQL
11 2 (1.65%) jQuery
12 1 (0.83%) Twitter Bootstrap
12 1 (0.83%) XML
Miscellaneous
1 7 (5.79%) Onboarding
2 4 (3.31%) Virtual Team
3 3 (2.48%) Hackathon
3 3 (2.48%) Management Information System
3 3 (2.48%) Self-Motivation
4 2 (1.65%) Foreign Exchange (FX)
4 2 (1.65%) Greenfield Project
4 2 (1.65%) IoT
4 2 (1.65%) Legacy Applications
5 1 (0.83%) Blog
5 1 (0.83%) Enterprise Software
5 1 (0.83%) Product Ownership
Operating Systems
1 10 (8.26%) Windows
2 5 (4.13%) AIX
2 5 (4.13%) Linux
3 1 (0.83%) VMS
Processes & Methodologies
1 37 (30.58%) Agile
2 27 (22.31%) Workflow
3 24 (19.83%) DevOps
3 24 (19.83%) Problem-Solving
4 22 (18.18%) Customer Service
5 20 (16.53%) Continuous Integration
6 19 (15.70%) Business Intelligence
6 19 (15.70%) Migration
7 16 (13.22%) Artificial Intelligence
7 16 (13.22%) Project Management
8 13 (10.74%) Continuous Improvement
8 13 (10.74%) CRM
8 13 (10.74%) Requirements Gathering
8 13 (10.74%) Roadmaps
9 11 (9.09%) Digital Transformation Programme
9 11 (9.09%) Mentoring
9 11 (9.09%) Project Delivery
9 11 (9.09%) Test Automation
10 10 (8.26%) Full Stack Development
10 10 (8.26%) Regression Testing
Programming Languages
1 44 (36.36%) JavaScript
2 25 (20.66%) C#
3 20 (16.53%) TypeScript
4 14 (11.57%) Python
5 13 (10.74%) SQL
6 12 (9.92%) PowerShell
7 8 (6.61%) Java
8 2 (1.65%) Bash
8 2 (1.65%) Data Analysis Expressions
8 2 (1.65%) Ruby
9 1 (0.83%) Formula Language
9 1 (0.83%) PHP
9 1 (0.83%) T-SQL
9 1 (0.83%) VB.NET
9 1 (0.83%) VBA
9 1 (0.83%) VBScript
Qualifications
1 21 (17.36%) Security Cleared
2 14 (11.57%) Degree
3 13 (10.74%) SC Cleared
4 6 (4.96%) ISTQB
5 5 (4.13%) Azure Certification
6 3 (2.48%) BPSS Clearance
6 3 (2.48%) Microsoft Certification
7 2 (1.65%) Computer Science Degree
8 1 (0.83%) DBS Check
Quality Assurance & Compliance
1 12 (9.92%) QA
2 2 (1.65%) GDPR
2 2 (1.65%) PMO
3 1 (0.83%) SLA
System Software
1 5 (4.13%) Virtual Desktop
Systems Management
1 5 (4.13%) Microsoft Intune
Vendors
1 58 (47.93%) Microsoft
2 2 (1.65%) Google
2 2 (1.65%) iManage
2 2 (1.65%) MuleSoft
2 2 (1.65%) OutSystems
3 1 (0.83%) Automation Anywhere
3 1 (0.83%) Databricks
3 1 (0.83%) OpenAI
3 1 (0.83%) Siemens