Google Contracts with Hybrid/Remote/WFH Options

Google
UK > Work from Home

The table below provides summary statistics for remote or hybrid contract work requiring knowledge or experience of Google products and/or services. It includes a benchmarking guide to contractor rates offered in vacancies that cited Google over the 6 months leading up to 30 April 2025, comparing them to the same period in the previous two years.

The figures below represent the IT contractor job market in general and are not representative of contractor rates within Google.

6 months to
30 Apr 2025
Same period 2024 Same period 2023
Rank 113 136 88
Rank change year-on-year +23 -48 -4
Contract jobs citing Google 230 256 671
As % of all contract jobs with a WFH option 2.32% 1.66% 2.59%
As % of the Vendors category 5.05% 3.92% 6.03%
Number of daily rates quoted 145 163 486
10th Percentile £250 £327 £319
25th Percentile £350 £436 £426
Median daily rate (50th Percentile) £475 £525 £550
Median % change year-on-year -9.52% -4.55% -0.09%
75th Percentile £575 £625 £688
90th Percentile £700 £688 £800
UK median daily rate £500 £525 £550
% change year-on-year -4.76% -4.55% -
Number of hourly rates quoted 19 17 16
10th Percentile £16.00 £23.80 -
25th Percentile £23.25 £25.50 £21.00
Median hourly rate £30.00 £26.00 £39.58
Median % change year-on-year +15.38% -34.30% +58.30%
75th Percentile £60.00 £26.50 £54.57
90th Percentile £68.20 £51.50 £58.75
UK median hourly rate £31.76 £26.00 £51.75
% change year-on-year +22.15% -49.76% +47.86%

All Vendors
Work from Home

Google falls under the Vendor Products and Services category. For comparison with the information above, the following table provides summary statistics for all contract job vacancies with a remote or hybrid options requiring knowledge or experience of all vendor products and services.

Contract vacancies with a requirement for knowledge or experience of vendor products and services 4,552 6,531 11,133
As % of all contract jobs with a WFH option 45.92% 42.47% 43.05%
Number of daily rates quoted 2,969 4,043 7,492
10th Percentile £325 £325 £330
25th Percentile £413 £425 £425
Median daily rate (50th Percentile) £523 £525 £525
Median % change year-on-year -0.38% - -
75th Percentile £625 £625 £650
90th Percentile £738 £725 £750
UK median daily rate £515 £518 £525
% change year-on-year -0.48% -1.43% -
Number of hourly rates quoted 121 217 258
10th Percentile £14.20 £13.72 £17.87
25th Percentile £19.75 £16.70 £31.81
Median hourly rate £53.50 £32.12 £54.50
Median % change year-on-year +66.59% -41.07% +55.71%
75th Percentile £68.00 £60.00 £68.75
90th Percentile £86.00 £71.00 £80.25
UK median hourly rate £27.13 £22.15 £43.75
% change year-on-year +22.46% -49.37% +108.33%

Google
Trend for Jobs with a WFH Option

Job vacancies with remote working options citing Google as a proportion of all IT jobs advertised.
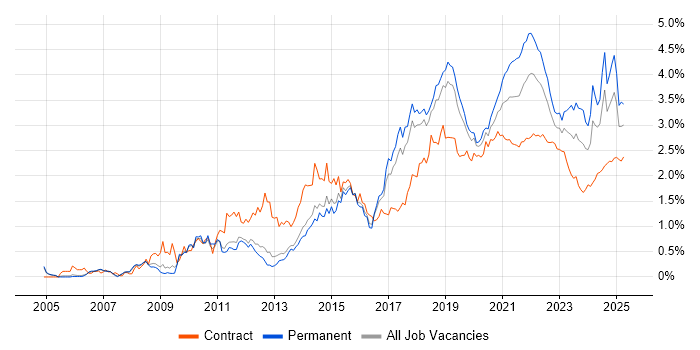
Google trend for jobs with Hybrid/Remote/WFH options

Google
Daily Rate Trend for Jobs with a WFH Option

3-month moving average daily rate quoted in job vacancies with remote working options citing Google.

Google daily rate for jobs with a WFH option

Google
Daily Rate Histogram for Jobs with a WFH Option

Daily rate distribution for jobs with remote working options citing Google over the 6 months to 30 April 2025.

Google daily rate histogram for jobs with a WFH option

Google
Hourly Rate Trend for Jobs with a WFH Option

3-month moving average hourly rate quoted in job vacancies with remote working options citing Google.

Google hourly rate for jobs with a WFH option

Google
Hourly Rate Histogram for Jobs with a WFH Option

Hourly rate distribution for jobs with remote working options citing Google over the 6 months to 30 April 2025.

Google hourly rate histogram for jobs with a WFH option

Google
Co-occurring Skills and Capabilities with WFH Options by Category

The follow tables expand on the table above by listing co-occurrences grouped by category. The same employment type, locality and period is covered with up to 20 co-occurrences shown in each of the following categories:

Application Platforms
1 11 (4.78%) Apache
2 9 (3.91%) Confluence
3 7 (3.04%) Apache Airflow
3 7 (3.04%) Apache Spark
4 6 (2.61%) CMS
4 6 (2.61%) WordPress
5 5 (2.17%) Microsoft Exchange
6 4 (1.74%) SharePoint
7 2 (0.87%) OpenStack
8 1 (0.43%) Adobe Experience Manager
8 1 (0.43%) Headless CMS
8 1 (0.43%) Jupyter
8 1 (0.43%) SAS
8 1 (0.43%) Tomcat
Applications
1 6 (2.61%) Microsoft Excel
2 4 (1.74%) Trello
3 3 (1.30%) Microsoft Office
3 3 (1.30%) Microsoft PowerPoint
4 1 (0.43%) Adobe Creative Suite
4 1 (0.43%) Microsoft Project
4 1 (0.43%) Notion
4 1 (0.43%) Spreadsheet
Business Applications
1 3 (1.30%) Shopify
1 3 (1.30%) Unica
2 2 (0.87%) SAP CO
2 2 (0.87%) SAP FI
2 2 (0.87%) SAP FI/CO
2 2 (0.87%) SAP HR
2 2 (0.87%) SAP Payroll
3 1 (0.43%) Adobe Campaign
3 1 (0.43%) iTrent
3 1 (0.43%) Magento
3 1 (0.43%) SessionCam
Cloud Services
1 136 (59.13%) GCP
2 81 (35.22%) AWS
3 78 (33.91%) Azure
4 23 (10.00%) Google Analytics
5 22 (9.57%) Power Platform
6 21 (9.13%) Google Workspace
7 17 (7.39%) GitHub
8 11 (4.78%) Entra ID
9 8 (3.48%) Cloud Computing
9 8 (3.48%) Google Ads
9 8 (3.48%) Snowflake
10 7 (3.04%) Google Data Studio
10 7 (3.04%) Google Sheets
10 7 (3.04%) Serverless
11 6 (2.61%) Microsoft 365
12 5 (2.17%) Adobe Analytics
12 5 (2.17%) Azure DevOps
12 5 (2.17%) Google Compute Engine
12 5 (2.17%) Google Tag Manager
12 5 (2.17%) Slack
Communications & Networking
1 10 (4.35%) Firewall
2 6 (2.61%) DNS
3 5 (2.17%) HTTP
4 3 (1.30%) SNMP
4 3 (1.30%) Software-Defined Radio
5 2 (0.87%) VPN
6 1 (0.43%) H.323
6 1 (0.43%) MQTT
6 1 (0.43%) NetScaler
6 1 (0.43%) SMTP
6 1 (0.43%) Software-Defined Networking
6 1 (0.43%) SSL
6 1 (0.43%) TCP/IP
6 1 (0.43%) Unified Communications
6 1 (0.43%) WebEx
6 1 (0.43%) Wireshark
Database & Business Intelligence
1 37 (16.09%) BigQuery
2 22 (9.57%) Power BI
3 21 (9.13%) Data Warehouse
4 20 (8.70%) Looker
5 18 (7.83%) Tableau
6 13 (5.65%) Big Data
7 10 (4.35%) MongoDB
8 9 (3.91%) Metadata
9 8 (3.48%) MySQL
9 8 (3.48%) PostgreSQL
10 6 (2.61%) NoSQL
10 6 (2.61%) Redis
10 6 (2.61%) Relational Database
11 5 (2.17%) Data Lake
11 5 (2.17%) Metadata Repository
12 3 (1.30%) Azure SQL Database
12 3 (1.30%) Hadoop
12 3 (1.30%) SQL Server
13 2 (0.87%) GIS
13 2 (0.87%) ObjectStore
Development Applications
1 16 (6.96%) Git
2 14 (6.09%) GitLab
2 14 (6.09%) Jenkins
3 13 (5.65%) JIRA
4 6 (2.61%) Eclipse
5 5 (2.17%) Gradle
6 4 (1.74%) Bitbucket
6 4 (1.74%) GoogleTest
6 4 (1.74%) Maven
6 4 (1.74%) MLflow
6 4 (1.74%) Robot Framework
7 3 (1.30%) IntelliJ
7 3 (1.30%) JUnit
7 3 (1.30%) Mockito
7 3 (1.30%) TestNG
7 3 (1.30%) Visual Studio Code
8 2 (0.87%) Android Studio
8 2 (0.87%) Artifactory
8 2 (0.87%) Cypress.io
8 2 (0.87%) ERwin
General
1 60 (26.09%) Social Skills
2 33 (14.35%) Analytical Skills
3 31 (13.48%) Public Sector
4 30 (13.04%) Finance
5 24 (10.43%) Marketing
6 16 (6.96%) Banking
7 11 (4.78%) Legal
8 9 (3.91%) Telecoms
9 7 (3.04%) Advertising
10 5 (2.17%) Inclusion and Diversity
10 5 (2.17%) Organisational Skills
11 3 (1.30%) Manufacturing
11 3 (1.30%) Retail
12 2 (0.87%) Aerospace
12 2 (0.87%) Digital Health
12 2 (0.87%) Documentation Skills
12 2 (0.87%) Military
12 2 (0.87%) Presentation Skills
13 1 (0.43%) Games
13 1 (0.43%) Health Technology
Job Titles
1 41 (17.83%) Developer
2 34 (14.78%) Architect
3 29 (12.61%) Analyst
4 19 (8.26%) Lead
5 15 (6.52%) Data Engineer
5 15 (6.52%) Senior
6 14 (6.09%) Data Analyst
6 14 (6.09%) GCP Engineer
6 14 (6.09%) Solutions Architect
7 12 (5.22%) Security Engineer
8 10 (4.35%) Python Developer
9 8 (3.48%) Automation Engineer
9 8 (3.48%) Operations Engineer
10 7 (3.04%) Cloud Architect
10 7 (3.04%) Cloud Engineer
10 7 (3.04%) Software Engineer
11 6 (2.61%) Business Analyst
11 6 (2.61%) Consultant
11 6 (2.61%) Junior
11 6 (2.61%) Technical Architect
Libraries, Frameworks & Software Standards
1 16 (6.96%) RESTful
2 14 (6.09%) Node.js
3 12 (5.22%) React
4 11 (4.78%) .NET
4 11 (4.78%) Kafka
5 10 (4.35%) CSS
6 9 (3.91%) HTML
6 9 (3.91%) OAuth
7 8 (3.48%) AngularJS
7 8 (3.48%) Middleware
8 7 (3.04%) JWT
8 7 (3.04%) Spring
9 6 (2.61%) Spring Boot
10 5 (2.17%) Elastic Stack
10 5 (2.17%) JSON
10 5 (2.17%) REST
11 4 (1.74%) Next.js
11 4 (1.74%) OpenAPI
11 4 (1.74%) Swagger
12 3 (1.30%) Tailwind CSS
Miscellaneous
1 18 (7.83%) Cloud Native
2 8 (3.48%) Data Protection Act
2 8 (3.48%) Enterprise Software
2 8 (3.48%) Management Information System
3 6 (2.61%) Legacy Systems
4 5 (2.17%) NHS
4 5 (2.17%) Social Media
5 4 (1.74%) Algorithms
5 4 (1.74%) Distributed Systems
5 4 (1.74%) Mobile App
5 4 (1.74%) Self-Motivation
6 3 (1.30%) Virtual Team
7 2 (0.87%) Analytical Mindset
7 2 (0.87%) Data Centre
7 2 (0.87%) Data Structures
7 2 (0.87%) Digital Wallet
7 2 (0.87%) Life Science
7 2 (0.87%) Marketing Technology
7 2 (0.87%) Renewable Energy
7 2 (0.87%) Security Posture
Operating Systems
1 10 (4.35%) Linux
2 5 (2.17%) Android
3 4 (1.74%) Windows
4 3 (1.30%) Red Hat Enterprise Linux
4 3 (1.30%) Unix
5 2 (0.87%) Mac OS
6 1 (0.43%) AIX
6 1 (0.43%) Apple iOS
Processes & Methodologies
1 64 (27.83%) Analytics
2 44 (19.13%) Problem-Solving
3 42 (18.26%) CI/CD
4 39 (16.96%) Agile
5 34 (14.78%) DevOps
6 31 (13.48%) Migration
7 30 (13.04%) Containerisation
7 30 (13.04%) Software Engineering
8 27 (11.74%) Computer Science
9 25 (10.87%) Business Intelligence
10 23 (10.00%) ETL
10 23 (10.00%) Microservices
11 22 (9.57%) Machine Learning
12 21 (9.13%) Artificial Intelligence
12 21 (9.13%) Data Modelling
12 21 (9.13%) Data Pipeline
12 21 (9.13%) Visualisation
13 20 (8.70%) Data Science
14 19 (8.26%) Cloud Security
15 17 (7.39%) Decision-Making
Programming Languages
1 65 (28.26%) Python
2 47 (20.43%) SQL
3 31 (13.48%) Java
4 24 (10.43%) JavaScript
5 14 (6.09%) TypeScript
6 8 (3.48%) C#
6 8 (3.48%) PowerShell
7 7 (3.04%) Bash
8 6 (2.61%) R
9 5 (2.17%) C++
9 5 (2.17%) Kotlin
10 3 (1.30%) PHP
10 3 (1.30%) Shell Script
11 2 (0.87%) ABAP
11 2 (0.87%) Go
12 1 (0.43%) C
12 1 (0.43%) Data Analysis Expressions
12 1 (0.43%) Groovy
12 1 (0.43%) Perl
12 1 (0.43%) T-SQL
Qualifications
1 36 (15.65%) Security Cleared
2 32 (13.91%) Degree
3 31 (13.48%) SC Cleared
4 24 (10.43%) Computer Science Degree
5 23 (10.00%) Azure Certification
6 21 (9.13%) AWS Certification
7 17 (7.39%) Microsoft Certification
8 13 (5.65%) AWS Certified Solutions Architect
9 11 (4.78%) Master's Degree
10 7 (3.04%) Cisco Certification
11 5 (2.17%) (ISC)2 CCSP
12 4 (1.74%) CISSP
13 3 (1.30%) CEH
13 3 (1.30%) CITP
13 3 (1.30%) OSCP
13 3 (1.30%) TOGAF Certification
14 2 (0.87%) BPSS Clearance
14 2 (0.87%) CCNA
14 2 (0.87%) CREST Certified
14 2 (0.87%) PMP
Quality Assurance & Compliance
1 16 (6.96%) QA
2 14 (6.09%) Data Quality
3 10 (4.35%) GDPR
4 4 (1.74%) Accessibility
5 3 (1.30%) Actionable Recommendations
5 3 (1.30%) ISO/IEC 27001
5 3 (1.30%) WCAG
6 2 (0.87%) PERC
7 1 (0.43%) California Consumer Privacy Act
7 1 (0.43%) NIST
7 1 (0.43%) PCI DSS
7 1 (0.43%) PMO
System Software
1 27 (11.74%) Docker
2 9 (3.91%) Virtual Machines
3 6 (2.61%) Active Directory
4 4 (1.74%) VMware Infrastructure
5 2 (0.87%) Apache ZooKeeper
6 1 (0.43%) Hyper-V
6 1 (0.43%) VMware NSX
6 1 (0.43%) vSphere
Systems Management
1 34 (14.78%) Kubernetes
2 14 (6.09%) Terraform
3 10 (4.35%) Prometheus
4 9 (3.91%) Grafana
5 8 (3.48%) Ansible
6 5 (2.17%) Single Sign-On
7 4 (1.74%) Progress Chef
8 3 (1.30%) Argo
9 2 (0.87%) Consul
9 2 (0.87%) logstash
9 2 (0.87%) PowerCLI
10 1 (0.43%) CA Wily
10 1 (0.43%) CSIRT
10 1 (0.43%) Istio
10 1 (0.43%) Microsoft Intune
10 1 (0.43%) Nessus
10 1 (0.43%) Perfmon
10 1 (0.43%) Puppet
10 1 (0.43%) vRealize
10 1 (0.43%) vRealize Orchestrator
Vendors
1 51 (22.17%) Microsoft
2 13 (5.65%) Databricks
3 11 (4.78%) SAP
4 9 (3.91%) Adobe
5 8 (3.48%) Oracle
5 8 (3.48%) Palo Alto
6 6 (2.61%) Splunk
6 6 (2.61%) VMware
7 5 (2.17%) Apple
7 5 (2.17%) Cloudera
7 5 (2.17%) IBM
7 5 (2.17%) Salesforce
7 5 (2.17%) Workday
8 4 (1.74%) Atlassian
8 4 (1.74%) Dynatrace
9 3 (1.30%) Cisco
9 3 (1.30%) Sage
9 3 (1.30%) Xero
10 2 (0.87%) Criteo
10 2 (0.87%) Mapbox