Solutions Architect Contracts with Hybrid/Remote/WFH Options

Solution Architect
UK > Work from Home

The median Solution Architect daily rate for remote or hybrid work is £598, according to job vacancies posted in the 6 months leading up to 1 May 2025.

The table below provides contractor rate benchmarking and summary statistics, comparing them to the same period in the previous two years.

6 months to
1 May 2025
Same period 2024 Same period 2023
Rank 81 64 83
Rank change year-on-year -17 +19 -19
Contract jobs requiring a Solutions Architect 299 472 702
As % of all contract jobs with a WFH option 3.02% 3.08% 2.71%
As % of the Job Titles category 3.22% 3.29% 2.85%
Number of daily rates quoted 176 320 502
10th Percentile £456 £490 £513
25th Percentile £513 £550 £564
Median daily rate (50th Percentile) £598 £633 £650
Median % change year-on-year -5.53% -2.69% +4.84%
75th Percentile £700 £700 £738
90th Percentile £775 £775 £802
UK median daily rate £625 £650 £663
% change year-on-year -3.85% -1.89% +6.00%
Number of hourly rates quoted 8 1 8
10th Percentile £61.50 - £55.43
25th Percentile £64.88 £50.00 £66.00
Median hourly rate £66.75 £55.00 £71.00
Median % change year-on-year +21.36% -22.54% +20.34%
75th Percentile £75.00 £60.00 £80.25
90th Percentile £82.07 - -
UK median hourly rate £66.00 £88.00 £66.75
% change year-on-year -25.00% +31.84% +13.14%

All Contract IT Job Vacancies
Work from Home

For comparison with the information above, the following table provides summary statistics for all contract IT job vacancies with WFH or hybrid options. Most job vacancies include a discernible job title that can be normalized. As such, the figures in the second row provide an indication of the number of contract jobs in our overall sample.

Contract vacancies in Work from Home with a recognized job title 9,288 14,354 24,650
% of contract IT jobs with a recognized job title 93.77% 93.54% 95.33%
Number of daily rates quoted 6,350 9,595 17,415
10th Percentile £337 £325 £360
25th Percentile £414 £425 £444
Median daily rate (50th Percentile) £525 £525 £540
Median % change year-on-year - -2.69% +2.76%
75th Percentile £638 £638 £650
90th Percentile £763 £750 £750
UK median daily rate £515 £525 £540
% change year-on-year -1.90% -2.78% +2.86%
Number of hourly rates quoted 228 579 565
10th Percentile £14.00 £14.38 £18.50
25th Percentile £18.19 £23.39 £26.00
Median hourly rate £38.00 £44.74 £55.00
Median % change year-on-year -15.06% -18.65% +57.14%
75th Percentile £66.00 £63.00 £68.75
90th Percentile £75.00 £75.25 £80.25
UK median hourly rate £29.00 £36.42 £45.00
% change year-on-year -20.37% -19.07% +91.49%

Solutions Architect
Trend for Jobs with a WFH Option

Job vacancies with remote working options which featured Solutions Architect in the job title as a proportion of all IT jobs advertised.
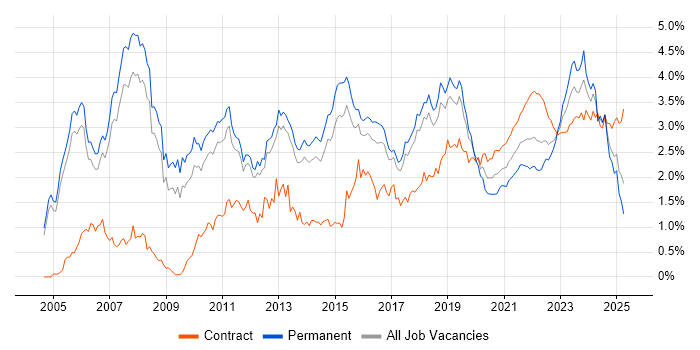
Solutions Architect trend for jobs with Hybrid/Remote/WFH options

Solutions Architect
Daily Rate Trend for Jobs with a WFH Option

3-month moving average daily rate quoted in job vacancies with remote working options citing Solutions Architect.

Solutions Architect daily rate for jobs with a WFH option

Solutions Architect
Daily Rate Histogram for Jobs with a WFH Option

Daily rate distribution for jobs with remote working options citing Solutions Architect over the 6 months to 1 May 2025.

Solutions Architect daily rate histogram for jobs with a WFH option

Solutions Architect
Hourly Rate Trend for Jobs with a WFH Option

3-month moving average hourly rate quoted in job vacancies with remote working options citing Solutions Architect.

Solutions Architect hourly rate for jobs with a WFH option

Solutions Architect
Hourly Rate Histogram for Jobs with a WFH Option

Hourly rate distribution for jobs with remote working options citing Solutions Architect over the 6 months to 1 May 2025.

Solutions Architect hourly rate histogram for jobs with a WFH option

Solutions Architect Skill Set
Top 30 Co-occurring Skills and Capabilities in Job Vacancies with WFH Options

For the 6 months to 1 May 2025, Solutions Architect contract job roles required the following skills and capabilities in order of popularity. The figures indicate the absolute number co-occurrences and as a proportion of all contract jobs with a WFH option featuring Solutions Architect in the job title.

1 84 (28.09%) Azure
2 81 (27.09%) AWS
3 73 (24.41%) Social Skills
4 68 (22.74%) Security Cleared
5 65 (21.74%) Agile
6 59 (19.73%) TOGAF
7 57 (19.06%) Roadmaps
8 56 (18.73%) Microsoft
9 55 (18.39%) SC Cleared
10 44 (14.72%) Finance
11 43 (14.38%) Problem-Solving
12 39 (13.04%) Migration
13 37 (12.37%) Stakeholder Management
14 34 (11.37%) GCP
15 33 (11.04%) Enterprise Architecture
16 32 (10.70%) DevOps
17 31 (10.37%) Java
18 30 (10.03%) MODAF
18 30 (10.03%) Scaled Agile Framework
19 28 (9.36%) Microservices
20 27 (9.03%) Analytical Skills
21 26 (8.70%) Banking
21 26 (8.70%) Presentation Skills
22 25 (8.36%) CI/CD
23 24 (8.03%) SAP
24 22 (7.36%) Management Information System
24 22 (7.36%) Decision-Making
24 22 (7.36%) Technical Leadership
25 21 (7.02%) Public Sector
25 21 (7.02%) ServiceNow

Solutions Architect Skill Set
Co-occurring Skills and Capabilities with WFH Options by Category

The follow tables expand on the table above by listing co-occurrences grouped by category. The same employment type, locality and period is covered with up to 20 co-occurrences shown in each of the following categories:

Application Platforms
1 6 (2.01%) WebSphere
2 4 (1.34%) SharePoint
3 2 (0.67%) ArcGIS
3 2 (0.67%) MTS
4 1 (0.33%) Apache
4 1 (0.33%) Apache Spark
4 1 (0.33%) Appian
4 1 (0.33%) CICS
4 1 (0.33%) Confluence
4 1 (0.33%) JBoss
4 1 (0.33%) Microsoft Exchange
Applications
1 11 (3.68%) MS Visio
2 10 (3.34%) Microsoft PowerPoint
3 2 (0.67%) Microsoft Office
4 1 (0.33%) Fusion 360
4 1 (0.33%) InfoPath
4 1 (0.33%) Siemens NX
4 1 (0.33%) Trello
Business Applications
1 17 (5.69%) SAP S/4HANA
2 6 (2.01%) Primavera
3 3 (1.00%) Teamcenter
4 2 (0.67%) Aladdin
4 2 (0.67%) Dynamics CRM
4 2 (0.67%) Oracle EBS
4 2 (0.67%) SAP FSCM
4 2 (0.67%) SAP SCM
5 1 (0.33%) Distributed Ledger
5 1 (0.33%) Dynamics AX
5 1 (0.33%) Oracle EBS R12
5 1 (0.33%) Oracle ERP
5 1 (0.33%) Oracle Receivables
5 1 (0.33%) Payment Gateway
5 1 (0.33%) Salesforce CRM
5 1 (0.33%) SAP FI
5 1 (0.33%) SAP FI/CO
5 1 (0.33%) SAP PP
5 1 (0.33%) SAP Retail
5 1 (0.33%) Siebel CRM
Cloud Services
1 84 (28.09%) Azure
2 81 (27.09%) AWS
3 34 (11.37%) GCP
4 18 (6.02%) SaaS
5 15 (5.02%) Serverless
6 13 (4.35%) PaaS
7 12 (4.01%) Entra ID
7 12 (4.01%) Power Platform
8 9 (3.01%) AWS Lambda
8 9 (3.01%) Microsoft 365
9 8 (2.68%) Amazon CloudWatch
9 8 (2.68%) Dynamics 365
10 7 (2.34%) IaaS
10 7 (2.34%) Power Automate
10 7 (2.34%) PowerApps
11 6 (2.01%) Azure DevOps
12 5 (1.67%) Amazon EKS
12 5 (1.67%) Azure Logic Apps
12 5 (1.67%) GitHub
13 4 (1.34%) Azure AKS
Communications & Networking
1 12 (4.01%) Firewall
2 6 (2.01%) Network Security
2 6 (2.01%) VPN
3 5 (1.67%) Intrusion Detection
4 3 (1.00%) DNS
4 3 (1.00%) Kerberos
5 2 (0.67%) LAN
5 2 (0.67%) WAN
6 1 (0.33%) ATM
6 1 (0.33%) BGP
6 1 (0.33%) Cisco ASA
6 1 (0.33%) Cisco Nexus
6 1 (0.33%) Extranet
6 1 (0.33%) HTTP
6 1 (0.33%) Intranet
6 1 (0.33%) NX-OS
6 1 (0.33%) OSPF
6 1 (0.33%) Radio Access Network
6 1 (0.33%) S/MIME
6 1 (0.33%) SSL
Database & Business Intelligence
1 7 (2.34%) Data Warehouse
1 7 (2.34%) NoSQL
2 5 (1.67%) Data Lake
2 5 (1.67%) DB2
2 5 (1.67%) Relational Database
3 4 (1.34%) DynamoDB
3 4 (1.34%) SQL Server
4 3 (1.00%) MongoDB
4 3 (1.00%) PostgreSQL
4 3 (1.00%) Power BI
5 2 (0.67%) Azure SQL Database
5 2 (0.67%) Big Data
5 2 (0.67%) Oracle Database
6 1 (0.33%) Apache Cassandra
6 1 (0.33%) Couchbase
6 1 (0.33%) Hadoop
6 1 (0.33%) Oracle Exadata
6 1 (0.33%) Parquet
6 1 (0.33%) SAP HANA
6 1 (0.33%) Tableau
Development Applications
1 8 (2.68%) Jenkins
2 4 (1.34%) GitLab
3 2 (0.67%) JIRA
4 1 (0.33%) GCC
4 1 (0.33%) MLflow
4 1 (0.33%) Oracle Forms
4 1 (0.33%) Sonatype Nexus
General
1 73 (24.41%) Social Skills
2 44 (14.72%) Finance
3 27 (9.03%) Analytical Skills
4 26 (8.70%) Banking
4 26 (8.70%) Presentation Skills
5 21 (7.02%) Public Sector
6 14 (4.68%) Retail
7 12 (4.01%) Telecoms
8 9 (3.01%) Legal
9 7 (2.34%) Corporate Banking
10 6 (2.01%) Documentation Skills
10 6 (2.01%) Manufacturing
11 5 (1.67%) Influencing Skills
11 5 (1.67%) Marketing
12 4 (1.34%) Automotive
13 3 (1.00%) Aerospace
13 3 (1.00%) Aviation
13 3 (1.00%) Back Office
14 2 (0.67%) Electronics
14 2 (0.67%) Organisational Skills
Libraries, Frameworks & Software Standards
1 15 (5.02%) Middleware
2 11 (3.68%) .NET
2 11 (3.68%) HTML
3 8 (2.68%) Kafka
4 7 (2.34%) AngularJS
4 7 (2.34%) Web Services
5 6 (2.01%) REST
5 6 (2.01%) RESTful
6 5 (1.67%) CSS
7 4 (1.34%) .NET Framework
7 4 (1.34%) ActiveMQ
8 3 (1.00%) JSON
9 2 (0.67%) HTML5 Canvas
9 2 (0.67%) LDAP
9 2 (0.67%) OAuth
9 2 (0.67%) SAML
9 2 (0.67%) SAP PI
9 2 (0.67%) Spring
10 1 (0.33%) Apache Avro
10 1 (0.33%) Protocol Buffers
Miscellaneous
1 22 (7.36%) Management Information System
2 17 (5.69%) Data Centre
3 16 (5.35%) Public Cloud
4 13 (4.35%) Hybrid Cloud
5 12 (4.01%) Cloud Native
6 10 (3.34%) Legacy Systems
7 7 (2.34%) CMDB
7 7 (2.34%) Enterprise Software
7 7 (2.34%) Private Cloud
8 6 (2.01%) Product Ownership
9 5 (1.67%) Cyber Threat
9 5 (1.67%) IoT
10 4 (1.34%) SWIFT Messaging Network
11 3 (1.00%) Algorithms
11 3 (1.00%) Device Driver
11 3 (1.00%) Embedded Systems
11 3 (1.00%) NHS
11 3 (1.00%) PKI
11 3 (1.00%) Replication
11 3 (1.00%) Self-Motivation
Operating Systems
1 5 (1.67%) Linux
2 2 (0.67%) Windows
3 1 (0.33%) Android
3 1 (0.33%) Apple iOS
3 1 (0.33%) zOS
Processes & Methodologies
1 65 (21.74%) Agile
2 59 (19.73%) TOGAF
3 57 (19.06%) Roadmaps
4 43 (14.38%) Problem-Solving
5 39 (13.04%) Migration
6 37 (12.37%) Stakeholder Management
7 33 (11.04%) Enterprise Architecture
8 32 (10.70%) DevOps
9 30 (10.03%) MODAF
9 30 (10.03%) Scaled Agile Framework
10 28 (9.36%) Microservices
11 25 (8.36%) CI/CD
12 22 (7.36%) Decision-Making
12 22 (7.36%) Technical Leadership
13 20 (6.69%) Architectural Design
14 19 (6.35%) Analytics
15 18 (6.02%) Integration Patterns
16 17 (5.69%) Architecture Roadmap
17 16 (5.35%) Computer Science
17 16 (5.35%) Project Management
Programming Languages
1 31 (10.37%) Java
2 16 (5.35%) SQL
3 13 (4.35%) JavaScript
4 12 (4.01%) Python
5 5 (1.67%) PowerShell
6 3 (1.00%) C
6 3 (1.00%) C#
6 3 (1.00%) Embedded C
7 2 (0.67%) PL/SQL
7 2 (0.67%) Scala
8 1 (0.33%) Apex Code
8 1 (0.33%) TypeScript
Qualifications
1 68 (22.74%) Security Cleared
2 55 (18.39%) SC Cleared
3 20 (6.69%) Degree
4 19 (6.35%) AWS Certification
5 18 (6.02%) AWS Certified Solutions Architect
6 16 (5.35%) Computer Science Degree
7 13 (4.35%) Azure Certification
7 13 (4.35%) TOGAF Certification
8 11 (3.68%) Microsoft Certification
9 4 (1.34%) BPSS Clearance
9 4 (1.34%) CISM
9 4 (1.34%) CISSP
9 4 (1.34%) Master's Degree
9 4 (1.34%) OCP
9 4 (1.34%) Oracle Certification
10 2 (0.67%) CCNP
10 2 (0.67%) CEH
10 2 (0.67%) Cisco Certification
11 1 (0.33%) CITP
11 1 (0.33%) VMware Certified Professional (VCP)
Quality Assurance & Compliance
1 14 (4.68%) QA
2 6 (2.01%) GDPR
3 4 (1.34%) ISO/IEC 27001
3 4 (1.34%) NIST
4 3 (1.00%) GRC
4 3 (1.00%) ISO 20022
4 3 (1.00%) PCI DSS
5 2 (0.67%) California Consumer Privacy Act
5 2 (0.67%) PMO
5 2 (0.67%) SEPA
6 1 (0.33%) DICOM
6 1 (0.33%) Disclosure Scotland
6 1 (0.33%) GAAP
6 1 (0.33%) HIPAA
6 1 (0.33%) HL7
6 1 (0.33%) Sarbanes-Oxley
6 1 (0.33%) SLA
System Software
1 16 (5.35%) Active Directory
2 14 (4.68%) Virtual Machines
3 9 (3.01%) VMware Infrastructure
4 8 (2.68%) Docker
5 5 (1.67%) Hyper-V
6 3 (1.00%) Firmware
7 2 (0.67%) Virtual Desktop
7 2 (0.67%) VMware NSX
8 1 (0.33%) VMware ESXi
Systems Management
1 14 (4.68%) Kubernetes
2 6 (2.01%) Terraform
3 5 (1.67%) Ansible
4 4 (1.34%) SCCM
5 2 (0.67%) Microsoft Intune
6 1 (0.33%) FortiGate
6 1 (0.33%) Grafana
6 1 (0.33%) Kubeflow
6 1 (0.33%) Prometheus
6 1 (0.33%) Single Sign-On
6 1 (0.33%) VxRail
Vendors
1 56 (18.73%) Microsoft
2 24 (8.03%) SAP
3 21 (7.02%) ServiceNow
4 17 (5.69%) Oracle
5 14 (4.68%) Google
6 12 (4.01%) VMware
7 11 (3.68%) Salesforce
8 5 (1.67%) Cisco
8 5 (1.67%) Fortinet
9 4 (1.34%) Autodesk
10 3 (1.00%) Ariba
10 3 (1.00%) IBM
11 2 (0.67%) CyberArk
11 2 (0.67%) Databricks
11 2 (0.67%) Dell
11 2 (0.67%) MuleSoft
11 2 (0.67%) Palo Alto
11 2 (0.67%) Qualys
12 1 (0.33%) OutSystems
12 1 (0.33%) Pardot