Asset Management Jobs in the East of England

Asset Management
England > East of England

The table below provides summary statistics for permanent job vacancies advertised in the East of England requiring Asset Management skills. It includes a benchmarking guide to the annual salaries offered in vacancies that cited Asset Management over the 6 months leading up to 20 September 2024, comparing them to the same period in the previous two years.

6 months to
20 Sep 2024
Same period 2023 Same period 2022
Rank 99 60 217
Rank change year-on-year -39 +157 -9
Permanent jobs citing Asset Management 86 103 62
As % of all permanent jobs advertised in the East of England 1.82% 4.06% 0.95%
As % of the Processes & Methodologies category 2.41% 4.38% 1.00%
Number of salaries quoted 60 41 34
10th Percentile £30,750 - £30,325
25th Percentile £41,188 £12,250 £41,000
Median annual salary (50th Percentile) £54,000 £12,500 £46,750
Median % change year-on-year +332.00% -73.26% +46.22%
75th Percentile - £33,750 £57,500
90th Percentile £69,500 £52,500 £65,625
England median annual salary £92,500 £85,000 £84,100
% change year-on-year +8.82% +1.07% -6.56%

All Process and Methodology Skills
East of England

Asset Management falls under the Processes and Methodologies category. For comparison with the information above, the following table provides summary statistics for all permanent job vacancies requiring process or methodology skills in the East of England.

Permanent vacancies with a requirement for process or methodology skills 3,567 2,353 6,175
As % of all permanent jobs advertised in the East of England 75.62% 92.71% 95.01%
Number of salaries quoted 1,777 1,372 2,737
10th Percentile £29,000 £25,525 £28,500
25th Percentile £40,000 £36,250 £36,875
Median annual salary (50th Percentile) £54,000 £54,500 £52,500
Median % change year-on-year -0.92% +3.81% +5.00%
75th Percentile £70,000 £67,500 £65,250
90th Percentile £85,000 £81,250 £78,750
England median annual salary £57,500 £62,000 £60,000
% change year-on-year -7.26% +3.33% +4.35%

Asset Management
Job Vacancy Trend in the East of England

Job postings citing Asset Management as a proportion of all IT jobs advertised in the East of England.
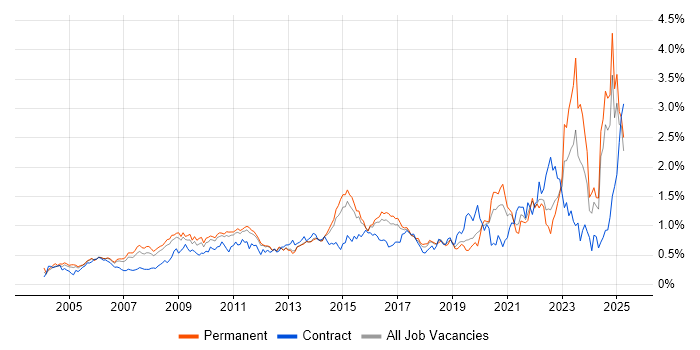
Job vacancy trend for Asset Management in the East of England

Asset Management
Salary Trend in the East of England

3-month moving average salary quoted in jobs citing Asset Management in the East of England.

Salary trend for Asset Management in the East of England

Asset Management
Salary Histogram in the East of England

Salary distribution for jobs citing Asset Management in the East of England over the 6 months to 20 September 2024.

Salary histogram for Asset Management in the East of England

Asset Management
Job Locations in the East of England

The table below looks at the demand and provides a guide to the median salaries quoted in IT jobs citing Asset Management within the East of England region over the 6 months to 20 September 2024. The 'Rank Change' column provides an indication of the change in demand within each location based on the same 6 month period last year.

Location Rank Change
on Same Period
Last Year
Matching
Permanent
IT Job Ads
Median Salary
Past 6 Months
Median Salary
% Change
on Same Period
Last Year
Live
Jobs
Cambridgeshire +3 31 £54,000 +88.81% 5
Hertfordshire -9 21 £70,000 +33.33% 8
Essex -21 17 £50,000 +300.00% 4
Bedfordshire -9 7 £39,000 +27.87% 1
Suffolk -7 4 £31,500 -
Norfolk -34 4 £30,500 -32.22%
Asset Management
England

Asset Management
Co-occurring Skills and Capabilities in the East of England by Category

The follow tables expand on the table above by listing co-occurrences grouped by category. The same employment type, locality and period is covered with up to 20 co-occurrences shown in each of the following categories:

Application Platforms
1 6 (6.98%) Confluence
2 1 (1.16%) Microsoft Exchange
Applications
1 14 (16.28%) Microsoft Excel
2 6 (6.98%) Microsoft PowerPoint
3 5 (5.81%) Microsoft Office
4 3 (3.49%) Microsoft Project
5 2 (2.33%) Adobe Premiere
5 2 (2.33%) Photoshop
5 2 (2.33%) Windchill
6 1 (1.16%) MS Visio
Business Applications
1 8 (9.30%) NEC Housing
2 2 (2.33%) SAP PM
3 1 (1.16%) Dynamics GP
Cloud Services
1 14 (16.28%) Azure
2 12 (13.95%) Microsoft 365
3 6 (6.98%) Power Platform
4 5 (5.81%) Entra ID
5 4 (4.65%) OneDrive
6 3 (3.49%) AWS
7 1 (1.16%) Lucidchart
7 1 (1.16%) SaaS
Communications & Networking
1 27 (31.40%) WAN
2 26 (30.23%) LAN
2 26 (30.23%) NAS
2 26 (30.23%) SAN
3 25 (29.07%) Fibre Channel
4 11 (12.79%) Firewall
5 10 (11.63%) DHCP
5 10 (11.63%) DNS
6 8 (9.30%) Wi-Fi
7 6 (6.98%) VLAN
7 6 (6.98%) VRRP
8 5 (5.81%) Network Security
9 4 (4.65%) Remote Desktop
10 1 (1.16%) Internet
10 1 (1.16%) NGFW
10 1 (1.16%) SD-WAN
10 1 (1.16%) Softphone
10 1 (1.16%) SSL
10 1 (1.16%) Wireless
10 1 (1.16%) WPA
Database & Business Intelligence
1 6 (6.98%) Power BI
2 2 (2.33%) Geospatial Data
2 2 (2.33%) GIS
2 2 (2.33%) SQL Server
Development Applications
1 6 (6.98%) JIRA
General
1 26 (30.23%) Social Skills
2 11 (12.79%) Finance
2 11 (12.79%) Retail
3 10 (11.63%) Analytical Skills
4 8 (9.30%) Social Housing
5 7 (8.14%) Presentation Skills
6 6 (6.98%) Local Government
6 6 (6.98%) Police
6 6 (6.98%) Public Sector
7 3 (3.49%) Legal
7 3 (3.49%) Pharmaceutical
8 2 (2.33%) Aerospace
8 2 (2.33%) Manufacturing
8 2 (2.33%) Organisational Skills
8 2 (2.33%) Publishing
9 1 (1.16%) Multimedia
9 1 (1.16%) Telecoms
Job Titles
1 26 (30.23%) Lead
2 25 (29.07%) Support Team Leader
2 25 (29.07%) Team Leader
3 9 (10.47%) Consultant
3 9 (10.47%) Senior
4 8 (9.30%) Implementation Consultant
4 8 (9.30%) Infrastructure Engineer
5 7 (8.14%) Desktop Engineer
6 5 (5.81%) Support Engineer
7 4 (4.65%) Administrator
7 4 (4.65%) Information Manager
7 4 (4.65%) Information Security Manager
7 4 (4.65%) Security Manager
7 4 (4.65%) Senior Desktop Engineer
8 3 (3.49%) Analyst
8 3 (3.49%) Data Administrator
8 3 (3.49%) Desktop Support
8 3 (3.49%) Desktop Support Engineer
8 3 (3.49%) Junior
8 3 (3.49%) Network Engineer
Miscellaneous
1 14 (16.28%) Management Information System
2 9 (10.47%) Data Centre
3 7 (8.14%) Driving Licence
4 6 (6.98%) Housing Association
5 5 (5.81%) CMDB
6 4 (4.65%) Cyber Threat
6 4 (4.65%) Distributed Denial-of-Service
7 2 (2.33%) Photography
8 1 (1.16%) Cloud Native
8 1 (1.16%) Onboarding
8 1 (1.16%) Security Posture
8 1 (1.16%) Self-Motivation
Operating Systems
1 50 (58.14%) Windows
2 35 (40.70%) Windows Server
3 31 (36.05%) Linux
4 7 (8.14%) Unix
5 6 (6.98%) Windows Server 2012
5 6 (6.98%) Windows Server 2019
6 4 (4.65%) Windows 10
7 2 (2.33%) Apple iOS
8 1 (1.16%) Android
8 1 (1.16%) Mac OS
8 1 (1.16%) Windows 7
8 1 (1.16%) Windows Phone
Processes & Methodologies
1 27 (31.40%) Mentoring
2 25 (29.07%) Capacity Planning
2 25 (29.07%) Infrastructure Management
3 12 (13.95%) ITIL
4 11 (12.79%) Change Management
5 10 (11.63%) Data Management
5 10 (11.63%) Infrastructure Engineering
5 10 (11.63%) Migration
5 10 (11.63%) Problem-Solving
6 9 (10.47%) Cybersecurity
6 9 (10.47%) Project Management
7 8 (9.30%) Business Intelligence
7 8 (9.30%) Continuous Improvement
7 8 (9.30%) ERP
8 7 (8.14%) Information Security
9 6 (6.98%) Customer Service
9 6 (6.98%) Housing Management
9 6 (6.98%) IT Asset Management
9 6 (6.98%) Process Improvement
9 6 (6.98%) Vulnerability Management
Programming Languages
1 9 (10.47%) SQL
2 1 (1.16%) Bash
2 1 (1.16%) PowerShell
2 1 (1.16%) Python
Qualifications
1 11 (12.79%) Cisco Certification
2 10 (11.63%) CCNA
2 10 (11.63%) Microsoft Certification
3 8 (9.30%) CCNP
3 8 (9.30%) DBS Check
3 8 (9.30%) Security Cleared
4 6 (6.98%) MCSA
5 5 (5.81%) Degree
6 3 (3.49%) A+ Certification
6 3 (3.49%) Computer Science Degree
6 3 (3.49%) MCITP
7 2 (2.33%) APMP
7 2 (2.33%) BC Cleared
7 2 (2.33%) HNC
8 1 (1.16%) BPSS Clearance
8 1 (1.16%) DV Cleared
8 1 (1.16%) MCP
8 1 (1.16%) MCSE
8 1 (1.16%) Numerate Degree
8 1 (1.16%) SC Cleared
Quality Assurance & Compliance
1 6 (6.98%) Accessibility
2 4 (4.65%) GRC
2 4 (4.65%) ISO/IEC 27001
2 4 (4.65%) NIST
2 4 (4.65%) NIST 800
3 3 (3.49%) GDPR
4 2 (2.33%) ISO 9001
4 2 (2.33%) PCI DSS
4 2 (2.33%) SLA
5 1 (1.16%) Cyber Essentials
5 1 (1.16%) Data Quality
5 1 (1.16%) HIPAA
5 1 (1.16%) Sarbanes-Oxley
System Software
1 15 (17.44%) Active Directory
2 7 (8.14%) Firmware
2 7 (8.14%) Hyper-V
3 5 (5.81%) Virtual Machines
4 1 (1.16%) KVM
4 1 (1.16%) VMware Infrastructure
Systems Management
1 4 (4.65%) Microsoft Intune
2 2 (2.33%) Ansible
3 1 (1.16%) Aspera SmartTrack
3 1 (1.16%) Backup Exec
3 1 (1.16%) Progress Chef
3 1 (1.16%) Puppet
3 1 (1.16%) SCCM
3 1 (1.16%) Terraform
Vendors
1 27 (31.40%) Microsoft
2 9 (10.47%) Veeam
3 8 (9.30%) NEC
4 7 (8.14%) Palo Alto
5 5 (5.81%) Cisco
5 5 (5.81%) Meraki
5 5 (5.81%) SAP
6 3 (3.49%) Adobe
6 3 (3.49%) SolarWinds
6 3 (3.49%) VMware
7 2 (2.33%) Apple
7 2 (2.33%) Dell
7 2 (2.33%) IBM
7 2 (2.33%) PTC
7 2 (2.33%) Snow
8 1 (1.16%) CheckPoint
8 1 (1.16%) HP
8 1 (1.16%) mParticle
8 1 (1.16%) Netskope
8 1 (1.16%) Nokia