Disaster Recovery Jobs in the North of England

Disaster Recovery
England > North of England

The table below provides summary statistics for permanent job vacancies advertised in the North of England requiring Disaster Recovery skills. It includes a benchmarking guide to the annual salaries offered in vacancies that cited Disaster Recovery over the 6 months leading up to 30 May 2025, comparing them to the same period in the previous two years.

6 months to
30 May 2025
Same period 2024 Same period 2023
Rank 265 153 219
Rank change year-on-year -112 +66 -30
Permanent jobs citing Disaster Recovery 82 301 231
As % of all permanent jobs advertised in the North of England 0.70% 1.64% 1.40%
As % of the Processes & Methodologies category 0.75% 2.01% 1.44%
Number of salaries quoted 69 285 166
10th Percentile £32,000 £31,125 £32,200
25th Percentile £46,875 £38,750 £37,353
Median annual salary (50th Percentile) £55,000 £46,066 £45,000
Median % change year-on-year +19.39% +2.37% -
75th Percentile £65,000 £61,250 £60,000
90th Percentile £74,608 £69,500 £64,375
England median annual salary £62,500 £55,000 £57,500
% change year-on-year +13.64% -4.35% +4.55%

All Process and Methodology Skills
North of England

Disaster Recovery falls under the Processes and Methodologies category. For comparison with the information above, the following table provides summary statistics for all permanent job vacancies requiring process or methodology skills in the North of England.

Permanent vacancies with a requirement for process or methodology skills 10,999 15,011 15,994
As % of all permanent jobs advertised in the North of England 94.29% 81.77% 96.74%
Number of salaries quoted 5,481 11,439 7,819
10th Percentile £25,087 £27,500 £31,250
25th Percentile £37,500 £36,750 £40,000
Median annual salary (50th Percentile) £50,055 £50,000 £55,000
Median % change year-on-year +0.11% -9.09% +10.00%
75th Percentile £62,000 £65,000 £70,000
90th Percentile £77,500 £79,600 £81,250
England median annual salary £57,500 £55,000 £62,500
% change year-on-year +4.55% -12.00% +4.17%

Disaster Recovery
Job Vacancy Trend in the North of England

Job postings citing Disaster Recovery as a proportion of all IT jobs advertised in the North of England.
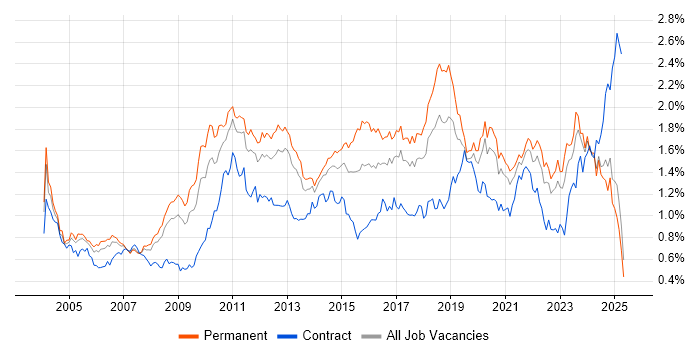
Job vacancy trend for Disaster Recovery in the North of England

Disaster Recovery
Salary Trend in the North of England

3-month moving average salary quoted in jobs citing Disaster Recovery in the North of England.

Salary trend for Disaster Recovery in the North of England

Disaster Recovery
Salary Histogram in the North of England

Salary distribution for jobs citing Disaster Recovery in the North of England over the 6 months to 30 May 2025.

Salary histogram for Disaster Recovery in the North of England

Disaster Recovery
Job Locations in the North of England

The table below looks at the demand and provides a guide to the median salaries quoted in IT jobs citing Disaster Recovery within the North of England region over the 6 months to 30 May 2025. The 'Rank Change' column provides an indication of the change in demand within each location based on the same 6 month period last year.

Location Rank Change
on Same Period
Last Year
Matching
Permanent
IT Job Ads
Median Salary
Past 6 Months
Median Salary
% Change
on Same Period
Last Year
Live
Jobs
North West -124 40 £55,000 +17.02% 167
Yorkshire +15 25 £62,500 +25.00% 126
North East +17 17 £51,250 +13.89% 44
Disaster Recovery
England

Disaster Recovery
Co-occurring Skills and Capabilities in the North of England by Category

The follow tables expand on the table above by listing co-occurrences grouped by category. The same employment type, locality and period is covered with up to 20 co-occurrences shown in each of the following categories:

Application Platforms
1 10 (12.20%) Microsoft Exchange
1 10 (12.20%) SharePoint
2 1 (1.22%) Apache
2 1 (1.22%) Cloud Foundry
2 1 (1.22%) IIS
2 1 (1.22%) nginx
Business Applications
1 1 (1.22%) Oracle EBS
1 1 (1.22%) Payment Gateway
1 1 (1.22%) SAP GRC
1 1 (1.22%) SAP S/4HANA
Cloud Services
1 36 (43.90%) Azure
2 27 (32.93%) Microsoft 365
3 15 (18.29%) AWS
4 12 (14.63%) GCP
5 4 (4.88%) Entra ID
5 4 (4.88%) GitHub
6 2 (2.44%) Azure Data Factory
6 2 (2.44%) Nutanix
7 1 (1.22%) Amazon S3
7 1 (1.22%) Cloudflare
7 1 (1.22%) Datadog
7 1 (1.22%) Google Analytics
7 1 (1.22%) Microsoft Copilot
7 1 (1.22%) OneDrive
7 1 (1.22%) Power Platform
7 1 (1.22%) Rubrik
7 1 (1.22%) Stripe
Communications & Networking
1 21 (25.61%) Firewall
2 15 (18.29%) DNS
3 13 (15.85%) DHCP
3 13 (15.85%) VPN
4 7 (8.54%) Intrusion Detection
4 7 (8.54%) Network Security
5 6 (7.32%) NAS
5 6 (7.32%) SAN
6 5 (6.10%) VSAN
7 4 (4.88%) WAN
8 3 (3.66%) IPv4
8 3 (3.66%) LAN
8 3 (3.66%) VLAN
9 1 (1.22%) MPLS
9 1 (1.22%) VoIP
9 1 (1.22%) VXLAN
9 1 (1.22%) Wireless
Database & Business Intelligence
1 16 (19.51%) SQL Server
2 9 (10.98%) PostgreSQL
3 8 (9.76%) MongoDB
4 7 (8.54%) NoSQL
5 5 (6.10%) MySQL
6 3 (3.66%) Amazon RDS
6 3 (3.66%) Azure SQL Database
6 3 (3.66%) RDBMS
6 3 (3.66%) Relational Database
6 3 (3.66%) SQL Server Integration Services
7 2 (2.44%) Elasticsearch
7 2 (2.44%) Oracle Database
8 1 (1.22%) Cloud Spanner
8 1 (1.22%) Couchbase
8 1 (1.22%) Redis
8 1 (1.22%) SAP HANA
Development Applications
1 5 (6.10%) Jenkins
1 5 (6.10%) Oracle Forms
2 3 (3.66%) Bitbucket
2 3 (3.66%) GitLab
2 3 (3.66%) JIRA
3 1 (1.22%) Git
3 1 (1.22%) Jaeger
General
1 29 (35.37%) Social Skills
2 15 (18.29%) Finance
3 12 (14.63%) Manufacturing
4 9 (10.98%) Banking
5 6 (7.32%) Law
5 6 (7.32%) Pharmaceutical
6 3 (3.66%) Retail
7 2 (2.44%) Advertising
7 2 (2.44%) Analytical Skills
7 2 (2.44%) Legal
7 2 (2.44%) Telecoms
8 1 (1.22%) Marketing
8 1 (1.22%) Organisational Skills
Job Titles
1 12 (14.63%) Infrastructure Engineer
1 12 (14.63%) Senior
2 11 (13.41%) Cloud Engineer
3 8 (9.76%) Architect
3 8 (9.76%) DBA
4 7 (8.54%) IT Engineer
4 7 (8.54%) Security Engineer
5 6 (7.32%) 2nd Line Support
5 6 (7.32%) AWS Architect
5 6 (7.32%) AWS DevOps
5 6 (7.32%) AWS Solution Architect
5 6 (7.32%) Cloud Infrastructure Engineer
5 6 (7.32%) DevOps Architect
5 6 (7.32%) Information Security Consultant
5 6 (7.32%) Security Consultant
5 6 (7.32%) Senior Architect
5 6 (7.32%) Senior DevOps
5 6 (7.32%) Senior Solutions Architect
5 6 (7.32%) SQL DBA
5 6 (7.32%) TOGAF Architect
Libraries, Frameworks & Software Standards
1 10 (12.20%) Middleware
2 2 (2.44%) .NET
2 2 (2.44%) LDAP
2 2 (2.44%) RESTful
2 2 (2.44%) SOAP
2 2 (2.44%) Software Packaging
3 1 (1.22%) ARM Templates
3 1 (1.22%) FIDO
3 1 (1.22%) JWT
3 1 (1.22%) Laravel
3 1 (1.22%) LEMP Stack
3 1 (1.22%) Loki
3 1 (1.22%) Memcached
3 1 (1.22%) OAuth
3 1 (1.22%) OAuth2
3 1 (1.22%) OpenID
3 1 (1.22%) RabbitMQ
3 1 (1.22%) SAML
3 1 (1.22%) SAP Fiori
3 1 (1.22%) Vue
Miscellaneous
1 12 (14.63%) Cyber Threat
2 7 (8.54%) Cloud Native
2 7 (8.54%) Management Information System
3 6 (7.32%) Cyberattack
3 6 (7.32%) Data Protection Act
3 6 (7.32%) Hybrid Cloud
4 5 (6.10%) Data Centre
5 3 (3.66%) FMCG
5 3 (3.66%) Operational Technology
6 2 (2.44%) Clustering
6 2 (2.44%) Driving Licence
6 2 (2.44%) Security Posture
7 1 (1.22%) Algorithms
7 1 (1.22%) Cyber Security Posture
7 1 (1.22%) Data Structures
7 1 (1.22%) Distributed Denial-of-Service
7 1 (1.22%) Learning Management System
7 1 (1.22%) Mobile App
7 1 (1.22%) Public Cloud
7 1 (1.22%) Self-Motivation
Operating Systems
1 27 (32.93%) Windows
2 19 (23.17%) Windows Server
3 16 (19.51%) Linux
4 4 (4.88%) Unix
5 2 (2.44%) Red Hat Enterprise Linux
6 1 (1.22%) AIX
6 1 (1.22%) CentOS
6 1 (1.22%) Debian
6 1 (1.22%) Mac OS
6 1 (1.22%) Solaris
6 1 (1.22%) Ubuntu
6 1 (1.22%) Windows 10
6 1 (1.22%) Windows Server 2008
6 1 (1.22%) Windows Server 2019
Processes & Methodologies
1 27 (32.93%) Business Continuity
2 21 (25.61%) Problem-Solving
3 19 (23.17%) Infrastructure Engineering
4 16 (19.51%) Agile
5 11 (13.41%) Architectural Design
5 11 (13.41%) CI/CD
5 11 (13.41%) High Availability
5 11 (13.41%) Incident Management
5 11 (13.41%) Mentoring
6 10 (12.20%) Cybersecurity
6 10 (12.20%) Information Security
7 9 (10.98%) Customer Service
7 9 (10.98%) DevOps
7 9 (10.98%) Incident Response
7 9 (10.98%) Root Cause Analysis
8 8 (9.76%) Data Protection
8 8 (9.76%) Patch Management
8 8 (9.76%) Performance Optimisation
9 7 (8.54%) Identity Access Management
9 7 (8.54%) Security Testing
Programming Languages
1 24 (29.27%) SQL
2 13 (15.85%) PowerShell
3 9 (10.98%) Java
4 8 (9.76%) C#
4 8 (9.76%) Python
5 6 (7.32%) T-SQL
6 3 (3.66%) Bash
7 1 (1.22%) Go
7 1 (1.22%) PHP
7 1 (1.22%) PL/SQL
7 1 (1.22%) Rust
Qualifications
1 13 (15.85%) Azure Certification
2 9 (10.98%) Microsoft Certification
3 6 (7.32%) AWS Certification
3 6 (7.32%) AWS Certified Solutions Architect
3 6 (7.32%) VMware Certified Professional (VCP)
4 4 (4.88%) Degree
5 3 (3.66%) DBS Check
6 2 (2.44%) Cisco Certification
7 1 (1.22%) CCNA
7 1 (1.22%) CCNP
7 1 (1.22%) CISM
7 1 (1.22%) CISSP
7 1 (1.22%) DV Cleared
7 1 (1.22%) GIAC
7 1 (1.22%) HP ASE
7 1 (1.22%) ITIL Certification
7 1 (1.22%) MCSE
7 1 (1.22%) NCIE
7 1 (1.22%) SC Cleared
7 1 (1.22%) Security Cleared
Quality Assurance & Compliance
1 23 (28.05%) GDPR
2 15 (18.29%) ISO/IEC 27001
3 13 (15.85%) NIST
4 8 (9.76%) Cyber Essentials
5 6 (7.32%) HIPAA
5 6 (7.32%) ISO/IEC 27002 (supersedes ISO/IEC 17799)
6 3 (3.66%) PCI DSS
7 2 (2.44%) Cyber Essentials PLUS
7 2 (2.44%) Data Quality
7 2 (2.44%) QA
8 1 (1.22%) California Consumer Privacy Act
8 1 (1.22%) COBIT
8 1 (1.22%) GRC
8 1 (1.22%) ISO 22301
8 1 (1.22%) ISO 9001
System Software
1 20 (24.39%) Active Directory
2 11 (13.41%) Hyper-V
2 11 (13.41%) VMware Infrastructure
3 9 (10.98%) Virtual Machines
4 8 (9.76%) Docker
5 5 (6.10%) VMware NSX
6 2 (2.44%) pfSense
6 2 (2.44%) Squid
6 2 (2.44%) vSphere
7 1 (1.22%) Veritas Cluster Server
7 1 (1.22%) VMware ESXi
Systems Management
1 9 (10.98%) Terraform
2 7 (8.54%) Kubernetes
3 6 (7.32%) Progress Chef
4 3 (3.66%) Microsoft Intune
5 2 (2.44%) Ansible
5 2 (2.44%) Kibana
5 2 (2.44%) NetBackup
6 1 (1.22%) Grafana
6 1 (1.22%) Oracle RMAN
6 1 (1.22%) Prometheus
6 1 (1.22%) Puppet
6 1 (1.22%) Single Sign-On
6 1 (1.22%) vCenter Server
6 1 (1.22%) VxRail
Vendors
1 28 (34.15%) Microsoft
2 20 (24.39%) VMware
3 12 (14.63%) Google
4 11 (13.41%) Veeam
5 9 (10.98%) Oracle
6 4 (4.88%) ServiceNow
7 3 (3.66%) Informatica
7 3 (3.66%) New Relic
7 3 (3.66%) RedGate
7 3 (3.66%) Talend
8 2 (2.44%) Cisco
8 2 (2.44%) Commvault
8 2 (2.44%) Red Hat
8 2 (2.44%) SAP
9 1 (1.22%) Apple
9 1 (1.22%) Dell
9 1 (1.22%) EMC
9 1 (1.22%) HP
9 1 (1.22%) NetApp
9 1 (1.22%) Veritas