PowerShell Jobs in the North of England

Windows PowerShell
England > North of England

The table below provides summary statistics for permanent job vacancies advertised in the North of England requiring PowerShell skills. It includes a benchmarking guide to the annual salaries offered in vacancies that cited PowerShell over the 6 months leading up to 19 March 2025, comparing them to the same period in the previous two years.

6 months to
19 Mar 2025
Same period 2024 Same period 2023
Rank 169 127 99
Rank change year-on-year -42 -28 -2
Permanent jobs citing PowerShell 145 316 641
As % of all permanent jobs advertised in the North of England 1.40% 2.03% 3.51%
As % of the Programming Languages category 5.84% 6.67% 8.09%
Number of salaries quoted 116 264 451
10th Percentile £37,250 £30,150 £33,750
25th Percentile £42,188 £37,500 £39,125
Median annual salary (50th Percentile) £52,500 £50,000 £50,000
Median % change year-on-year +5.00% - +5.26%
75th Percentile £67,500 £61,563 £65,000
90th Percentile £75,068 £77,500 £88,750
England median annual salary £62,000 £55,000 £60,000
% change year-on-year +12.73% -8.33% -

All Programming Languages
North of England

PowerShell falls under the Programming Languages category. For comparison with the information above, the following table provides summary statistics for all permanent job vacancies requiring coding skills in the North of England.

Permanent vacancies with a requirement for coding skills 2,484 4,740 7,920
As % of all permanent jobs advertised in the North of England 24.06% 30.51% 43.39%
Number of salaries quoted 1,866 3,909 3,887
10th Percentile £35,000 £32,500 £35,000
25th Percentile £42,500 £41,250 £42,500
Median annual salary (50th Percentile) £52,500 £52,500 £55,000
Median % change year-on-year - -4.55% +4.76%
75th Percentile £69,938 £68,750 £70,000
90th Percentile £86,250 £80,000 £85,000
England median annual salary £62,500 £60,000 £65,000
% change year-on-year +4.17% -7.69% +4.00%

PowerShell
Job Vacancy Trend in the North of England

Job postings citing PowerShell as a proportion of all IT jobs advertised in the North of England.
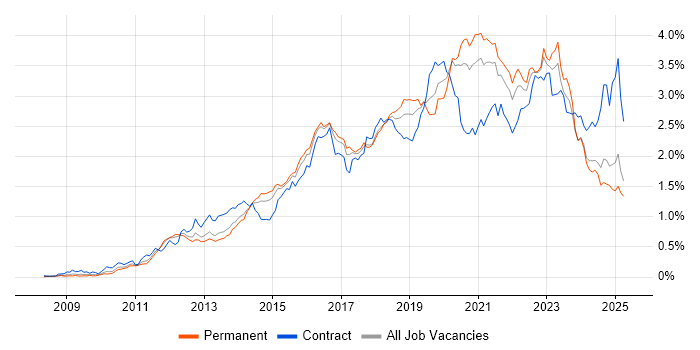
Job vacancy trend for PowerShell in the North of England

PowerShell
Salary Trend in the North of England

3-month moving average salary quoted in jobs citing PowerShell in the North of England.

Salary trend for PowerShell in the North of England

PowerShell
Salary Histogram in the North of England

Salary distribution for jobs citing PowerShell in the North of England over the 6 months to 19 March 2025.

Salary histogram for PowerShell in the North of England

PowerShell
Job Locations in the North of England

The table below looks at the demand and provides a guide to the median salaries quoted in IT jobs citing PowerShell within the North of England region over the 6 months to 19 March 2025. The 'Rank Change' column provides an indication of the change in demand within each location based on the same 6 month period last year.

Location Rank Change
on Same Period
Last Year
Matching
Permanent
IT Job Ads
Median Salary
Past 6 Months
Median Salary
% Change
on Same Period
Last Year
Live
Jobs
North West -35 82 £48,306 -7.99% 44
Yorkshire +8 50 £52,500 +10.53% 23
North East +17 13 £60,000 +20.00% 9
PowerShell
England

PowerShell
Co-occurring Skills and Capabilities in the North of England by Category

The follow tables expand on the table above by listing co-occurrences grouped by category. The same employment type, locality and period is covered with up to 20 co-occurrences shown in each of the following categories:

Application Platforms
1 35 (24.14%) Microsoft Exchange
2 24 (16.55%) SharePoint
3 8 (5.52%) Confluence
4 3 (2.07%) nginx
5 2 (1.38%) Apache
5 2 (1.38%) IIS
5 2 (1.38%) SharePoint Server
Applications
1 3 (2.07%) Microsoft Office
2 1 (0.69%) Acrobat
Business Applications
1 2 (1.38%) Remedy ITSM
1 2 (1.38%) Sage 50
2 1 (0.69%) Oracle Applications
Cloud Services
1 80 (55.17%) Azure
2 49 (33.79%) Microsoft 365
3 32 (22.07%) AWS
4 24 (16.55%) Entra ID
5 17 (11.72%) Power Platform
6 16 (11.03%) Azure DevOps
7 13 (8.97%) GCP
8 11 (7.59%) Power Automate
9 9 (6.21%) PowerApps
10 7 (4.83%) AWS CloudFormation
10 7 (4.83%) PaaS
11 6 (4.14%) OneDrive
12 5 (3.45%) GitHub
13 4 (2.76%) Azure Monitor
13 4 (2.76%) Cloud Computing
13 4 (2.76%) IaaS
14 3 (2.07%) Amazon ECS
14 3 (2.07%) Dynamics 365
14 3 (2.07%) Microsoft Copilot
14 3 (2.07%) SaaS
Communications & Networking
1 43 (29.66%) Firewall
2 24 (16.55%) DNS
3 20 (13.79%) WAN
4 18 (12.41%) VPN
5 17 (11.72%) DHCP
6 16 (11.03%) LAN
6 16 (11.03%) TCP/IP
7 15 (10.34%) VLAN
8 13 (8.97%) Network Security
9 11 (7.59%) BGP
9 11 (7.59%) OSPF
10 10 (6.90%) SAN
11 9 (6.21%) IPv4
11 9 (6.21%) MPLS
11 9 (6.21%) SD-WAN
12 6 (4.14%) VoIP
13 5 (3.45%) RS-232
13 5 (3.45%) RS-422
13 5 (3.45%) Software-Defined Radio
13 5 (3.45%) Wireless
Database & Business Intelligence
1 15 (10.34%) SQL Server
2 9 (6.21%) Azure SQL Database
3 6 (4.14%) Power BI
4 4 (2.76%) Data Lake
5 3 (2.07%) MySQL
5 3 (2.07%) SQL Server Reporting Services
6 2 (1.38%) Amazon RDS
6 2 (1.38%) Amazon Redshift
6 2 (1.38%) Apache Cassandra
6 2 (1.38%) BigQuery
6 2 (1.38%) MariaDB
7 1 (0.69%) MongoDB
7 1 (0.69%) Oracle Reports
7 1 (0.69%) PostgreSQL
7 1 (0.69%) Relational Database
7 1 (0.69%) SQL Server Analysis Services
7 1 (0.69%) SQL Server Integration Services
7 1 (0.69%) Tableau
Development Applications
1 11 (7.59%) JIRA
2 10 (6.90%) Jenkins
3 5 (3.45%) GitLab
3 5 (3.45%) LabVIEW
4 4 (2.76%) Octopus Deploy
5 3 (2.07%) Bitbucket
5 3 (2.07%) Git
5 3 (2.07%) TeamCity
6 2 (1.38%) Artifactory
6 2 (1.38%) SonarQube
7 1 (0.69%) Oracle Forms
General
1 41 (28.28%) Social Skills
2 28 (19.31%) Finance
3 14 (9.66%) Analytical Skills
3 14 (9.66%) Retail
4 12 (8.28%) Legal
5 7 (4.83%) Aerospace
5 7 (4.83%) Telecoms
6 6 (4.14%) Advertising
6 6 (4.14%) Public Sector
7 5 (3.45%) Banking
7 5 (3.45%) Electronics
7 5 (3.45%) Military
8 4 (2.76%) Automotive
8 4 (2.76%) Manufacturing
9 3 (2.07%) Inclusion and Diversity
10 2 (1.38%) Games
10 2 (1.38%) Organisational Skills
11 1 (0.69%) Billing
11 1 (0.69%) Marketing
11 1 (0.69%) Publishing
Job Titles
1 25 (17.24%) Infrastructure Engineer
2 17 (11.72%) Analyst
3 15 (10.34%) Senior
4 14 (9.66%) IT Engineer
5 11 (7.59%) DevOps Engineer
6 10 (6.90%) Cloud Engineer
6 10 (6.90%) IT Infrastructure Engineer
6 10 (6.90%) Lead
7 9 (6.21%) IT Support
8 8 (5.52%) Developer
9 7 (4.83%) Support Engineer
10 6 (4.14%) Consultant
10 6 (4.14%) DBA
10 6 (4.14%) Infrastructure Manager
10 6 (4.14%) Microsoft 365 Engineer
10 6 (4.14%) Security Engineer
11 5 (3.45%) 3rd Line Engineer
11 5 (3.45%) Cloud Consultant
11 5 (3.45%) DevOps Consultant
11 5 (3.45%) Digital Hardware Engineer
Libraries, Frameworks & Software Standards
1 12 (8.28%) ARM Templates
2 6 (4.14%) .NET
3 3 (2.07%) .NET Core
3 3 (2.07%) .NET Framework
3 3 (2.07%) Elastic Stack
3 3 (2.07%) REST
4 2 (1.38%) Azure Blueprints
4 2 (1.38%) Kafka
4 2 (1.38%) Regular Expression
4 2 (1.38%) YAML
5 1 (0.69%) ADO
5 1 (0.69%) ASP.NET
5 1 (0.69%) ASP.NET MVC
5 1 (0.69%) ASP.NET Web API
5 1 (0.69%) AWS CDK
5 1 (0.69%) JSON
5 1 (0.69%) LAMP
5 1 (0.69%) NancyFx
5 1 (0.69%) React
5 1 (0.69%) SPFx
Miscellaneous
1 13 (8.97%) Data Centre
2 10 (6.90%) Public Cloud
3 8 (5.52%) Management Information System
4 7 (4.83%) Hybrid Cloud
5 5 (3.45%) Cloud Native
5 5 (3.45%) Distributed Systems
5 5 (3.45%) Fibre Optics
6 4 (2.76%) Hedge funds
7 3 (2.07%) Enterprise Software
7 3 (2.07%) Onboarding
8 2 (1.38%) Clustering
8 2 (1.38%) Cyber Threat
8 2 (1.38%) Life Science
8 2 (1.38%) Low-Code
8 2 (1.38%) PKI
8 2 (1.38%) Security Operations Centre
8 2 (1.38%) Security Posture
9 1 (0.69%) CMDB
9 1 (0.69%) IVR
9 1 (0.69%) Video Conferencing
Operating Systems
1 67 (46.21%) Windows
2 44 (30.34%) Linux
3 31 (21.38%) Windows Server
4 17 (11.72%) Unix
5 12 (8.28%) Mac OS
5 12 (8.28%) Windows Server 2019
6 9 (6.21%) VMS
6 9 (6.21%) Windows 10
7 6 (4.14%) Ubuntu
7 6 (4.14%) Windows Server 2008
7 6 (4.14%) Windows Server 2016
8 5 (3.45%) VxWorks
9 3 (2.07%) CentOS
10 2 (1.38%) Debian
11 1 (0.69%) Android
11 1 (0.69%) Apple iOS
11 1 (0.69%) Windows 7
Processes & Methodologies
1 47 (32.41%) Problem-Solving
2 40 (27.59%) DevOps
3 33 (22.76%) Infrastructure Engineering
4 32 (22.07%) CI/CD
4 32 (22.07%) Infrastructure as Code
5 29 (20.00%) Agile
6 22 (15.17%) Incident Management
7 20 (13.79%) Containerisation
7 20 (13.79%) Migration
8 18 (12.41%) Disaster Recovery
8 18 (12.41%) ITSM
9 17 (11.72%) Cybersecurity
10 15 (10.34%) Project Delivery
11 14 (9.66%) Mentoring
11 14 (9.66%) Task Automation
12 12 (8.28%) Business Continuity
12 12 (8.28%) ITIL
13 11 (7.59%) Computer Science
14 10 (6.90%) Application Packaging
14 10 (6.90%) Information Security
Programming Languages
1 46 (31.72%) Python
2 36 (24.83%) SQL
3 25 (17.24%) Bash
4 12 (8.28%) Bicep
4 12 (8.28%) Java
5 9 (6.21%) C#
6 6 (4.14%) Perl
7 5 (3.45%) C
7 5 (3.45%) JavaScript
7 5 (3.45%) MATLAB
7 5 (3.45%) TypeScript
8 3 (2.07%) T-SQL
9 2 (1.38%) Kusto Query Language
9 2 (1.38%) VBScript
10 1 (0.69%) Go
10 1 (0.69%) PHP
10 1 (0.69%) PL/SQL
10 1 (0.69%) Shell Script
10 1 (0.69%) VB
10 1 (0.69%) VB.NET
Qualifications
1 31 (21.38%) Degree
2 17 (11.72%) Azure Certification
3 15 (10.34%) Security Cleared
4 9 (6.21%) Computer Science Degree
4 9 (6.21%) SC Cleared
5 8 (5.52%) AWS Certification
5 8 (5.52%) Cisco Certification
5 8 (5.52%) DV Cleared
5 8 (5.52%) Microsoft Certification
6 7 (4.83%) Network+ Certification
7 5 (3.45%) CCNA
8 4 (2.76%) CCNP
9 3 (2.07%) CISSP
9 3 (2.07%) Linux+ Certification
9 3 (2.07%) MCSE
9 3 (2.07%) RHCE
10 2 (1.38%) CEH
10 2 (1.38%) GCIH
10 2 (1.38%) GIAC
10 2 (1.38%) VMware Certified Professional (VCP)
Quality Assurance & Compliance
1 11 (7.59%) GDPR
2 7 (4.83%) HIPAA
3 6 (4.14%) ISO/IEC 27001
3 6 (4.14%) NIST
4 4 (2.76%) QA
4 4 (2.76%) SOC 2
5 3 (2.07%) PCI DSS
6 1 (0.69%) Accessibility
6 1 (0.69%) Cyber Essentials
6 1 (0.69%) NCSC
6 1 (0.69%) SLA
System Software
1 59 (40.69%) Active Directory
2 30 (20.69%) Hyper-V
3 21 (14.48%) Docker
4 18 (12.41%) VMware Infrastructure
5 14 (9.66%) Virtual Machines
6 9 (6.21%) Virtual Desktop
7 6 (4.14%) VMware ESXi
7 6 (4.14%) vSphere
8 3 (2.07%) Dovecot
8 3 (2.07%) Postfix
9 2 (1.38%) Firmware
9 2 (1.38%) Microsoft Virtual Server
9 2 (1.38%) Virtual Servers
9 2 (1.38%) VMware NSX
10 1 (0.69%) BitLocker
10 1 (0.69%) Microsoft App-V
10 1 (0.69%) RHEV
Systems Management
1 37 (25.52%) Terraform
2 30 (20.69%) Kubernetes
3 21 (14.48%) Ansible
4 16 (11.03%) Microsoft Intune
5 12 (8.28%) SCCM
6 10 (6.90%) WSUS
7 7 (4.83%) Puppet
8 6 (4.14%) vCenter Server
9 5 (3.45%) FortiGate
9 5 (3.45%) SCOM
10 4 (2.76%) SCOrch
11 3 (2.07%) Docker Swarm
11 3 (2.07%) Grafana
12 2 (1.38%) Failover Clustering
12 2 (1.38%) Progress Chef
13 1 (0.69%) Active Directory Federation Services
13 1 (0.69%) Cacti
13 1 (0.69%) Control-M
13 1 (0.69%) Jamf Pro
Vendors
1 55 (37.93%) Microsoft
2 33 (22.76%) VMware
3 16 (11.03%) Veeam
4 10 (6.90%) Atlassian
4 10 (6.90%) Cisco
5 9 (6.21%) iManage
6 5 (3.45%) Draytek
6 5 (3.45%) Nimble Storage
6 5 (3.45%) Ubiquiti
7 4 (2.76%) Remedy
8 3 (2.07%) Okta
8 3 (2.07%) Oracle
8 3 (2.07%) Ping Identity
8 3 (2.07%) Red Hat
8 3 (2.07%) SolarWinds
8 3 (2.07%) Symantec
9 2 (1.38%) Acronis
9 2 (1.38%) Kaseya
9 2 (1.38%) Meraki
9 2 (1.38%) Varonis