Senior Jobs in the North of England

Senior
England > North of England

The median Senior salary in the North of England is £55,000 per year, according to job vacancies posted during the 6 months leading to 7 July 2025.

The table below provides salary benchmarking and summary statistics, comparing them to the same period in the previous two years.

6 months to
7 Jul 2025
Same period 2024 Same period 2023
Rank 5 6 9
Rank change year-on-year +1 +3 +4
Permanent jobs requiring a Senior 2,254 2,861 2,187
As % of all permanent jobs advertised in the North of England 17.13% 14.75% 15.05%
As % of the Job Titles category 19.58% 15.49% 16.88%
Number of salaries quoted 1,328 1,961 1,122
10th Percentile £45,000 £40,000 £42,759
25th Percentile £48,869 £50,000 £51,833
Median annual salary (50th Percentile) £55,000 £60,000 £60,000
Median % change year-on-year -8.33% - +3.45%
75th Percentile £70,000 £70,000 £71,250
90th Percentile £75,000 £79,000 £83,750
England median annual salary £65,000 £62,783 £70,000
% change year-on-year +3.53% -10.31% -

All Permanent IT Job Vacancies
North of England

For comparison with the information above, the following table provides summary statistics for all permanent IT job vacancies in the North of England. Most job vacancies include a discernible job title that can be normalized. As such, the figures in the second row provide an indication of the number of permanent jobs in our overall sample.

Permanent vacancies in the North of England with a recognized job title 11,511 18,467 12,954
% of permanent jobs with a recognized job title 87.47% 95.21% 89.12%
Number of salaries quoted 6,143 13,668 7,967
10th Percentile £25,087 £27,000 £30,500
25th Percentile £35,000 £36,250 £39,335
Median annual salary (50th Percentile) £50,055 £50,000 £54,000
Median % change year-on-year +0.11% -7.41% +8.00%
75th Percentile £63,900 £65,000 £69,136
90th Percentile £77,500 £78,750 £80,551
England median annual salary £55,000 £52,500 £60,000
% change year-on-year +4.76% -12.50% -

Senior
Job Vacancy Trend in the North of England

Job postings that featured Senior in the job title as a proportion of all IT jobs advertised in the North of England.
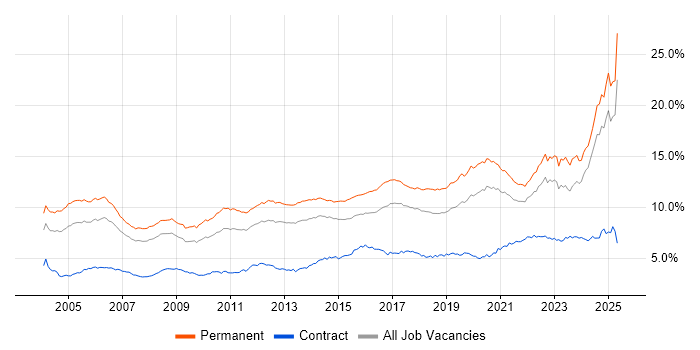
Job vacancy trend for Senior in the North of England

Senior
Salary Trend in the North of England

3-month moving average salary quoted in jobs citing Senior in the North of England.

Salary trend for Senior in the North of England

Senior
Salary Histogram in the North of England

Salary distribution for jobs citing Senior in the North of England over the 6 months to 7 July 2025.

Salary histogram for Senior in the North of England

Senior
Job Locations in the North of England

The table below looks at the demand and provides a guide to the median salaries quoted in IT jobs citing Senior within the North of England region over the 6 months to 7 July 2025. The 'Rank Change' column provides an indication of the change in demand within each location based on the same 6 month period last year.

Location Rank Change
on Same Period
Last Year
Matching
Permanent
IT Job Ads
Median Salary
Past 6 Months
Median Salary
% Change
on Same Period
Last Year
Live
Jobs
North West +2 1,849 £54,793 -8.68% 613
Yorkshire -18 324 £60,000 - 295
North East -8 81 £57,000 -5.00% 86
Senior
England

Senior Skill Set
Top 30 Co-occurring Skills and Capabilities in the North of England

For the 6 months to 7 July 2025, Senior job roles required the following skills and capabilities in order of popularity. The figures indicate the absolute number co-occurrences and as a proportion of all permanent job ads across the North of England region featuring Senior in the job title.

1 1,171 (51.95%) BPSS Clearance
2 921 (40.86%) Degree
3 696 (30.88%) Systems Engineering
4 505 (22.40%) Agile
5 376 (16.68%) Aerospace
6 369 (16.37%) Coaching
7 350 (15.53%) AWS
8 346 (15.35%) Mentoring
9 341 (15.13%) Azure
10 333 (14.77%) HND
11 328 (14.55%) Software Engineering
12 314 (13.93%) Python
13 288 (12.78%) Social Skills
14 280 (12.42%) JavaScript
15 274 (12.16%) Java
16 264 (11.71%) Mathematics
17 257 (11.40%) Change Management
18 254 (11.27%) .NET
19 248 (11.00%) GCP
20 235 (10.43%) Microservices
21 227 (10.07%) User Experience
22 226 (10.03%) Chartered Engineer
23 223 (9.89%) Microsoft
24 222 (9.85%) Physics
25 218 (9.67%) Linux
26 213 (9.45%) Node.js
27 206 (9.14%) Model-Based Systems Engineering
27 206 (9.14%) HNC
28 205 (9.09%) Scrum
29 202 (8.96%) Machine Learning

Senior Skill Set
Co-occurring Skills and Capabilities in the North of England by Category

The follow tables expand on the table above by listing co-occurrences grouped by category. The same employment type, locality and period is covered with up to 20 co-occurrences shown in each of the following categories:

Application Platforms
1 44 (1.95%) SharePoint
2 25 (1.11%) Confluence
3 17 (0.75%) Apache Spark
4 15 (0.67%) Apache
5 13 (0.58%) Microsoft Exchange
6 8 (0.35%) IIS
7 4 (0.18%) Oracle SOA Suite
8 2 (0.089%) Jupyter
8 2 (0.089%) nginx
8 2 (0.089%) WebLogic
9 1 (0.044%) CMS
9 1 (0.044%) Headless CMS
9 1 (0.044%) Kinematics
9 1 (0.044%) OpenStack
9 1 (0.044%) Oracle Workflow
Applications
1 117 (5.19%) Abaqus
2 93 (4.13%) Microsoft Office
3 86 (3.82%) Simulink
4 45 (2.00%) Mathcad
5 15 (0.67%) Microsoft Excel
6 9 (0.40%) Revit
7 6 (0.27%) AutoCAD
8 5 (0.22%) Microsoft PowerPoint
9 4 (0.18%) Microsoft Project
9 4 (0.18%) MS Visio
10 3 (0.13%) Adobe XD
11 1 (0.044%) Adobe Creative Suite
11 1 (0.044%) Adobe Illustrator
11 1 (0.044%) Chatbot
11 1 (0.044%) InDesign
11 1 (0.044%) Photoshop
11 1 (0.044%) Sketch
Business Applications
1 36 (1.60%) Teamcenter
2 8 (0.35%) Payment Gateway
3 7 (0.31%) Magento
4 6 (0.27%) Infor LN
4 6 (0.27%) NetSuite
4 6 (0.27%) SAP BPC
5 5 (0.22%) Dynamics CRM
5 5 (0.22%) Oracle BPM
6 4 (0.18%) SAP S/4HANA
7 2 (0.089%) Infor CloudSuite
7 2 (0.089%) Infor CloudSuite Industrial (formerly SyteLine)
7 2 (0.089%) Oracle Payroll
7 2 (0.089%) SAP CO
7 2 (0.089%) SAP FI
7 2 (0.089%) SAP FI/CO
8 1 (0.044%) Unit4 Business World
Cloud Services
1 350 (15.53%) AWS
2 341 (15.13%) Azure
3 248 (11.00%) GCP
4 55 (2.44%) Serverless
5 46 (2.04%) Power Platform
6 45 (2.00%) AWS Lambda
7 34 (1.51%) SaaS
8 24 (1.06%) Azure DevOps
8 24 (1.06%) Microsoft 365
9 23 (1.02%) GitHub
10 17 (0.75%) Cloud Computing
11 16 (0.71%) Amazon ECS
12 14 (0.62%) Amazon S3
12 14 (0.62%) Dynamics 365
13 13 (0.58%) AWS CloudFormation
14 11 (0.49%) PaaS
15 10 (0.44%) Azure Machine Learning
15 10 (0.44%) IaaS
15 10 (0.44%) Microsoft Copilot
16 9 (0.40%) Google Analytics
Communications & Networking
1 36 (1.60%) Ethernet
1 36 (1.60%) RS-422
2 25 (1.11%) TCP/IP
3 20 (0.89%) TETRA
4 18 (0.80%) DNS
4 18 (0.80%) Firewall
4 18 (0.80%) VoIP
5 17 (0.75%) DHCP
6 12 (0.53%) Internet
7 11 (0.49%) Broadband
8 10 (0.44%) LAN
8 10 (0.44%) WAN
9 9 (0.40%) SAN
10 8 (0.35%) HTTP
11 5 (0.22%) PPP
11 5 (0.22%) Wireless
12 4 (0.18%) LoRaWAN
12 4 (0.18%) NAS
12 4 (0.18%) Software-Defined Radio
13 3 (0.13%) MQTT
Database & Business Intelligence
1 49 (2.17%) SQL Server
2 39 (1.73%) MySQL
3 31 (1.38%) Power BI
4 27 (1.20%) PostgreSQL
5 25 (1.11%) MongoDB
5 25 (1.11%) NoSQL
6 22 (0.98%) DynamoDB
7 18 (0.80%) Data Warehouse
8 15 (0.67%) Data Lake
9 14 (0.62%) Elasticsearch
10 11 (0.49%) Amazon RDS
10 11 (0.49%) Relational Database
11 10 (0.44%) Cloud Spanner
12 9 (0.40%) Big Data
12 9 (0.40%) Redis
12 9 (0.40%) SQL Server Analysis Services
13 8 (0.35%) SQL Server Reporting Services
14 7 (0.31%) Amazon Redshift
14 7 (0.31%) SQL Server Integration Services
15 6 (0.27%) Oracle Database
Development Applications
1 70 (3.11%) JIRA
2 46 (2.04%) Git
3 36 (1.60%) LabVIEW
4 25 (1.11%) Jenkins
5 8 (0.35%) SonarQube
5 8 (0.35%) Sonatype Nexus
6 7 (0.31%) JUnit
6 7 (0.31%) Selenium
6 7 (0.31%) Visual Studio
7 6 (0.27%) Maven
7 6 (0.27%) Oracle Forms
8 5 (0.22%) GitLab
8 5 (0.22%) NUnit
9 4 (0.18%) Bitbucket
10 3 (0.13%) IBM UrbanCode
10 3 (0.13%) Octopus Deploy
10 3 (0.13%) Storybook
11 2 (0.089%) JDeveloper
11 2 (0.089%) SpecFlow
11 2 (0.089%) TestRail
General
1 376 (16.68%) Aerospace
2 288 (12.78%) Social Skills
3 200 (8.87%) Inclusion and Diversity
4 198 (8.78%) Finance
5 197 (8.74%) Analytical Skills
6 181 (8.03%) Avionics
7 149 (6.61%) Aeronautics
7 149 (6.61%) Automotive
8 83 (3.68%) Manufacturing
9 70 (3.11%) Influencing Skills
10 51 (2.26%) Retail
11 41 (1.82%) Banking
12 39 (1.73%) Public Sector
13 38 (1.69%) Electronics
14 35 (1.55%) Games
15 32 (1.42%) Agriculture
16 30 (1.33%) Marketing
17 29 (1.29%) Documentation Skills
18 19 (0.84%) Law
19 18 (0.80%) Local Government
Libraries, Frameworks & Software Standards
1 254 (11.27%) .NET
2 213 (9.45%) Node.js
3 94 (4.17%) React
4 44 (1.95%) RESTful
5 39 (1.73%) .NET Core
6 38 (1.69%) AngularJS
6 38 (1.69%) CSS
7 35 (1.55%) HTML
8 27 (1.20%) REST
9 26 (1.15%) Spring Boot
10 20 (0.89%) .NET Framework
11 17 (0.75%) Spring
11 17 (0.75%) Vue
11 17 (0.75%) Web Services
12 15 (0.67%) GraphQL
12 15 (0.67%) Kafka
13 12 (0.53%) ASP.NET
13 12 (0.53%) ASP.NET Web API
13 12 (0.53%) Entity Framework
14 11 (0.49%) Next.js
Miscellaneous
1 183 (8.12%) Self-Motivation
2 175 (7.76%) Cyberattack
3 172 (7.63%) Linux Command Line
4 50 (2.22%) Management Information System
5 29 (1.29%) Cloud Native
5 29 (1.29%) SCADA
6 20 (0.89%) Greenfield Project
6 20 (0.89%) Product Ownership
7 19 (0.84%) Distributed Systems
8 15 (0.67%) Algorithms
9 14 (0.62%) Driving Licence
9 14 (0.62%) Public Cloud
10 13 (0.58%) Social Media
11 12 (0.53%) Mobile App
11 12 (0.53%) Renewable Energy
12 11 (0.49%) Virtual Team
13 9 (0.40%) e-Learning
13 9 (0.40%) IoT
13 9 (0.40%) Onboarding
14 8 (0.35%) Analytical Mindset
Operating Systems
1 218 (9.67%) Linux
2 36 (1.60%) VMS
3 34 (1.51%) Windows
4 17 (0.75%) Unix
5 15 (0.67%) Windows Server
6 10 (0.44%) Windows 10
7 8 (0.35%) Windows Server 2016
8 6 (0.27%) Apple iOS
8 6 (0.27%) zOS
9 5 (0.22%) Android
10 4 (0.18%) CentOS
10 4 (0.18%) Mac OS
11 3 (0.13%) Red Hat Enterprise Linux
12 1 (0.044%) Mac OS X
12 1 (0.044%) Oracle Linux
12 1 (0.044%) Solaris
12 1 (0.044%) Windows Server 2008
Processes & Methodologies
1 696 (30.88%) Systems Engineering
2 505 (22.40%) Agile
3 369 (16.37%) Coaching
4 346 (15.35%) Mentoring
5 328 (14.55%) Software Engineering
6 264 (11.71%) Mathematics
7 257 (11.40%) Change Management
8 235 (10.43%) Microservices
9 227 (10.07%) User Experience
10 222 (9.85%) Physics
11 206 (9.14%) Model-Based Systems Engineering
12 205 (9.09%) Scrum
13 202 (8.96%) Machine Learning
14 197 (8.74%) Data Engineering
15 195 (8.65%) Cloud Security
16 188 (8.34%) Requirements Management
17 179 (7.94%) Customer Requirements
17 179 (7.94%) Site Reliability Engineering
18 172 (7.63%) Problem-Solving
19 159 (7.05%) CI/CD
Programming Languages
1 314 (13.93%) Python
2 280 (12.42%) JavaScript
3 274 (12.16%) Java
4 192 (8.52%) Go
5 179 (7.94%) C++
5 179 (7.94%) Rust
6 100 (4.44%) SQL
7 94 (4.17%) TypeScript
8 87 (3.86%) C#
9 46 (2.04%) MATLAB
10 32 (1.42%) PHP
11 15 (0.67%) PowerShell
12 11 (0.49%) R
13 10 (0.44%) Ruby
13 10 (0.44%) T-SQL
14 9 (0.40%) Scala
15 7 (0.31%) Data Analysis Expressions
16 6 (0.27%) Bash
17 4 (0.18%) HLSL
17 4 (0.18%) VB
Qualifications
1 1,171 (51.95%) BPSS Clearance
2 921 (40.86%) Degree
3 333 (14.77%) HND
4 226 (10.03%) Chartered Engineer
5 206 (9.14%) HNC
6 202 (8.96%) Security Cleared
7 187 (8.30%) AWS Certification
8 182 (8.07%) AWS Certified Solutions Architect
9 173 (7.68%) DV Cleared
10 172 (7.63%) AWS Certified Developer
11 99 (4.39%) Master's Degree
12 48 (2.13%) Numerate Degree
13 37 (1.64%) ACCA
14 26 (1.15%) SC Cleared
15 24 (1.06%) CISSP
16 22 (0.98%) Azure Certification
17 21 (0.93%) CIMA
18 16 (0.71%) Computer Science Degree
18 16 (0.71%) Microsoft Certification
19 13 (0.58%) DBS Check
Quality Assurance & Compliance
1 83 (3.68%) IEC 61508
2 61 (2.71%) DO-254
3 39 (1.73%) QA
4 37 (1.64%) ARP4754
5 36 (1.60%) ISO 9001
5 36 (1.60%) ISO/IEC 17025
6 25 (1.11%) GAAP
7 23 (1.02%) HAZOP
8 22 (0.98%) Def Stans
8 22 (0.98%) IFRS
9 19 (0.84%) Data Quality
9 19 (0.84%) GDPR
10 18 (0.80%) NEBOSH
11 17 (0.75%) NIST
12 13 (0.58%) Accessibility
13 10 (0.44%) HIPAA
14 8 (0.35%) ISO/IEC 27001
14 8 (0.35%) Sarbanes-Oxley
15 6 (0.27%) Cyber Essentials
15 6 (0.27%) PMO
System Software
1 87 (3.86%) Docker
2 26 (1.15%) Active Directory
3 17 (0.75%) VMware Infrastructure
4 11 (0.49%) Hyper-V
5 3 (0.13%) VMware ESXi
6 2 (0.089%) VMware NSX
6 2 (0.089%) vSphere
7 1 (0.044%) NFS
7 1 (0.044%) Virtual Servers
Systems Management
1 80 (3.55%) Kubernetes
2 60 (2.66%) Terraform
3 27 (1.20%) Ansible
4 26 (1.15%) Functional Safety
5 12 (0.53%) SCCM
6 8 (0.35%) Istio
6 8 (0.35%) Microsoft Intune
7 7 (0.31%) Prometheus
8 6 (0.27%) AWS Copilot
9 5 (0.22%) Argo
9 5 (0.22%) Progress Chef
9 5 (0.22%) SCOM
10 4 (0.18%) Grafana
11 3 (0.13%) Failover Clustering
11 3 (0.13%) SCOrch
12 2 (0.089%) Single Sign-On
13 1 (0.044%) Jamf Pro
13 1 (0.044%) Microsoft Data Protection Manager
13 1 (0.044%) Puppet
13 1 (0.044%) vCenter Server
Vendors
1 223 (9.89%) Microsoft
2 50 (2.22%) MathWorks
3 49 (2.17%) Google
4 36 (1.60%) ANSYS
5 29 (1.29%) Oracle
6 28 (1.24%) VMware
7 23 (1.02%) SAP
8 18 (0.80%) Siemens
9 17 (0.75%) Bloomberg
9 17 (0.75%) IBM
10 16 (0.71%) ServiceNow
11 13 (0.58%) Cisco
11 13 (0.58%) Salesforce
12 12 (0.53%) Databricks
13 10 (0.44%) Adobe
13 10 (0.44%) New Relic
14 9 (0.40%) Ping Identity
15 8 (0.35%) Infor
16 6 (0.27%) Alteryx
16 6 (0.27%) Cognos