Law Jobs in the North of England

Law
England > North of England

The table below looks at the prevalence of the term Law in permanent job vacancies in the North of England. Included is a benchmarking guide to the salaries offered in vacancies that cited Law over the 6 months leading up to 26 July 2024, comparing them to the same period in the previous two years.

6 months to
26 Jul 2024
Same period 2023 Same period 2022
Rank 56 95 99
Rank change year-on-year +39 +4 -15
Permanent jobs citing Law 539 458 648
As % of all permanent jobs advertised in the North of England 3.31% 3.53% 3.38%
As % of the General category 6.18% 5.25% 5.53%
Number of salaries quoted 439 437 497
10th Percentile £30,960 £29,900 £27,800
25th Percentile £36,500 £36,250 £35,000
Median annual salary (50th Percentile) £50,000 £50,000 £45,000
Median % change year-on-year - +11.11% -3.23%
75th Percentile £65,000 £61,250 £57,500
90th Percentile £75,250 £71,250 £72,500
England median annual salary £51,500 £52,500 £52,000
% change year-on-year -1.90% +0.96% +4.00%

All General Skills
North of England

Law falls under the General Skills category. For comparison with the information above, the following table provides summary statistics for all permanent job vacancies requiring common skills in the North of England.

Permanent vacancies with a requirement for common skills 8,726 8,726 11,708
As % of all permanent jobs advertised in the North of England 53.53% 67.23% 61.10%
Number of salaries quoted 5,690 4,817 6,621
10th Percentile £26,500 £28,500 £27,875
25th Percentile £35,000 £37,500 £37,575
Median annual salary (50th Percentile) £49,137 £52,500 £50,000
Median % change year-on-year -6.41% +5.00% +9.79%
75th Percentile £63,750 £67,500 £66,250
90th Percentile £76,250 £81,250 £81,250
England median annual salary £55,000 £60,000 £60,000
% change year-on-year -8.33% - +4.35%

Law
Job Vacancy Trend in the North of England

Job postings citing Law as a proportion of all IT jobs advertised in the North of England.
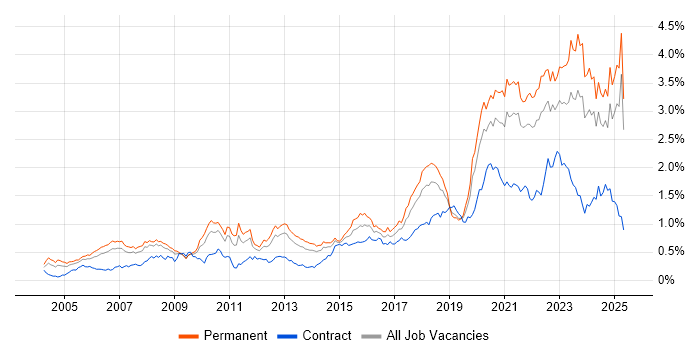
Job vacancy trend for Law in the North of England

Law
Salary Trend in the North of England

3-month moving average salary quoted in jobs citing Law in the North of England.

Salary trend for Law in the North of England

Law
Salary Histogram in the North of England

Salary distribution for jobs citing Law in the North of England over the 6 months to 26 July 2024.

Salary histogram for Law in the North of England

Law
Job Locations in the North of England

The table below looks at the demand and provides a guide to the median salaries quoted in IT jobs citing Law within the North of England region over the 6 months to 26 July 2024. The 'Rank Change' column provides an indication of the change in demand within each location based on the same 6 month period last year.

Location Rank Change
on Same Period
Last Year
Matching
Permanent
IT Job Ads
Median Salary
Past 6 Months
Median Salary
% Change
on Same Period
Last Year
Live
Jobs
North West +36 305 £47,500 -9.52% 49
Yorkshire +39 194 £55,000 +15.79% 34
North East 0 39 £50,000 - 9
Law
England

Law
Co-occurring Skills and Capabilities in the North of England by Category

The follow tables expand on the table above by listing co-occurrences grouped by category. The same employment type, locality and period is covered with up to 20 co-occurrences shown in each of the following categories:

Application Platforms
1 24 (4.45%) SharePoint
2 23 (4.27%) Microsoft Exchange
3 9 (1.67%) Exchange Server 2013
4 5 (0.93%) Confluence
4 5 (0.93%) SharePoint Server
5 3 (0.56%) CMS
6 2 (0.37%) BizTalk Server
Applications
1 32 (5.94%) Microsoft Office
2 17 (3.15%) Microsoft Excel
3 9 (1.67%) Chatbot
4 4 (0.74%) Microsoft PowerPoint
4 4 (0.74%) MS Visio
5 3 (0.56%) Microsoft Project
Business Applications
1 19 (3.53%) Dynamics CRM
2 9 (1.67%) Dynamics AX
3 6 (1.11%) SAP ERP
3 6 (1.11%) SAP HR
4 5 (0.93%) SAP HCM
5 4 (0.74%) SAP S/4HANA
6 3 (0.56%) Primavera
6 3 (0.56%) SAP Payroll
6 3 (0.56%) Workday HCM
7 2 (0.37%) BambooHR
7 2 (0.37%) iTrent
7 2 (0.37%) Oracle ERP
7 2 (0.37%) Visualfiles
8 1 (0.19%) Remedy ITSM
8 1 (0.19%) SAP GRC
8 1 (0.19%) SAP IBP
Cloud Services
1 138 (25.60%) Azure
2 98 (18.18%) Power Platform
3 96 (17.81%) Microsoft 365
4 74 (13.73%) Dynamics 365
5 49 (9.09%) PowerApps
6 42 (7.79%) Entra ID
7 39 (7.24%) Power Automate
8 32 (5.94%) OneDrive
9 21 (3.90%) OCI
10 18 (3.34%) AWS
11 16 (2.97%) Azure Logic Apps
12 12 (2.23%) Azure Data Factory
12 12 (2.23%) Azure DevOps
13 8 (1.48%) SaaS
14 7 (1.30%) Serverless
15 6 (1.11%) Amazon S3
15 6 (1.11%) Azure Stack
16 5 (0.93%) Azure Functions
16 5 (0.93%) ShareGate
17 4 (0.74%) Amazon EKS
Communications & Networking
1 39 (7.24%) LAN
2 26 (4.82%) Firewall
3 17 (3.15%) NAS
3 17 (3.15%) SAN
4 15 (2.78%) Intrusion Detection
4 15 (2.78%) WAN
5 5 (0.93%) DKIM
5 5 (0.93%) DMARC
5 5 (0.93%) Intranet
6 4 (0.74%) Network Security
6 4 (0.74%) Skype
6 4 (0.74%) Wi-Fi
7 2 (0.37%) BGP
7 2 (0.37%) Internet
7 2 (0.37%) MPLS
7 2 (0.37%) OSPF
7 2 (0.37%) SNMP
7 2 (0.37%) TCP/IP
7 2 (0.37%) VPLS
7 2 (0.37%) Wireless
Database & Business Intelligence
1 42 (7.79%) Power BI
2 33 (6.12%) SQL Server
3 25 (4.64%) QlikView
4 21 (3.90%) Data Lake
5 19 (3.53%) Power Query
6 15 (2.78%) Data Warehouse
7 12 (2.23%) SQL Server Reporting Services
8 10 (1.86%) SQL Server Integration Services
9 6 (1.11%) MySQL
9 6 (1.11%) OLAP
10 5 (0.93%) Amazon RDS
11 4 (0.74%) OLTP
11 4 (0.74%) Oracle Reports
12 3 (0.56%) Azure SQL Data Warehouse
12 3 (0.56%) SAP HANA
13 2 (0.37%) Azure SQL Database
13 2 (0.37%) Oracle Database
13 2 (0.37%) RDBMS
13 2 (0.37%) Relational Database
13 2 (0.37%) Tableau
Development Applications
1 5 (0.93%) JIRA
1 5 (0.93%) Visual Studio
2 4 (0.74%) Cypress.io
2 4 (0.74%) Selenium
2 4 (0.74%) WebDriver
3 3 (0.56%) Eclipse
3 3 (0.56%) GitLab
3 3 (0.56%) Jenkins
3 3 (0.56%) Team Foundation Server
4 2 (0.37%) Atlassian Bamboo
5 1 (0.19%) Git
5 1 (0.19%) Maven
General
1 159 (29.50%) Social Skills
2 65 (12.06%) Analytical Skills
3 64 (11.87%) Legal
4 53 (9.83%) Finance
5 30 (5.57%) Marketing
6 23 (4.27%) Manufacturing
7 18 (3.34%) Inclusion and Diversity
8 10 (1.86%) Banking
9 7 (1.30%) Public Sector
10 6 (1.11%) Aerospace
10 6 (1.11%) General Ledger
10 6 (1.11%) Military
11 5 (0.93%) Organisational Skills
11 5 (0.93%) Telecoms
12 4 (0.74%) Digital Economy
13 3 (0.56%) Front Office
13 3 (0.56%) Online Betting
13 3 (0.56%) Presentation Skills
13 3 (0.56%) Retail
14 2 (0.37%) Billing
Job Titles
1 110 (20.41%) Developer
2 80 (14.84%) Analyst
3 54 (10.02%) Lead
4 44 (8.16%) Senior
5 28 (5.19%) Consultant
5 28 (5.19%) Technical Specialist
6 26 (4.82%) Support Specialist
7 23 (4.27%) Infrastructure Specialist
7 23 (4.27%) Technical Support
7 23 (4.27%) Technical Support Specialist
8 22 (4.08%) Proclaim Developer
9 20 (3.71%) Team Leader
10 16 (2.97%) Infrastructure Engineer
11 15 (2.78%) Dynamics 365 Developer
11 15 (2.78%) Systems Analyst
12 14 (2.60%) .NET Developer
13 13 (2.41%) Automation Developer
13 13 (2.41%) C# Developer
13 13 (2.41%) Service Analyst
13 13 (2.41%) Support Analyst
Libraries, Frameworks & Software Standards
1 40 (7.42%) .NET
2 17 (3.15%) .NET Core
3 16 (2.97%) Node.js
4 14 (2.60%) Oracle Fusion
5 13 (2.41%) HTML
5 13 (2.41%) HTML5 Canvas
6 12 (2.23%) React
7 8 (1.48%) .NET Framework
8 7 (1.30%) JSON
8 7 (1.30%) Twitter Bootstrap
9 6 (1.11%) CSS
9 6 (1.11%) REST
9 6 (1.11%) Web Services
9 6 (1.11%) XML
10 4 (0.74%) Entity Framework
10 4 (0.74%) Vue
11 3 (0.56%) ADO
11 3 (0.56%) AngularJS
11 3 (0.56%) Redux
12 2 (0.37%) HTML5
Miscellaneous
1 31 (5.75%) Management Information System
2 16 (2.97%) Data Centre
3 12 (2.23%) Life Science
3 12 (2.23%) Low-Code
4 6 (1.11%) Distributed Systems
4 6 (1.11%) Enterprise Software
4 6 (1.11%) Fat Client
4 6 (1.11%) Mobile App
4 6 (1.11%) Product Ownership
4 6 (1.11%) Replication
4 6 (1.11%) Thin Client
5 5 (0.93%) Cyber Threat
5 5 (0.93%) IoT
6 4 (0.74%) Blockchain
6 4 (0.74%) Cybercrime
6 4 (0.74%) N-Tier
6 4 (0.74%) Onboarding
6 4 (0.74%) Social Media
7 3 (0.56%) Data Structures
7 3 (0.56%) Market Risk
Operating Systems
1 82 (15.21%) Windows
2 43 (7.98%) Windows Server
3 12 (2.23%) Windows 10
4 9 (1.67%) Linux
5 7 (1.30%) Windows Server 2012
5 7 (1.30%) Windows Server 2016
6 4 (0.74%) Windows 7
6 4 (0.74%) Windows Server 2019
7 3 (0.56%) Apple iOS
7 3 (0.56%) Windows 8
7 3 (0.56%) Windows Server 2008
8 2 (0.37%) Android
8 2 (0.37%) Unix
8 2 (0.37%) VMS
Processes & Methodologies
1 97 (18.00%) Problem-Solving
2 79 (14.66%) Agile
3 54 (10.02%) Migration
4 49 (9.09%) Cybersecurity
4 49 (9.09%) DevOps
5 45 (8.35%) Business Intelligence
6 44 (8.16%) Mentoring
7 43 (7.98%) Scrum
8 37 (6.86%) CRM
9 33 (6.12%) ERP
9 33 (6.12%) ITIL
10 31 (5.75%) Project Management
11 30 (5.57%) Customer Service
12 27 (5.01%) Collaborative Culture
12 27 (5.01%) Continuous Improvement
12 27 (5.01%) Infrastructure Engineering
13 26 (4.82%) Information Security
14 23 (4.27%) Business Development
14 23 (4.27%) Incident Response
14 23 (4.27%) Roadmaps
Programming Languages
1 65 (12.06%) SQL
2 50 (9.28%) C#
3 26 (4.82%) JavaScript
4 21 (3.90%) Python
5 19 (3.53%) PowerShell
6 9 (1.67%) Java
7 7 (1.30%) PHP
7 7 (1.30%) T-SQL
8 4 (0.74%) VB.NET
9 3 (0.56%) Shell Script
9 3 (0.56%) TypeScript
10 2 (0.37%) Bash
10 2 (0.37%) Data Analysis Expressions
10 2 (0.37%) PL/SQL
11 1 (0.19%) Kusto Query Language
11 1 (0.19%) Swift
11 1 (0.19%) VBA
Qualifications
1 62 (11.50%) Degree
2 23 (4.27%) HNC
2 23 (4.27%) HND
3 19 (3.53%) Security Cleared
4 9 (1.67%) Computer Science Degree
5 8 (1.48%) Microsoft Certification
6 5 (0.93%) CompTIA Security+
6 5 (0.93%) Master's Degree
7 3 (0.56%) CIPD
7 3 (0.56%) Cisco Certification
7 3 (0.56%) OSCP
7 3 (0.56%) SC Cleared
8 2 (0.37%) Azure Certification
8 2 (0.37%) CCA
8 2 (0.37%) CCNA
8 2 (0.37%) CCNP
8 2 (0.37%) CREST Certified
8 2 (0.37%) ITIL Certification
8 2 (0.37%) PMI Certification
8 2 (0.37%) SSCP
Quality Assurance & Compliance
1 22 (4.08%) GDPR
2 14 (2.60%) QA
3 12 (2.23%) ISO/IEC 27001
3 12 (2.23%) SLA
4 10 (1.86%) PCI DSS
5 9 (1.67%) Cyber Essentials
6 6 (1.11%) Data Quality
7 5 (0.93%) Cyber Essentials PLUS
7 5 (0.93%) GRC
7 5 (0.93%) NCSC
7 5 (0.93%) PMO
8 4 (0.74%) NIST
9 2 (0.37%) ISO/IEC 27002 (supersedes ISO/IEC 17799)
10 1 (0.19%) IFRS
10 1 (0.19%) ISO/IEC 17025
10 1 (0.19%) ITGC
10 1 (0.19%) P3O
10 1 (0.19%) Sarbanes-Oxley
10 1 (0.19%) SOC 2
System Software
1 70 (12.99%) Active Directory
2 17 (3.15%) VMware ESXi
3 8 (1.48%) VMware Infrastructure
4 6 (1.11%) Hyper-V
5 5 (0.93%) Terminal Services
6 2 (0.37%) Citrix Hypervisor
6 2 (0.37%) Virtual Machines
6 2 (0.37%) VMware NSX
6 2 (0.37%) XenApp
7 1 (0.19%) Microsoft App-V
7 1 (0.19%) Snort
7 1 (0.19%) XenDesktop
Systems Management
1 17 (3.15%) vCenter Server
2 4 (0.74%) Kubernetes
3 3 (0.56%) Ansible
3 3 (0.56%) Nessus
3 3 (0.56%) Progress Chef
4 2 (0.37%) Microsoft Intune
5 1 (0.19%) EnCase
5 1 (0.19%) FTK
5 1 (0.19%) Prometheus
5 1 (0.19%) SysTrack
5 1 (0.19%) Terraform
Vendors
1 175 (32.47%) Microsoft
2 37 (6.86%) Oracle
3 28 (5.19%) VMware
4 26 (4.82%) SAP
5 12 (2.23%) Citrix
6 9 (1.67%) iManage
7 8 (1.48%) DocuSign
7 8 (1.48%) UiPath
8 6 (1.11%) Databricks
8 6 (1.11%) Ubiquiti
9 5 (0.93%) Palo Alto
9 5 (0.93%) Proofpoint
9 5 (0.93%) Workday
10 4 (0.74%) Sage
10 4 (0.74%) Sophos
11 3 (0.56%) Avaya
11 3 (0.56%) Fortinet
11 3 (0.56%) Informatica
11 3 (0.56%) Nintex
11 3 (0.56%) ServiceNow