Customer Service Jobs in the North of England

Customer Service
England > North of England

The table below provides summary statistics for permanent job vacancies advertised in the North of England requiring Customer Service skills. It includes a benchmarking guide to the annual salaries offered in vacancies that cited Customer Service over the 6 months leading up to 15 August 2025, comparing them to the same period in the previous two years.

6 months to
15 Aug 2025
Same period 2024 Same period 2023
Rank 13 29 52
Rank change year-on-year +16 +23 -19
Permanent jobs citing Customer Service 1,478 916 676
As % of all permanent jobs advertised in the North of England 10.97% 5.84% 5.79%
As % of the Processes & Methodologies category 12.81% 7.38% 6.02%
Number of salaries quoted 953 582 418
10th Percentile £23,504 £22,910 £22,937
25th Percentile £25,084 £25,000 £25,750
Median annual salary (50th Percentile) £25,087 £32,500 £33,500
Median % change year-on-year -22.81% -2.99% -11.21%
75th Percentile £29,500 £46,000 £53,438
90th Percentile £40,000 £57,500 £72,500
England median annual salary £29,500 £34,843 £36,000
% change year-on-year -15.33% -3.21% -10.00%

All Process and Methodology Skills
North of England

Customer Service falls under the Processes and Methodologies category. For comparison with the information above, the following table provides summary statistics for all permanent job vacancies requiring process or methodology skills in the North of England.

Permanent vacancies with a requirement for process or methodology skills 11,542 12,420 11,235
As % of all permanent jobs advertised in the North of England 85.68% 79.17% 96.17%
Number of salaries quoted 5,646 7,840 6,879
10th Percentile £25,087 £29,750 £31,250
25th Percentile £32,000 £38,750 £40,000
Median annual salary (50th Percentile) £49,500 £50,000 £55,000
Median % change year-on-year -1.00% -9.09% +4.76%
75th Percentile £61,250 £65,000 £70,000
90th Percentile £77,500 £78,750 £82,500
England median annual salary £55,000 £55,000 £62,500
% change year-on-year - -12.00% +4.17%

Customer Service
Job Vacancy Trend in the North of England

Job postings citing Customer Service as a proportion of all IT jobs advertised in the North of England.
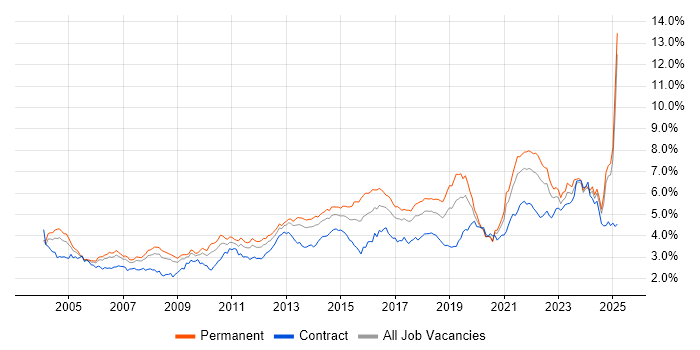
Job vacancy trend for Customer Service in the North of England

Customer Service
Salary Trend in the North of England

3-month moving average salary quoted in jobs citing Customer Service in the North of England.

Salary trend for Customer Service in the North of England

Customer Service
Salary Histogram in the North of England

Salary distribution for jobs citing Customer Service in the North of England over the 6 months to 15 August 2025.

Salary histogram for Customer Service in the North of England

Customer Service
Job Locations in the North of England

The table below looks at the demand and provides a guide to the median salaries quoted in IT jobs citing Customer Service within the North of England region over the 6 months to 15 August 2025. The 'Rank Change' column provides an indication of the change in demand within each location based on the same 6 month period last year.

Location Rank Change
on Same Period
Last Year
Matching
Permanent
IT Job Ads
Median Salary
Past 6 Months
Median Salary
% Change
on Same Period
Last Year
Live
Jobs
North West +2 550 £25,087 -25.11% 258
North East +8 503 £25,087 -33.10% 55
Yorkshire +11 425 £26,500 -18.46% 188
Customer Service
England

Customer Service
Co-occurring Skills and Capabilities in the North of England by Category

The follow tables expand on the table above by listing co-occurrences grouped by category. The same employment type, locality and period is covered with up to 20 co-occurrences shown in each of the following categories:

Application Platforms
1 32 (2.17%) Microsoft Exchange
2 25 (1.69%) SharePoint
3 1 (0.068%) CMS
3 1 (0.068%) Confluence
3 1 (0.068%) IIS
Applications
1 71 (4.80%) Microsoft Office
2 58 (3.92%) Microsoft Excel
3 12 (0.81%) Chatbot
4 6 (0.41%) Microsoft PowerPoint
5 1 (0.068%) Microsoft Project
5 1 (0.068%) MS Visio
Business Applications
1 6 (0.41%) SAP WM
2 5 (0.34%) NetSuite
2 5 (0.34%) Sage 200
2 5 (0.34%) Sage CRM
3 3 (0.20%) Oracle EBS
4 1 (0.068%) Dynamics AX
4 1 (0.068%) Dynamics CRM
4 1 (0.068%) Oracle Payroll
4 1 (0.068%) SAP S/4HANA
Cloud Services
1 150 (10.15%) Microsoft 365
2 79 (5.35%) Azure
3 32 (2.17%) SaaS
4 26 (1.76%) AWS
5 22 (1.49%) Power Platform
6 21 (1.42%) Entra ID
7 9 (0.61%) Power Automate
7 9 (0.61%) PowerApps
8 8 (0.54%) OneDrive
9 5 (0.34%) Cloud Computing
9 5 (0.34%) Dynamics 365
9 5 (0.34%) Mimecast
10 4 (0.27%) Nutanix
11 3 (0.20%) Azure DevOps
12 2 (0.14%) Azure Logic Apps
12 2 (0.14%) GCP
13 1 (0.068%) Azure Sentinel
13 1 (0.068%) GitHub
13 1 (0.068%) Google Workspace
13 1 (0.068%) Miro
Communications & Networking
1 873 (59.07%) Broadband
2 57 (3.86%) Firewall
3 48 (3.25%) VPN
4 44 (2.98%) DNS
5 41 (2.77%) WAN
6 38 (2.57%) LAN
7 34 (2.30%) DHCP
8 33 (2.23%) Wireless
9 27 (1.83%) TCP/IP
10 20 (1.35%) VLAN
11 17 (1.15%) VoIP
12 13 (0.88%) MPLS
13 10 (0.68%) Remote Desktop
13 10 (0.68%) Unified Communications
14 9 (0.61%) Wi-Fi
15 8 (0.54%) Internet
16 7 (0.47%) BGP
16 7 (0.47%) Intranet
16 7 (0.47%) SD-WAN
17 6 (0.41%) WLAN
Database & Business Intelligence
1 24 (1.62%) SQL Server
2 21 (1.42%) Power BI
3 10 (0.68%) Amazon RDS
4 5 (0.34%) BusinessObjects
5 4 (0.27%) Oracle Reports
5 4 (0.27%) Tableau
6 3 (0.20%) Relational Database
6 3 (0.20%) SQL Server Reporting Services
7 2 (0.14%) Azure SQL Database
8 1 (0.068%) Big Data
8 1 (0.068%) Crystal Reports
8 1 (0.068%) Data Warehouse
8 1 (0.068%) SQL Server Analysis Services
8 1 (0.068%) SQL Server Integration Services
Development Applications
1 5 (0.34%) JIRA
2 4 (0.27%) Git
3 3 (0.20%) Visual Studio
4 1 (0.068%) Jasmine
4 1 (0.068%) Jenkins
4 1 (0.068%) Karma Test Runner
General
1 587 (39.72%) Banking
2 539 (36.47%) Games
3 335 (22.67%) Social Skills
4 108 (7.31%) Finance
5 73 (4.94%) Analytical Skills
6 58 (3.92%) Retail
7 53 (3.59%) Organisational Skills
8 33 (2.23%) Marketing
9 25 (1.69%) Pharmaceutical
10 23 (1.56%) Manufacturing
10 23 (1.56%) Presentation Skills
11 22 (1.49%) Telecoms
12 20 (1.35%) Law
13 16 (1.08%) Billing
13 16 (1.08%) Military
14 13 (0.88%) Inclusion and Diversity
15 11 (0.74%) Advertising
16 10 (0.68%) Electronics
17 8 (0.54%) Public Sector
18 6 (0.41%) Legal
Job Titles
1 707 (47.83%) Customer Service Advisor
2 158 (10.69%) Customer Service Representative
3 114 (7.71%) Analyst
4 90 (6.09%) IT Support
5 73 (4.94%) Technical Support
6 69 (4.67%) Support Engineer
7 57 (3.86%) 1st Line Support
8 48 (3.25%) IT Analyst
9 45 (3.04%) Service Analyst
9 45 (3.04%) Support Analyst
9 45 (3.04%) Technical Engineer
10 44 (2.98%) Technical Support Engineer
11 34 (2.30%) Service Desk Analyst
12 31 (2.10%) Administrator
13 29 (1.96%) IT Engineer
13 29 (1.96%) IT Support Analyst
14 27 (1.83%) 2nd Line Support
15 26 (1.76%) Desktop Support
16 23 (1.56%) 1st Line Support Analyst
17 22 (1.49%) Lead
Libraries, Frameworks & Software Standards
1 4 (0.27%) .NET
1 4 (0.27%) CSS
1 4 (0.27%) HTML
1 4 (0.27%) LDAP
2 3 (0.20%) SOAP
3 2 (0.14%) .NET Core
3 2 (0.14%) .NET Framework
3 2 (0.14%) ASP.NET
3 2 (0.14%) Bootstrap
3 2 (0.14%) CSS3
3 2 (0.14%) HTML5
3 2 (0.14%) jQuery
3 2 (0.14%) RESTful
3 2 (0.14%) XML
4 1 (0.068%) AngularJS
4 1 (0.068%) JSON
4 1 (0.068%) REST
4 1 (0.068%) RxJS
4 1 (0.068%) Sass
4 1 (0.068%) Web Services
Miscellaneous
1 73 (4.94%) Self-Motivation
2 38 (2.57%) Onboarding
3 35 (2.37%) Driving Licence
4 27 (1.83%) Management Information System
4 27 (1.83%) Social Media
5 24 (1.62%) EPoS
6 21 (1.42%) Mobile App
7 18 (1.22%) Data Protection Act
8 11 (0.74%) Digital Signage
8 11 (0.74%) Renewable Energy
9 9 (0.61%) Data Centre
10 8 (0.54%) Augmented Reality
10 8 (0.54%) Virtual Reality
11 6 (0.41%) Handset
11 6 (0.41%) Microsoft Licensing
11 6 (0.41%) Private Cloud
12 5 (0.34%) Enterprise Software
12 5 (0.34%) IoT
12 5 (0.34%) LIMS
12 5 (0.34%) Mainframe
Operating Systems
1 169 (11.43%) Windows
2 64 (4.33%) Windows Server
3 37 (2.50%) Android
4 35 (2.37%) Windows 10
5 17 (1.15%) Linux
6 4 (0.27%) Windows Vista
7 3 (0.20%) Mac OS
8 2 (0.14%) Solaris
8 2 (0.14%) Unix
9 1 (0.068%) AIX
9 1 (0.068%) Oracle Linux
9 1 (0.068%) Red Hat Enterprise Linux
Processes & Methodologies
1 711 (48.11%) Problem-Solving
2 116 (7.85%) ITIL
3 71 (4.80%) Service Delivery
4 67 (4.53%) CRM
4 67 (4.53%) Customer Experience
5 59 (3.99%) Continuous Improvement
6 51 (3.45%) Coaching
7 49 (3.32%) Process Improvement
8 47 (3.18%) Time Management
9 45 (3.04%) ITSM
10 41 (2.77%) Business Development
11 38 (2.57%) Mathematics
12 36 (2.44%) Mentoring
13 35 (2.37%) Artificial Intelligence
14 31 (2.10%) Service Management
15 30 (2.03%) Decision-Making
16 29 (1.96%) Asset Management
17 28 (1.89%) Business Intelligence
17 28 (1.89%) Customer-Centricity
18 26 (1.76%) Line Management
Programming Languages
1 26 (1.76%) SQL
2 5 (0.34%) PowerShell
2 5 (0.34%) Python
3 4 (0.27%) JavaScript
4 3 (0.20%) C#
5 2 (0.14%) Java
5 2 (0.14%) T-SQL
6 1 (0.068%) Perl
6 1 (0.068%) Ruby
6 1 (0.068%) TypeScript
6 1 (0.068%) VB
6 1 (0.068%) VB.NET
6 1 (0.068%) VB6
Qualifications
1 77 (5.21%) Degree
2 46 (3.11%) DBS Check
3 18 (1.22%) Microsoft Certification
4 16 (1.08%) HNC
4 16 (1.08%) SC Cleared
4 16 (1.08%) Security Cleared
5 15 (1.01%) CCNA
5 15 (1.01%) Cisco Certification
6 12 (0.81%) A+ Certification
7 9 (0.61%) Network+ Certification
8 8 (0.54%) Master's Degree
9 7 (0.47%) ITIL Foundation Certificate
9 7 (0.47%) MOS
9 7 (0.47%) PMI Certification
9 7 (0.47%) PMP
10 6 (0.41%) Computer Science Degree
11 5 (0.34%) ACCA
11 5 (0.34%) CIMA
11 5 (0.34%) MCSA
12 2 (0.14%) Azure Certification
Quality Assurance & Compliance
1 76 (5.14%) SLA
2 7 (0.47%) GDPR
3 5 (0.34%) 21 CFR Part 11
3 5 (0.34%) GxP
3 5 (0.34%) QA
4 4 (0.27%) Data Quality
5 3 (0.20%) ISO/IEC 27001
6 2 (0.14%) ISO 14001
6 2 (0.14%) ISO 9001
6 2 (0.14%) PMO
6 2 (0.14%) Sarbanes-Oxley
7 1 (0.068%) Accessibility
7 1 (0.068%) Cyber Essentials
System Software
1 132 (8.93%) Active Directory
2 45 (3.04%) Hyper-V
3 38 (2.57%) VMware Infrastructure
4 10 (0.68%) Virtual Machines
5 2 (0.14%) Virtual Desktop
6 1 (0.068%) XenApp
6 1 (0.068%) XenDesktop
Systems Management
1 33 (2.23%) Microsoft Intune
2 13 (0.88%) SCCM
3 11 (0.74%) FortiGate
4 8 (0.54%) Jamf Pro
5 6 (0.41%) Proxmox
6 5 (0.34%) AirWatch
6 5 (0.34%) Ansible
7 4 (0.27%) Single Sign-On
7 4 (0.27%) SmoothWall
8 3 (0.20%) Autotask
9 1 (0.068%) Kubernetes
9 1 (0.068%) Puppet
Vendors
1 898 (60.76%) BT
2 240 (16.24%) Microsoft
3 50 (3.38%) Cisco
4 46 (3.11%) VMware
5 27 (1.83%) ServiceNow
6 20 (1.35%) Apple
7 18 (1.22%) Zoho
8 15 (1.01%) Meraki
8 15 (1.01%) SonicWALL
9 13 (0.88%) SAP
10 11 (0.74%) Sage
10 11 (0.74%) Veeam
11 10 (0.68%) WatchGuard
12 9 (0.61%) PayPal
13 8 (0.54%) Dell
13 8 (0.54%) Salesforce
14 7 (0.47%) Aruba
14 7 (0.47%) Fortinet
15 6 (0.41%) Huawei
15 6 (0.41%) Polycom