Terraform Job Trends in the North of England

Terraform
England > North of England

The table below provides summary statistics and salary benchmarking for jobs advertised in the North of England requiring Terraform skills. It covers vacancies from the 6 months leading up to 16 September 2025, with comparisons to the same periods in the previous two years.

6 months to
16 Sep 2025
Same period 2024 Same period 2023
Rank 64 63 47
Rank change year-on-year -1 -16 +2
Permanent jobs citing Terraform 426 417 510
As % of all permanent jobs advertised in the North of England 4.56% 2.97% 5.59%
As % of the Systems Management category 32.40% 40.64% 34.60%
Number of salaries quoted 140 236 436
10th Percentile £51,250 £46,250 £48,750
25th Percentile £57,500 £50,000 £57,500
Median annual salary (50th Percentile) £67,750 £67,500 £70,000
Median % change year-on-year +0.37% -3.57% -
75th Percentile £77,500 £80,000 £80,313
90th Percentile £87,500 £86,250 £90,000
England median annual salary £75,000 £75,000 £75,000
% change year-on-year - - -3.23%

All Systems Management Skills
North of England

Terraform falls under the Systems Management category. For comparison with the information above, the following table provides summary statistics for all permanent job vacancies requiring systems management skills in the North of England.

Permanent vacancies with a requirement for systems management skills 1,315 1,026 1,474
As % of all permanent jobs advertised in the North of England 14.07% 7.30% 16.17%
Number of salaries quoted 435 610 1,131
10th Percentile £26,550 £34,975 £32,200
25th Percentile £32,000 £44,263 £43,750
Median annual salary (50th Percentile) £53,500 £54,500 £62,500
Median % change year-on-year -1.83% -12.80% +4.17%
75th Percentile £72,250 £69,500 £77,715
90th Percentile £82,500 £81,250 £85,000
England median annual salary £62,500 £66,000 £65,351
% change year-on-year -5.30% +0.99% -6.64%

Terraform
Job Vacancy Trend in the North of England

Job postings citing Terraform as a proportion of all IT jobs advertised in the North of England.
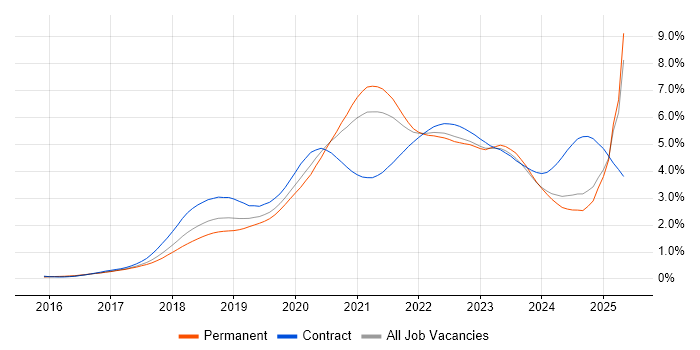
Job vacancy trend for Terraform in the North of England

Terraform
Salary Trend in the North of England

Salary distribution trend for jobs in the North of England citing Terraform.

Salary distribution trend for jobs in the North of England citing Terraform

Terraform
Salary Histogram in the North of England

Salary distribution for jobs citing Terraform in the North of England over the 6 months to 16 September 2025.

Salary histogram for Terraform in the North of England

Terraform
Job Locations in the North of England

The table below looks at the demand and provides a guide to the median salaries quoted in IT jobs citing Terraform within the North of England region over the 6 months to 16 September 2025. The 'Rank Change' column provides an indication of the change in demand within each location based on the same 6 month period last year.

Location Rank Change
on Same Period
Last Year
Matching
Permanent
IT Job Ads
Median Salary
Past 6 Months
Median Salary
% Change
on Same Period
Last Year
Live
Jobs
North West +15 357 £65,000 -7.14% 72
Yorkshire -44 56 £70,000 +7.69% 37
North East +7 13 £65,000 +5.69% 25
Terraform
England

Terraform
Co-occurring Skills and Capabilities in the North of England by Category

The follow tables expand on the table above by listing co-occurrences grouped by category. The same employment type, locality and period is covered with up to 20 co-occurrences shown in each of the following categories:

Application Platforms
1 10 (2.35%) Apache Spark
2 4 (0.94%) Apache
3 3 (0.70%) IIS
4 2 (0.47%) OpenStack
5 1 (0.23%) Cloud Foundry
5 1 (0.23%) Jupyter
5 1 (0.23%) nginx
5 1 (0.23%) SharePoint
Applications
1 2 (0.47%) Microsoft Office
1 2 (0.47%) MS Visio
Business Applications
1 1 (0.23%) Payment Gateway
1 1 (0.23%) SAP S/4HANA
Cloud Services
1 111 (26.06%) AWS
2 78 (18.31%) Azure
3 31 (7.28%) AWS CloudFormation
4 25 (5.87%) Azure DevOps
5 23 (5.40%) GCP
6 22 (5.16%) Serverless
7 21 (4.93%) SaaS
8 20 (4.69%) Amazon CloudWatch
8 20 (4.69%) AWS Lambda
9 18 (4.23%) GitHub
10 14 (3.29%) Amazon S3
11 13 (3.05%) Amazon EKS
12 12 (2.82%) GitHub Actions
12 12 (2.82%) PaaS
13 11 (2.58%) Amazon EC2
14 10 (2.35%) Amazon SQS
14 10 (2.35%) Virtual Private Cloud
15 8 (1.88%) AWS CodeBuild
15 8 (1.88%) IaaS
15 8 (1.88%) Route 53
Communications & Networking
1 256 (60.09%) VPN
2 251 (58.92%) Cisco IOS
3 12 (2.82%) WAN
4 10 (2.35%) Firewall
4 10 (2.35%) LAN
5 9 (2.11%) DNS
6 5 (1.17%) TCP/IP
7 4 (0.94%) DHCP
8 3 (0.70%) Internet
8 3 (0.70%) VLAN
9 2 (0.47%) Cisco Nexus
9 2 (0.47%) DWDM
9 2 (0.47%) HTTP
9 2 (0.47%) Network Security
9 2 (0.47%) SAN
9 2 (0.47%) SSL
10 1 (0.23%) MQTT
Database & Business Intelligence
1 21 (4.93%) DynamoDB
2 8 (1.88%) Amazon RDS
3 6 (1.41%) Delta Lake
3 6 (1.41%) Metadata
3 6 (1.41%) Spark SQL
4 5 (1.17%) Big Data
4 5 (1.17%) NoSQL
4 5 (1.17%) SQL Server
5 3 (0.70%) Amazon Athena
5 3 (0.70%) PostgreSQL
6 2 (0.47%) Azure SQL Database
6 2 (0.47%) Data Lake
6 2 (0.47%) MongoDB
6 2 (0.47%) MySQL
6 2 (0.47%) Redis
7 1 (0.23%) Amazon Aurora
7 1 (0.23%) Apache Cassandra
7 1 (0.23%) Data Warehouse
7 1 (0.23%) DocumentDB
7 1 (0.23%) SAP HANA
Development Applications
1 28 (6.57%) Jenkins
2 21 (4.93%) GitLab
3 10 (2.35%) CircleCI
4 9 (2.11%) Git
5 8 (1.88%) SonarQube
6 6 (1.41%) MLflow
7 5 (1.17%) Sonatype Nexus
8 3 (0.70%) JUnit
8 3 (0.70%) Maven
8 3 (0.70%) TeamCity
9 2 (0.47%) Artifactory
9 2 (0.47%) Bitbucket
9 2 (0.47%) JIRA
9 2 (0.47%) Octopus Deploy
10 1 (0.23%) Atlassian Bamboo
10 1 (0.23%) git-flow
10 1 (0.23%) Jaeger
10 1 (0.23%) Mocha
10 1 (0.23%) Sinon.JS
General
1 258 (60.56%) Inclusion and Diversity
2 253 (59.39%) Analytical Skills
3 41 (9.62%) Social Skills
4 21 (4.93%) Finance
5 9 (2.11%) Games
6 8 (1.88%) Banking
7 6 (1.41%) Retail
8 4 (0.94%) Public Sector
9 3 (0.70%) Law
10 2 (0.47%) Organisational Skills
11 1 (0.23%) Aviation
11 1 (0.23%) Health Technology
11 1 (0.23%) Influencing Skills
Job Titles
1 262 (61.50%) Infrastructure Engineer
2 58 (13.62%) Senior
3 39 (9.15%) DevOps Engineer
4 32 (7.51%) Lead
5 29 (6.81%) Cloud Engineer
6 22 (5.16%) Developer
7 20 (4.69%) Software Engineer
8 16 (3.76%) Azure Engineer
9 15 (3.52%) Senior Cloud Engineer
10 14 (3.29%) Senior Developer
11 13 (3.05%) Senior Software Engineer
12 10 (2.35%) Lead DevOps
12 10 (2.35%) Platform Engineer
13 9 (2.11%) Java Developer
13 9 (2.11%) Lead DevOps Engineer
13 9 (2.11%) Operations Engineer
13 9 (2.11%) Senior Java Developer
14 8 (1.88%) Architect
14 8 (1.88%) AWS Engineer
14 8 (1.88%) Senior Infrastructure Engineer
Libraries, Frameworks & Software Standards
1 263 (61.74%) Elastic Stack
2 33 (7.75%) React
3 27 (6.34%) .NET
4 17 (3.99%) Node.js
5 15 (3.52%) .NET Core
6 13 (3.05%) ARM Templates
6 13 (3.05%) REST
7 10 (2.35%) Lambda Expressions
8 9 (2.11%) YAML
9 8 (1.88%) Amazon Corretto
9 8 (1.88%) GraphQL
10 7 (1.64%) Pandas
10 7 (1.64%) scikit-learn
10 7 (1.64%) TensorFlow
11 6 (1.41%) NumPy
11 6 (1.41%) PySpark
11 6 (1.41%) PyTorch
11 6 (1.41%) RESTful
11 6 (1.41%) Spring
11 6 (1.41%) Spring Boot
Miscellaneous
1 251 (58.92%) Cyberattack
2 37 (8.69%) Cloud Native
3 18 (4.23%) Hybrid Cloud
4 12 (2.82%) Data Centre
5 8 (1.88%) e-Learning
6 7 (1.64%) Data Protection Act
7 6 (1.41%) Distributed Systems
7 6 (1.41%) Linux Command Line
7 6 (1.41%) Product Ownership
8 5 (1.17%) Operational Technology
8 5 (1.17%) SCADA
9 4 (0.94%) Enterprise Cloud
9 4 (0.94%) Greenfield Project
10 3 (0.70%) AI Agents
10 3 (0.70%) Distributed Architecture
10 3 (0.70%) Public Cloud
10 3 (0.70%) Security Posture
11 2 (0.47%) Cyber Threat
11 2 (0.47%) Legacy Systems
12 1 (0.23%) Data Structures
Operating Systems
1 290 (68.08%) Linux
2 271 (63.62%) Windows
3 251 (58.92%) Android
4 14 (3.29%) Unix
5 9 (2.11%) Debian
5 9 (2.11%) Ubuntu
6 4 (0.94%) CentOS
6 4 (0.94%) Windows Server
7 3 (0.70%) Red Hat Enterprise Linux
Processes & Methodologies
1 363 (85.21%) DevOps
2 284 (66.67%) Problem-Solving
3 275 (64.55%) Infrastructure Engineering
4 268 (62.91%) Platform Engineering
5 264 (61.97%) Line Management
6 255 (59.86%) Risk Management
6 255 (59.86%) Task Automation
7 252 (59.15%) Mathematics
7 252 (59.15%) Storage Management
8 106 (24.88%) CI/CD
9 102 (23.94%) Infrastructure as Code
10 58 (13.62%) Agile
11 41 (9.62%) Containerisation
11 41 (9.62%) Software Engineering
12 30 (7.04%) Mentoring
13 28 (6.57%) Infrastructure Automation
14 27 (6.34%) Microservices
15 26 (6.10%) TDD
16 23 (5.40%) Cloud Security
16 23 (5.40%) Continuous Integration
Programming Languages
1 320 (75.12%) Python
2 277 (65.02%) Bash
3 272 (63.85%) PowerShell
4 32 (7.51%) TypeScript
5 27 (6.34%) C#
5 27 (6.34%) SQL
6 23 (5.40%) Java
7 21 (4.93%) JavaScript
8 11 (2.58%) Go
9 10 (2.35%) Bicep
10 3 (0.70%) PHP
10 3 (0.70%) Ruby
10 3 (0.70%) Scala
11 2 (0.47%) Rust
11 2 (0.47%) Shell Script
12 1 (0.23%) R
12 1 (0.23%) T-SQL
Qualifications
1 14 (3.29%) Azure Certification
2 7 (1.64%) Degree
3 5 (1.17%) Computer Science Degree
3 5 (1.17%) TOGAF Certification
4 4 (0.94%) AWS Certification
4 4 (0.94%) Microsoft Certification
4 4 (0.94%) Security Cleared
5 3 (0.70%) DV Cleared
6 2 (0.47%) CCNA
6 2 (0.47%) CCNP
6 2 (0.47%) Cisco Certification
6 2 (0.47%) JNCIA
6 2 (0.47%) JNCIS
6 2 (0.47%) SC Cleared
7 1 (0.23%) MCSD
7 1 (0.23%) Postgraduate
Quality Assurance & Compliance
1 6 (1.41%) QA
2 3 (0.70%) GDPR
3 2 (0.47%) PCI DSS
4 1 (0.23%) ISO/IEC 27001
4 1 (0.23%) SOC 2
System Software
1 327 (76.76%) Docker
2 255 (59.86%) vSphere
3 252 (59.15%) Hyper-V
4 251 (58.92%) VMware NSX
5 7 (1.64%) Active Directory
5 7 (1.64%) VMware Infrastructure
6 3 (0.70%) Virtual Desktop
6 3 (0.70%) Virtual Machines
7 2 (0.47%) KVM
7 2 (0.47%) QEMU
8 1 (0.23%) Virtual Servers
8 1 (0.23%) VMware ESXi
Systems Management
1 305 (71.60%) Ansible
2 85 (19.95%) Kubernetes
3 27 (6.34%) Prometheus
4 26 (6.10%) Grafana
5 6 (1.41%) Kubeflow
6 5 (1.17%) Argo
6 5 (1.17%) Puppet
7 4 (0.94%) Progress Chef
8 3 (0.70%) Istio
8 3 (0.70%) SCCM
9 2 (0.47%) Control-M
9 2 (0.47%) Docker Swarm
10 1 (0.23%) Karpenter
10 1 (0.23%) Microsoft Intune
10 1 (0.23%) Proxmox
10 1 (0.23%) Salt
10 1 (0.23%) Single Sign-On
10 1 (0.23%) vCenter Server
Vendors
1 260 (61.03%) Cisco
2 259 (60.80%) Splunk
3 251 (58.92%) 3PAR
3 251 (58.92%) Juniper
4 28 (6.57%) Microsoft
5 16 (3.76%) VMware
6 14 (3.29%) Databricks
7 7 (1.64%) Aruba
7 7 (1.64%) Fortinet
7 7 (1.64%) Mellanox
7 7 (1.64%) NVIDIA
7 7 (1.64%) Palo Alto
8 6 (1.41%) Oracle
9 4 (0.94%) Atlassian
10 3 (0.70%) Foundry
10 3 (0.70%) Google
11 2 (0.47%) Arista
11 2 (0.47%) Salesforce
11 2 (0.47%) SaltStack
11 2 (0.47%) SAP